MetaTrader 5용 Expert Advisor 및 지표 - 83

Now, you have your own AUTO-CLOSE program ! Once your account target or drawdown hits, all open orders will be closed automatically. ========================================== INPUTS: Account target: Put the exact account target. Once the equity hits it or went above that, all orders closed. Please add buffer to consider slippage. Use fixed value or dynamic value: Choose whether you will need a fixed value or dynamic value for drawdown. DYNAMIC SETTINGS: Equity-based or Balance-based drawdo


Equity X è una utility che chiude tutte le posizioni ed eventuali ordini pendenti ad un importo prestabilito, è possibile fissare il bilancio del tuo conto quando il netto e uguale o superiore oppure uguale inferiore all'importo desiderato Ha integrato un sistema per la notifica mobile instantanea che genera il messaggio ad operazione avvenuta Uno strumento che permette di ottimizzare al massimo il rendimento del tuo investimento, è possibile utilizzarlo anche come gestore virtuale di take prof

Welcome to WarungFX https://t.me/warungfx ,
Please set autovalidation to false, input at the bottom under comment variable.
This bot can be use for managing your manual order from any device and in the same time open position based on price action when there is signal and no open order, Backtested 2013-2023 EURUSD M2, GBPUSD M2, default setting NZDUSD m15, default setting USDJPY H1, AUDCAD H1, USDCHF H1, EURCHF H1, GBPCAD H1, AUDJPY H1, using default setting. For Forex Pair I will be using 1

Our goal is to empower every trader with their own unique trading system.
Indicator - Red-Green Series
Ultimate simplicity: Red for uptrend, green for downtrend! It can be used independently or in combination with other indicators. This is a red-green indicator based on the crossover of two moving averages. We have more indicators in store and will be adding them gradually. Friends who make a purchase are kindly requested to contact us after their purchase.
In the world of financial tradi

Introducing Time Trading EA
Your reliable and customizable trading assistant! This Expert Advisor (EA) is designed to open an order every day at a specific time, allowing you to test any trading idea with ease and efficiency. With Time Trading EA, you have full control over your order parameters, including the order direction (buy or sell), lot size, stop loss (SL), and take profit (TP). All these parameters are pre-set but fully adjustable to suit your trading strategy. Try Time Trading EA
Introducing the Engulfing Goddess Metatrader 5 (MT5) Indicator , a revolutionary tool designed for traders who seek to harness the power of candlestick patterns in their trading strategy. This indicator is built on the principles of engulfing candlestick patterns , a popular method used by successful traders worldwide. Our Engulfing Goddess Indicator stands out with its ability to detect various kinds of engulfing patterns . It employs a range of filters, providing you with a comprehensive anal
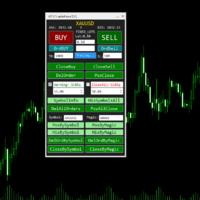
MT5TradePanel_V1 The panel supports market and pending orders Closing of positions by order type -trade -statistics - risk management - Trailing Stop -select the variant of risk calculation FIXED_LOTS, // fixed lots RISK_MONEY, // lots based on money RISK_RATIO // risk percent of account - percent of loss warning -percent od loss close all -show symbol info

HAshi-E is an enhanced way to analyze Heiken-Ashi signals.
Briefing:
Heiken-Ashi is particularly valued for its ability to filter out short-term volatility, making it a preferred tool for identifying and following trends, helps in decision-making regarding entry and exit points, and assists in distinguishing between false signals and genuine trend reversals. Unlike traditional candlestick charts, Heiken-Ashi candles are calculated using average values of previous bars, creating a smoother,
A very simple position sizing calculator to help traders calculate the right lot size per trade. It also places the order with one click. All inputs can be edited. So if you want to change the SL or TP or the lot size, you can do so before placing an order. The inputs are the following: SL - stop loss in pips (not points). set to 0 before placing an order to not add SL. TP - take profit in pips (not points). set to 0 before placing an order to not add TP. RISK - dollar amount to risk. i

Compared to simple or exponential moving averages, slow adaptive trend lines might offer a more nuanced view of the trend by adjusting their sensitivity based on market conditions. However, their slow nature might also mean they are late in signaling reversals when market conditions change rapidly - and that is the difference between them and our SlowAMA .
SlowAMA was designed to be a better long-term trend indicator than EMA and other Moving Averages. It uses our JurMA calculations, reducing

The Dragonfly Doji candlestick pattern is formed by one single candle. Here’s how to identify the Dragonfly Doji candlestick pattern: The candle has no body The wick at the bottom must be big At the top, it should have no wick, or be very small This 1-candle bullish candlestick pattern is a reversal pattern, meaning that it’s used to find bottoms. For this reason, we want to see this pattern after a move to the downside, showing that bulls are starting to take control. When a Dragonfly Doji cand

The Bullish Counterattack Line candlestick pattern is formed by two candles. Here’s how to identify the Bullish Counterattack candlestick pattern: The first candle is bearish and big The second candle is bullish and small There’s a gap between the close of the first candle and the open of the second candle They both close at the same level This 2-candle bullish candlestick pattern is a reversal pattern, meaning that it’s used to find bottoms. For this reason, we want to see this pattern after a

The Three Outside Up candlestick pattern is formed by three candles. Here’s how to identify the Three Outside Up candlestick pattern: The first candle is bearish and small The second candle is bullish and engulfs the first one completely The third candle is bullish and closes above the other ones This 3-candle bullish candlestick pattern is a reversal pattern, meaning that it’s used to find bottoms. For this reason, we want to see this pattern after a move to the downside, showing that bulls are

The Tweezer Bottom candlestick pattern is formed by two candles. Here’s how to identify the Tweezer Bottom candlestick pattern: The first candle is bearish The second candle is bullish The lows from both candles should be pretty much at the same level This 2-candle bullish candlestick pattern is a reversal pattern, meaning that it’s used to find bottoms. For this reason, we want to see this pattern after a move to the downside, showing that bulls are starting to take control. When a Tweezer Bott

The Bullish Harami candlestick pattern is formed by two candles. Here’s how to identify the Bullish Harami candlestick pattern: The first candle must be bearish and have a big body The second candle must be small and bullish The second candle is inside the body of the first candle This 2-candle bullish candlestick pattern is a reversal pattern, meaning that it’s used to find bottoms. For this reason, we want to see this pattern after a move to the downside, showing that bulls are starting to
Looking to boost your financial market results?
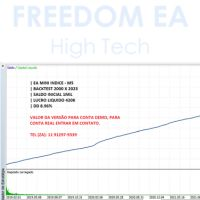
The EA Mini Index is the answer. Tested and enhanced since 2000, this expert advisor offers operations on the M5 chart, with an initial balance of R$ 1,000 and an impressive net profit of R$ 420,000 until 2023, maintaining a drawdown of only 8.96%.
Seize this unique opportunity to increase your profitability and operate more effectively.

Currency Strength Dynamic 통화 강도 동적(Currency Strength Dynamic)은 통화 강도를 나타내는 지표입니다. 통화 강도는 해당 통화가 속한 대부분 또는 모든 통화 쌍의 추세 방향을 나타냅니다.
이 지표는 MACD 지표와 유사하게 가장 인기 있는 28개 통화쌍(주요 통화쌍과 보조 통화쌍)의 이동 평균 간의 차이를 판독한 것을 기반으로 합니다.
장점 독특한 진동 계산 방법 특정 통화 라인을 비활성화하거나 활성화하는 버튼의 가용성 정보 테이블 2가지 유형의 경고: 표시 선이 교차할 때와 선이 지정된 수준을 교차할 때. 그려지는 막대 수는 선택 사항입니다. 각 사항을 자세히 살펴보겠습니다.
고유한 진동 계산 방법을 사용하면 지표가 오랫동안 최대값에 머물지 않고 미리 종료할 수 있습니다. 이는 발산 및 수렴의 친숙한 효과와 유사합니다. 이 방법에는 지정된 계산 기간과 판독값의 평활화 수준도 포함되어 있어 판독값이 더 매끄러워집니다. 계산에는

This indicator helps you identify support and resistance levels. Also it adds break points when level is broken. Price sometimes goes back to break point. It has 4 technical parameters and 4 buffers for expert advisors. Buffer indexes: 0 - Resistance, 1 - Support, 2 - Resistance break point, 3 - Support break point". Number of Levels: Determines how many levels are on graph ( if 3 - 3 levels of support and 3 levels of resistance) Tolerance in percentage %: This parameter is used to filter out
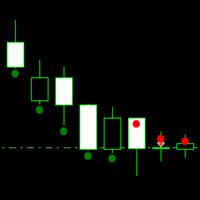
Simple EA with an self-made indicator and Grid. The Expertadvisor opens positions when the market behavior changed from bullish to bearish or vice versa. To determine the market behavior the indicator simply measures how many points it has moved up and down for the last X candles.
It then uses a simple grid strategy if the position turns into a loss. Grid levels can be defined specific to the market.
It depends on your personal preferences and the respective market which parameters should be
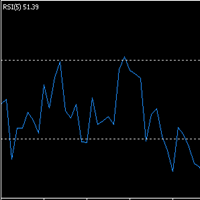
Simple EA with two indicators (SMA + RSI) and Grid. The Expertadvisor opens positions in the direction of the trend when the RSI line turns above 80 or below 20. It then uses a simple grid strategy if the position turns into a loss. Grid levels can be defined specific to the market.
It depends on your personal preferences and the respective market which parameters should be set and how. You have to test it yourself. The EA is programmed in such a way that optimization runs consume little time.
Prop Drawdown Manager is a sophisticated utility tool designed to assist traders in effectively managing and minimizing the impact of drawdowns within their forex trading accounts. Drawdowns, which represent the reduction in capital from peak to trough, are an inevitable aspect of trading, but they can be detrimental if not managed properly. This utility provides traders with a suite of features aimed at controlling drawdowns and preserving trading capital: 1. Drawdown Thresholds : Traders can

Subscribe to the 'MA7 Trading' channel to receive notifications about new programs, updates and other information. Ask questions in the profile on the MQL5 .
Description of work
The 'MA7 Agave' indicator is based on the standard Average Directional Movement Index (ADX) indicator. Shows the intersection of the +DI and -DI lines. Detailed information about the 'MA7 Agave' indicator.
Indicator settings
General settings: ADX period - Average Directional Movement Index indicator period.
'MA7

The underlying strategy of this indicator is based on identifying momentum in the market and attempting to capture the direction of the trend through transitions between bullish and bearish moments. Utilizing bands around the RWMA allows for identifying potential overbought and oversold situations in the market.
1. Calculation of the Range Momentum Index (RMI): The RMI is based on a combination of the Relative Strength Index (RSI) and the Money Flow Index (MFI), both of which are momentum ind

Exclusive FOREX account HEDGE FuzzyLogicTrendEA is based on fuzzy logic strategy based on analysis 5 indicators and filters.
When the EA analysis all this indicators, it decides, based on its fuzzy strategy, which trade will be better: sell or buy.
As additional functions, it´s possible defines spread maximum, stop loss and others.
Recomm. Symbol: EURUSD, AUDUSD, GBPUSD, NZDUSD, USDCAD, AUDCAD, EURCAD e USDJPY
Recomm. timeframe: H1.
Backtest were done on EURUSD, H1, 01/07/2023 - 26/0
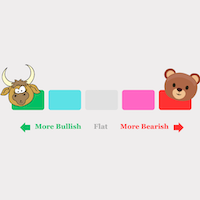
By using (MOMENTUM and VELOCITY and ACCELLERATION) and the power of machine learning we can accurately calculate the current strength of the currencies of each time frame. - It's really easy to use: Choosing to trade between currency pairs that have clear and dominant trends will give you a great advantage. -The currency pair strength meter is rated from -100 to + 100

Introducing the True Currency Strength Indicator - Your Ultimate Guide to Market Mastery! Are you tired of guesswork when it comes to trading? Ready to elevate your trading strategy to a whole new level? Look no further! We present to you the True Currency Strength Indicator - the game-changer in the world of Forex trading. Unleash the Power of Multi-Currency Analysis: Gain a competitive edge with our revolutionary indicator that goes beyond traditional single-currency analysis. The Tru
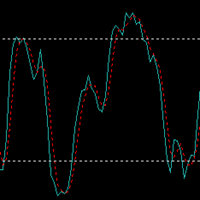
Simple EA with two indicators (SMA + STOCHASTIC) and Grid. The Expertadvisor opens positions in the direction of the trend when the lines of the Stochastic indicator intersect in the swing high or swing low area. It then uses a simple grid strategy if the position turns into a loss. Grid levels can be defined specific to the market.
It depends on your personal preferences and the respective market which parameters should be set and how. You have to test it yourself. The EA is programmed in suc
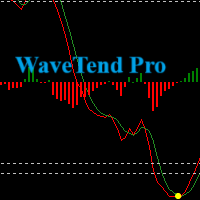
Introducing our Wave Trend Oscillator Indicator , exclusively designed for MetaTrader 5 . This advanced tool is a must-have for traders who seek precision and efficiency in their trading journey. Our oscillator is built on the principles of wave trend analysis , capturing the ebb and flow of market trends with unparalleled accuracy. It helps traders identify potential buying and selling points based on market wave patterns, enabling you to stay ahead of the market. One of the key features of ou

Uncover high-probability opportunities in trending markets with the Brilliant Entries Indicator. Its clear visual signals can be followed and incorporated with market structure to provide you with accurate entries. Give it a try and gain an edge in your trading strategy.
It can be used on it's own but i highly recommend to used it as part of a wider strategy to provide you with confluence.
It works on all timeframes but will work very good doing market structure 2 x timeframes higher and t

In the realm of technical analysis, ParbMA emerges as a highly intuitive tool for examining the Parabolic SAR trend . This innovative approach leverages a customizable line, distinguished by its versatility in color, shape, and width options. Such flexibility enhances visual analysis and significantly aids in strategizing and decision-making.
The ParbMA (Parabolic Moving Average) is a custom technical indicator that combines the concepts of J. Welles Wilder's Parabolic SAR (Stop and Reverse)

Limited Time Offer! Only $ 150 USD ! The price will increase by $100 USD after every 10th purchase ! Final price: $ 15 000 USD DESCRIPTION : Attention! Contact me immediately after purchase to receive setup instructions!
The Expert Advisor (EA) is designed for capital distribution. We have made every effort to ensure that the minimum deposit is $100 USD.
This advisor is intended for trading with the broker Deriv. The EA has been optimized over the past year, starting

On-Balance Volume (OBV) is a technical indicator that relates volume and price to identify price movements. The basic idea behind OBV is that changes in volume generally precede price changes. The indicator accumulates volumes for periods when the price closes higher and subtracts volumes for periods when the price closes lower. This results in a value used to identify the direction of the asset's trend.
The interpretation of the OBV is simple: a rising OBV suggests that buyers are willing to

Designed by Welles Wilder for daily commodity charts, the ADXW is now used in various markets by technical traders to assess the strength of a trend or even a trend for short- or long-term trades.
The ADXW uses a positive (DI+) and negative (DI-) directional indicator in addition to its trend line (ADX).
According to Wilder, a trend has strength when the ADX signal is above 25; the trend is weak (or the price has no trend) when the ADX is below 20. The absence of a trend does not mean that

The Adaptive Market Navigator(AMN) EA is an automated trend-based trading advisor combining the advantages of ATR, Bears Power and Moving Average indicators. The used strategy is well suited for both beginners and experienced traders.
The minimum deposit is $100 for a 1:100 leverage.
I recommend to use a 1:100 ECN account with a low spread and a fast VPS.
Optimized for EURUSD pair on 1H timeframe.
Due to the simplicity and convenience of this EA every user can give it a try and choose t

Position Manager serves as an expert advisor (EA) designed to enhance your trading experience by providing a user-friendly panel for intuitive management of your positions. This tool empowers you with a seamless interface, allowing for efficient handling of trades and improved control over your trading positions. The primary objective of Position Manager is to simplify and streamline the management of your positions, enabling you to make informed decisions with ease. Through its intuitive design

Nuker shows a practical functionality by examining the length of the preceding candle and taking action when it exceeds a predetermined threshold. By considering the historical context of candle lengths, Nuker response to candle length variations. Backtest was perform using in sample data from 2012 until 2019 and out of sample from 2020 to the middle of 2023. As you can see in the picture below, the results are fantastic in the last 3 years. It is live since August 2023, also providing an excele

CoinHarbor uses a seasonal pattern for the purchase and sale of Bitcoin . The primary aim of this strategy is to minimizing drawdown (DD). It's important to note that this approach is uniquely applicable solely to Bitcoin transactions, demonstrating a clear advantage in this specific asset. In essence, the strategy is structured to ensure a thoughtful balance between risk mitigation and profit optimization in the context of Bitcoin's distinct characteristics. The only configuration required is

Unlock the Precision of Market Movements with OrderBlock Precision Trader
Welcome to the future of trading, where precision meets profitability. OrderBlock Precision Trader is not just an expert advisor; it's your personal trading ally designed to elevate your strategies and optimize your results. Packed with advanced features and a comprehensive trading approach, this EA opens the door to a new era of trading excellence.
Are you ready to elevate your trading game and gain an edge in the fin
****** PRESENTIAMO CBAlgoGrid EA MT5 ******* live account CBAlgoGrid + CBAlgoNews operational from 01/23/2024
Il CBAlgoGrid EA rappresenta un sofisticato sistema automatico progettato per operare nel mercato Forex,
capitalizzando i movimenti giornalieri ed in particolare nelle fasi di consolidamento.
Le operazioni vengono attivate in risposta a modelli specifici identificati tramite l'analisi di indicatori tecnici come ADX, media mobile e RSI.
Grazie alla gestione avanzata delle transaz

암호화폐 라이브 틱 데이터 입찰 및 EA의 장부 깊이
사용 가능한 거래소 :
1. 바이낸스 현물(활성 차트 창에서 주문장 깊이 지원) 및 선물(여러 주문장 깊이 지원)
2. Kucoin 현물 및 선물, 활성 차트 창에서 주문장 깊이 지원
3. Bybit 선물 및 인버스 선물 틱 데이터 마지막 매수호가
다가오는 거래소 : OKX, MEXC 등..
특징 :
1. 입찰 및 매도 정보가 포함된 실시간 틱 데이터
2. 최적의 입찰 요청 및 주문 수량, 사용자는 설정에서 깊이를 활성화/비활성화할 수 있습니다.
3. 로드 이력 : Open High Low Close Volume 및 Tick Volume 데이터 업데이트
4. 자동 업데이트 내역 : MT5 단말기 재시작 시 누락된 막대 채우기
5. 암호화폐 데이터에 대한 Strategy Tester를 사용하여 전문가 자문가와 함께 암호화폐 기호 틱에 대한 모든 전략을 백테스트할 수 있습니다

Smart Manager Dashboard - with auto virtual TP and auto virtual SL for all trades. [Converted from MT4 version - All screenshots are from MT4]
-this EA is a powerful trade manager that can manage all symbols and all trades at once , all from one chart so it is a must have tool for every trader who keeps more trades at once. -it mainly does 2 things : INFO ABOUT TRADES and CLOSING TRADES (grouped by their symbol, so with this tool it is very easy and fast to manage even hundred

The White Marubozu candlestick pattern is formed by one single candle. Here’s how to identify the White Marubozu candlestick pattern: One single bullish candle The body must be big The wicks should be small or non-existent This 1-candle bullish candlestick pattern is a reversal pattern, meaning that it’s used to find bottoms. For this reason, we want to see this pattern after a move to the downside, showing that bulls are starting to take control. When a White Marubozu candlestick pattern ap

The Three White Soldiers candlestick pattern is formed by three candles. Here’s how to identify the Three White Soldiers candlestick pattern: Three consecutive bullish candles The bodies should be big The wicks should be small or non-existent This 3-candle bullish candlestick pattern is a reversal pattern, meaning that it’s used to find bottoms. For this reason, we want to see this pattern after a move to the downside, showing that bulls are starting to take control. When a Three White Soldi

The Three Inside Up candlestick pattern is formed by three candles. Here’s how to identify the Three Inside Up candlestick pattern: The first candle must be bearish The second candle must be bullish The close of the second candle should ideally be above the 50% level of the body of the first one The third candle should close above the first one This 3-candle bullish candlestick pattern is a reversal pattern, meaning that it’s used to find bottoms. For this reason, we want to see this pattern

The Morning Star candlestick pattern is formed by three candles. Here’s how to identify the Morning Star candlestick pattern: The first candle must be bearish The third candle must be bullish The second candle must be small compared to the others, like a Doji or a Spinning Top The color of the second candle doesn’t matter Ideally, the body of the second candle shouldn’t overlap with the bodies of the other two candles This 3-candle bullish candlestick pattern is a reversal pattern, meaning t

그만큼 피어싱 촛대 패턴 두 개의 양초로 구성됩니다. 피어싱 촛대 패턴을 식별하는 방법은 다음과 같습니다. 첫 번째 캔들은 약세여야 합니다. 두 번째 캔들은 강세여야 합니다 두 번째 캔들의 시가는 첫 번째 캔들보다 낮아야 합니다. (갭이 있습니다) 두 번째 캔들의 종가는 첫 번째 캔들의 몸통 수준의 50% 위에 있어야 합니다. 이 2양봉 강세 촛대 패턴은 반전 패턴으로, 바닥을 찾는 데 사용됩니다. 이러한 이유로 우리는 하락세로 이동한 후 이 패턴을 보고 황소가 주도권을 잡기 시작했음을 보여주고 싶습니다. 피어싱 촛대 패턴이 올바른 위치에 나타나면 다음이 표시될 수 있습니다. 하락 추세의 끝과 상승 추세의 시작 하락세 종료, 상승 추세 재개 EA Piercing GA는 통화 쌍, 지수, 금속, 상품, 암호화폐 등 모든 종류의 기호에 대해 작동합니다. ***Buy Piercing GA EA and you could get 2GA EAs for free !*
" Base Market Signals " A powerful and innovative technical analysis indicator designed to revolutionize your trading experience. Engineered by Southern Star Trading, this indicator is your key to unlocking profitable market insights in the ever-changing world of financial markets.
Key Features:
1. Dynamic Signal Detection: Base Market Signals employs sophisticated algorithms to dynamically identify potential trend reversal points, providing you with timely and accurate signals.
2. Versat

A simple and reliable advisor for Gold XAUUSD . MT5 Can be set to any timeframe. The advisor uses several features of Gold trading: - when the strategy is simpler, the more reliable it is; - the best deals on Gold are made only in Buy; - the best deals on Gold are made only on Fridays.
Trading is carried out only with a fixed lot. The advisor will be an excellent addition to your trading portfolio strategies.
The advisor can withstand large slippages and large spread widening, whi

Flat è una utility pensata per chi ama operare con take profit e stop loss virtuali ed ordini di copertura come sistema di protezione del capitale, ma a volte ad esempio la notte non è possibile operare quindi si è costretti ad intervenire nel momento e nel modo sbagliato Facciamo un esempio, dopo aver ricevuto un segnale ti posizioni sul mercato con una posizione Long ma il mercato a bassi volumi e comprendi che il tuo posizionamento è valido ma bisogna attendere più di quanto pensavi fosse ne

Простой индикатор тренда в NRTR виде с отрисовкой линий стоплосса и тейпрофита, цвет и направление движения которых определяются действующим трендом. Индикатор имеет возможность подавать алерты, отправлять почтовые сообщения и push-сигналы при смене направления тренда. Следует учесть что значение входного параметра индикатора Deviation of the take profit line in points для каждого финансового актива на каждом таймфрейме необходимо подбирать индивидуально!
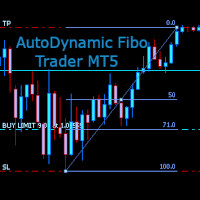
AutoDynamic Fibo Trader is a simple utility that allows the user to place a buy or sell limit or order based on the last fibonacci object drawn on the chart. This is to help the user to significantly reduce the amount of time the user takes to place a trade. All you need to do is draw a fib object with the low and high levels of where you want your stop loss and take profit to be, and decide where an entry level should be by specifying a fibo percentage level. The utility will automatically r

DeepX Black Edition Expert Advisor is a cutting-edge trading tool meticulously designed for traders seeking a robust and low-risk strategy. Leveraging the power of candlestick patterns, this specialist excels in trend detection, ensuring timely market entry and exit points. With a predefined profit limit and loss limit, the expert advisor prioritizes risk management, providing users with a secure trading environment. Optimized for the H4 time frame, this expert aligns with traders who prefer a b

Holeshot MT5 is a highly effective reversion trading system that leverages the power of momentum, and custom trend indicators to detect high-probability trading opportunities U-Turn areas to exploit. When demoing the system use this link below to get sample set files for your account size:
Holeshot MT5 Demo Set Files
Launch Sales The Launch Sale is $250, the first 10 believers in this product would receive this outstanding EA at our launch price. ***Buy Holeshot MT5 and you could get the P

I'm proudly introducing "Spread Eliminator" - Your Ultimate Solution against High Spreads in Forex Trading! Are you tired of hitting Stop Losses or having pending orders triggered at a bad price due to high spreads while trading? All this is now over with our revolutionary EA , Spread Eliminator! Can be used on Prop Firms that enforce high overnight spreads and/or high spreads during high volatile market conditions. Key Features: Smart Spread Monitoring: Spread Eliminator constantly monitors mar

A simple script to remove all indicators from the current chart/ all charts.
How to use: Simply double-click the script, choose either delete all indicators from this chart or all charts, and all is set.
Terminate once perform the deletion, so don't worry about constantly deleting your setup indicator.
Thanks for purchasing, wish you happy trading, thanks!

Introducing AI Precision Trader: Unleash the Power of AI for Optimal Trading Performance!
Embark on a revolutionary trading journey with AI Precision Trader, an Expert Advisor (EA) that stands at the forefront of innovation. Meticulously designed with cutting-edge Artificial Intelligence (AI) technologies, this EA redefines precision and profitability in algorithmic trading.
Optimized Risk Management:
Experience a new level of confidence with AI Precision Trader's advanced risk manage

HAshi-E is an enhanced way to analyze Heiken-Ashi signals.
Briefing:
Heiken-Ashi is particularly valued for its ability to filter out short-term volatility, making it a preferred tool for identifying and following trends, helps in decision-making regarding entry and exit points, and assists in distinguishing between false signals and genuine trend reversals. Unlike traditional candlestick charts, Heiken-Ashi candles are calculated using average values of previous bars, creating a smoother,

The Bearish Engulfing candlestick, a potent signal in technical analysis, marks a potential shift in market sentiment. This compelling pattern unfolds when a smaller bullish candle is completely overshadowed by a larger bearish candle. The Bearish Engulfing signifies a transition from bullish to bearish momentum, capturing the attention of traders anticipating a downtrend. Savvy investors leverage this pattern to identify potential selling opportunities, signaling a shift towards bearish market

Profit X invia notifiche sul tuo dispositivo mobile mantenendoti aggiornato sul profitto dei tuoi investimenti anche nei momenti in cui non puoi fisicamente controllare i mercati, ad esempio quando sei alla guida, sul posto di lavoro, in una riunione o con amici, con parenti e non puoi distrarti Può essere disattivata e attivata ed è possibile scegliere la frequenza del aggiornamenti in minuti, ore, giorni, settimanale o mensile La configurazione e personalizzazione è molto semplice, di default

**MT5** Elevate your risk management game with Equity Savior, the go-to Expert Advisor designed to safeguard your equity during prop firm challenges. This powerful yet user-friendly tool lets you choose your preferred trading session, set a maximum lot size, and establish a daily trade limit effortlessly. Key Features: Session Selection: Tailor your trading approach by selecting specific sessions, aligning with your strategy and prop firm challenge requirements. Max Lot Size Control: Take co

Elevate your trading experience with Dynamic Trader EA MT5 , a cutting-edge trading robot designed to optimize your investment strategy. This advanced algorithm harnesses the power of four key indicators: RSI ( Relative Strength Index ), Stochastic Oscillator , MACD ( Moving Average Convergence Divergence ) and ATR ( Average True Range ) to make informed and precise trading decisions. ATR is used to dynamically set stop-loss and take-profit levels based on market volatility. IMPORTANT!
Read

그만큼 Bullish Engulfing 촛대 패턴 두 개의 양초로 구성됩니다. Bullish Engulfing 촛대 패턴을 식별하는 방법은 다음과 같습니다. 첫 번째 캔들은 약세여야 합니다. 두 번째 캔들은 강세여야 합니다 두 번째 캔들의 몸통은 첫 번째 캔들의 몸통을 덮어야 합니다. 이 2양봉 강세 촛대 패턴은 반전 패턴으로, 바닥을 찾는 데 사용됩니다. 이러한 이유로 우리는 하락세로 이동한 후 이 패턴을 보고 황소가 주도권을 잡기 시작했음을 보여주고 싶습니다. Bullish Engulfing 촛대 패턴이 올바른 위치에 나타나면 다음이 표시될 수 있습니다. 하락 추세의 끝과 상승 추세의 시작 하락세 종료, 상승 추세 재개 $38 (1부 남음) 다음 가격 $138
EA Hammer GA는 통화 쌍, 지수, 금속, 상품, 암호화폐 등 모든 종류의 기호에 대해 작동합니다. Guardian Angel EA 채널 : 여기를 클릭하세요 GA EA를 구매하면 원

해머 캔들스틱 패턴은 하나의 캔들로 구성됩니다. 해머 촛대 패턴을 식별하는 방법은 다음과 같습니다. 양초는 몸체가 작습니다. 밑부분의 심지는 몸체에 비해 커야 합니다. 맨 위에는 심지가 없거나 아주 작아야 합니다. 몸의 색깔은 중요하지 않습니다 이 1양봉 강세 촛대 패턴은 반전 패턴으로, 바닥을 찾는 데 사용됩니다. 이러한 이유로 우리는 하락세로 이동한 후 이 패턴을 보고 황소가 주도권을 잡기 시작했음을 보여주고 싶습니다. 망치형 촛대 패턴이 올바른 위치에 나타나면 다음이 표시될 수 있습니다. 하락 추세의 끝과 상승 추세의 시작 하락세 종료, 상승 추세 재개 $38 (1부 남음) 다음 가격 $138
EA Hammer GA는 통화 쌍, 지수, 금속, 상품, 암호화폐 등 모든 종류의 기호에 대해 작동합니다. Guardian Angel EA 채널 : 여기를 클릭하세요 GA EA를 구매하면 원하는 다른 GA 전문가를 보너스로 받을 수 있습니다. *(MQL을 통하지 않고 메일을

The Hanging Man candlestick, a significant player in technical analysis, provides a crucial signal for potential trend reversals in financial markets. Characterized by its small real body, long lower shadow, and minimal upper shadow, the Hanging Man hints at a shift from bullish to bearish momentum. Savvy traders use this pattern to identify potential selling opportunities, suggesting a possible weakening of an uptrend. Dive into the intricacies of the Hanging Man candlestick to refine your mark

TrendOnClose is a sophisticated indicator designed for Binary market investors, focusing on statistical analysis of trends and counter-trends within specific candle cycles. Each cycle is defined by the candle CLOSE price, establishing the trend direction (UP/DOWN - BULL/BEAR) for subsequent statistical analysis until the start of the next cycle. The statistical analysis operates with two configurations: ⦁ Statistical Goal as SUBSEQUENT CANDLE: The algorithm focuses on the subsequent candle withi

The Jurik Advanced MA (JurMA) is a non-repaint technical indicator developed over the original JMA concepted by Mark Jurik.
It is designed to reduce lag present in traditional moving averages, improve smoothness, and reduce noise. JurMA adapts to market volatility and can be fine-tuned by the user for sensitivity, making it useful for identifying trends and reversals in financial markets. This adaptability and efficiency make it popular among traders and analysts.
In the wide context of ot

The Shooting Star candlestick, a key player in technical analysis, serves as a harbinger of potential trend reversals in financial markets. Distinguished by its small real body, long upper shadow, and minimal lower shadow, the Shooting Star suggests a shift from bullish to bearish momentum. Traders keen on market insights often use this pattern to identify potential selling opportunities, highlighting potential weakness after an uptrend. Harness the power of the Shooting Star to refine your cand

Vision è un indicatore professionale che legge i dati storici del periodo impostato e in base a tali elabora una previsione scrivendo l'andamento sul grafico, l'impatto visivo eccellente rende chiaro l'andamento del prossimo trend e mette a fuoco il prezzo d'ingresso il posizionamento di ordini e la distanza per SL e TP, di default è impostato con un rapporto bilanciato 24 a 24 ciò significa che in base alle ultime 24 candele prevederà scrivendo sul grafico l'andamento delle 24 candele successi

해머 캔들스틱 패턴은 하나의 캔들로 구성됩니다. 해머 촛대 패턴을 식별하는 방법은 다음과 같습니다. 양초는 몸체가 작습니다. 밑부분의 심지는 몸체에 비해 커야 합니다. 맨 위에는 심지가 없거나 아주 작아야 합니다. 몸의 색깔은 중요하지 않습니다 이 1양봉 강세 촛대 패턴은 반전 패턴으로, 바닥을 찾는 데 사용됩니다. 이러한 이유로 우리는 하락세로 이동한 후 이 패턴을 보고 황소가 주도권을 잡기 시작했음을 보여주고 싶습니다. 망치형 촛대 패턴이 올바른 위치에 나타나면 다음이 표시될 수 있습니다. 하락 추세의 끝과 상승 추세의 시작 하락세 종료, 상승 추세 재개 $38 (1부 남음) 다음 가격 $138
EA Hammer GA는 통화 쌍, 지수, 금속, 상품, 암호화폐 등 모든 종류의 기호에 대해 작동합니다. Guardian Angel EA 채널 : 여기를 클릭하세요 GA EA를 구매하면 원하는 다른 GA 전문가를 보너스로 받을 수 있습니다. *(MQL을 통하지 않고 메일을
MetaTrader 마켓은 거래 로봇과 기술 지표들의 독특한 스토어입니다.
MQL5.community 사용자 메모를 읽어보셔서 트레이더들에게 제공하는 고유한 서비스(거래 시그널 복사, 프리랜서가 개발한 맞춤형 애플리케이션, 결제 시스템 및 MQL5 클라우드 네트워크를 통한 자동 결제)에 대해 자세히 알아보십시오.
트레이딩 기회를 놓치고 있어요:
- 무료 트레이딩 앱
- 복사용 8,000 이상의 시그널
- 금융 시장 개척을 위한 경제 뉴스
등록
로그인
계정이 없으시면, 가입하십시오
MQL5.com 웹사이트에 로그인을 하기 위해 쿠키를 허용하십시오.
브라우저에서 필요한 설정을 활성화하시지 않으면, 로그인할 수 없습니다.