MetaTrader 5용 새 Expert Advisor 및 지표 - 75

It adds the symbols listed on Binance Spot to the Metatrader5 market clock. With this free file you can list the entire list in seconds. You can easily upload it to your demo account. It is the first file uploaded for Binance Spot Tick and is available for free. Tools menu / Options / Expert Advisors / You need to select Use WebRequest for listed URL You can watch videos to add Metatrader.
FREE

It is a script that allows you to open all market watch symbols at one go having the current time frame of the opened chart. I have been looking for a script like this for a very long time when I first started trading. Finally figured out how to do it, so no more problem for those who are suffering like me. This is a blessing for me now hopefully for you too. Buy the script, if it does not work as shown full refund. DM me for any problems, this script is only for MT5 . instruction Are : 1 - Keep

place a vwap line starting from the line placed on the chart parameters: tick_mode: enable to use ticks instead of bars. this uses a lot more cpu processing power prefix: prefix to add for line created by indicator line_color: set the color of the line created line_style: set the line style of the line created applied_price: set the price of bar to use of the bar std_dev_ratio: set the multiplier for the std dev channel

Do you like to trade on EURUSD and GBPUSD? This expert may be for you. Trading starts with pending orders: buylimit and selllimit. The second order is at the market price - the so-called probing order (reduces risk). Then the EA adjusts subsequent orders according to the market situation. Both the first and subsequent orders are closed based on a trailing stop. The expert selects the volume himself, as well as how many positions will be closed. input start_enum inp_start= 2 ; //S

The indicator plots the Up and Down arrows on every price swing made by the classic Zigzag indicator. When Zigzag makes a new swing low, a green arrow is plotted. Likewise, a red arrow is plotted when Zigzag makes a new swing high.
Features
Compared to the classic ZigZag, it marks the swing points more effectively. It helps to identify the forming chart patterns in advance. It comes with a Multi-Timeframe scanner which shows the Zigzag direction on each timeframe. All Metatrader alerts includ

This indicator shows the bullish/bearish market regime using the no. of bars moved above and below the overbought/oversold region of RSI. The green histogram depicts the Bull power, while the red depicts the Bear power.
Features
It can be used to enter new trades or validates trades from other strategies or indicators. It comes with a multi-timeframe scanner that scans the bulls/bears power across all the time frames. It's a perfect choice to boost the confidence of new traders via validatin
The indicator measures the buying and selling force between the buyers and sellers in the form of a histogram/oscillator by using a BOP equation:
BOP = Moving Average of [close – open)/(high – low)]
Igor Levshin first introduced the Balance of power in the August 2001 issue of Technical Analysis of Stocks & Commodities magazine.
Features
Quickly find the buying and selling pressure among the traders. It comes with simple inputs and an interface. All Metatrader alerts included.
Appli
SSL stands for Semaphore Signal Level channel. It consists of two moving averages applied to high and low, respectively, to form a price following envelope. Buy Signal: When the price closes above the higher moving average. Sell Signal: When the price closes below the lower moving average.
Features It comes with a multi-timeframe scanner that scans for the new signals across all the timeframes. A straightforward personal implementation of the classic SSL effortlessly finds the trend directio

Back to the Future это индикатор который определяет направление тренда. Определяет четыре уровня для роста и падения 1-й уровень флета 2 -й уровень коррекции 3-й уровень продолжения тренда и 4-й уровень возможного разворота. Индикатор рисует трендовые линии краткострочного и долгострочного тренда. Так же индикатор определяет динамические сел и бай зоны в виде прямоугольников. От ближайшего максимума или минимума рисует фибо уровни для определения целей движения. В меню индикатора отключа

It's a modified, and improved version of the classic HMA developed initially by Alan Hull in 2005. It uses a combination of three weighted moving averages to reduce the lag. Long Entry: When HMA turns blue from red with an upward slope. Short Entry: When HMA turns red from blue with a downward slope.
Features It comes with a multi-timeframe scanner which scans for the new signals across all the timeframes. HMA reduces lags which usually come with the traditional moving averages. Effectively
This is a break even/break even plus EA. It moves your stop loss to break even(BE) or BE+ based on pre-set number of pips in profit. You can edit this in the input section. This EA sets breakeven for both manually and auto-opened trades. Moving stop-loss to a breakeven is popular among traders who wish to safeguard their trades and to let the trades run without incurring a risk of loss. With this EA , you can have your stop-loss orders moved to a breakeven point automatically when a po

HEIKEN PLUS is the only indicator you really need to be a successful trader , without in depth knowledge of the forex trading or any tools.
Also there is automatically trading EA available now: https://www.mql5.com/en/market/product/89517? with superb SL/TP management! and sky high profit targets !!!
Very suitable tool for new traders or advanced traders too. This is MT5 version. For MT4 version visit : https://www.mql5.com/en/market/product/85235?source=Site
HEIKEN+ is a combination o

Numa folha qualquer
Eu desenho um sol amarelo
E com cinco ou seis retas
É fácil fazer um castelo
Corro o lápis em torno da mão e me dou uma luva
E se faço chover com dois riscos, tenho um guarda-chuva
Se um pinguinho de tinta
Cai num pedacinho azul do papel
Num instante imagino uma linda gaivota a voar no céu
Vai voando, contornando
A imensa curva norte-sul
Vou com ela viajando
Havai, Pequim ou Istambul
Pinto um barco à vela
Branco navegando
É tanto céu e mar num beijo azul
Entr
FREE
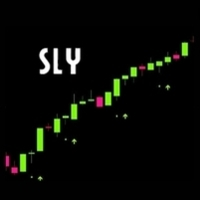
indicador para opciones binarias que siempre funciona en favor de la tendencia principal , por favor identifiquela en temporalidades altas para poder tomar operaciones en las temporalidades bajas , puede usar una media movil de cualquier periodo para identificarla , recomendada la de 50 periodos exponencial ideal para operar el mercado de indices sinteticos del broker deriv y/o divisas, se puede acompañar de cualquier oscilador usando unicamente el nivel 50 para validar tendencia alcista o baji

마스피드는 이동 속도를 나타내는 범용 이동 평균입니다. 선의 점은 평균이 임계값보다 빠르게 이동할 때 나타납니다. 임계 값은 설정에서 지정할 수 있습니다. 이 지표를 기반으로 다양한 거래 전략을 구축 할 수 있습니다. 이 표시기는 이동 평균(10 가지 유형의 스무딩)을 조정할 수있는 큰 기회가 있습니다. 12 가격 옵션을 구축 할 수 있습니다. 결과 이동 샘플링의 가능성을 추가했습니다. 추가 장점은 빠르고 최적화 된 코드,제한없이 전문가를 사용할 수있는 기능,표시기의 상태 및 위치에 대한 유용한 정보가 포함 된 추가 버퍼입니다. 이러한 종류의 지표의 가장 일반적인 사용은 충동 거래 전략입니다. 임펄스 거래는 시장에서 강력하고 활동적인 움직임 중에 거래를 여는 것으로 구성된 거래입니다. 이러한 포지션은 몇 분 동안 또는 전체 거래 세션 동안 개최 될 수 있습니다. 그것은 모두 모멘텀이 얼마나 강한 지,그리고 반전에 대한 전제 조건이 있는지 여부에 달려 있습니다. 일반적으로 모멘텀은 더
FREE

기간: M1 통화 쌍: XAU/USD Gold Booster MT5 는 달러에 대한 금 거래의 혁신적인 개발입니다. 이 전략은 지원/저항 수준을 사용합니다. 각 거래는 손절매로 보호되며 적응형 추적 알고리즘이 있습니다. 이 Expert Advisor는 가장 중요한 지지선과 저항선을 돌파하는 것을 기반으로 하며, 특수 적응 알고리즘의 도움으로 보류 주문을 내린 후 결정합니다. 권장 사항: Expert를 사용하기 전에 설치 및 브로커 권장 사항에 대한 지원을 위해 작성자에게 문의하십시오. 브로커 서버에 대해 네트워크 대기 시간이 최소인 VPS 또는 서버를 사용해야 합니다. 스프레드와 수수료가 가장 낮은 브로커를 사용하십시오. 실제 계정에서 사용하기 전에 필요한 로트와 함께 테스트하십시오. 거래 전략: 알고리즘은 조용한 시장 기간 동안 변동성의 비정상적인 스파이크를 찾습니다. 지원 및 저항 수준에서 반등. 좁은 방향의 채널에서 거래. 추세의 방향으로 거래 시작, 편차

Distance Price Moving Average
This is an indicator that calculates in real time the distance from the price to the moving average.
With it you can monitor the maximum deviation of the price from the moving average in a certain period of time chosen by you, for example, monitor the distance according to the maximum deviation of the last 30 days.
It is possible to choose the period and type of the moving average.
To make it even better, we have added the possibility of two alert levels
FREE

The worktime indicator helps you identify the most important times to day to trade the currency pairs. It was created based on the ICT day trading free tutorials that are freely vailable on his youtube channel. You can use this indicator together with my other indicators that i have shared freely with you like the true day, custom periods, daily month, weekly open lines - they together complement each other very well.
Nuggets from this indicator: 1. Draws the asian session box showinng you th
FREE
The Higher timeframe candle tracker is used to get a glimpse of what the selected higher time frame candle is like. It plot the candle after the current price. It can come in handy for day traders and short term traders that often worry about how the current higher timeframe candle may look like. You can select the higher time frame or lower time frame from the options provided: By default the color for bears is red and for bulls is green. You are able to change the width of the candle, its wick
FREE
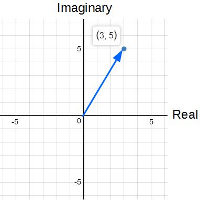
ComplexVector is an indicator based on market analysis using the mathematical apparatus of complex numbers. The essence of the indicator is that it, with clear impulses, indicates the points in time when it is necessary to make decisions. The impulses are like a cardiogram showing the heartbeat of the market.
For example: it may be the moment of planning a new entry. this may be the moment to exit the position. if you work with a series that is in a drawdown, you are recommended to close it i
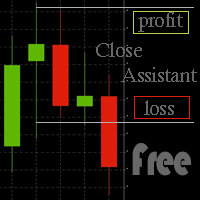
Simple program to automatically close positions by profit or loss.
User can select "Total Profit" to close all positions at the same time, once the total profit or loss is reached.
User can select "Single Profit" to close one by one positions, once single profit or loss is reached. Notes: 1. The assistant will not open any position.
2. The assistant only provide market orders, so due maket volatility positions can suffer slippage.
FREE

Excellent tracking performance and minimal noise! This trend detection indicator that avoids whipsaws and uncertain market noise and is also agile enough to react to changes in trend.
It is also designed to adapt to dynamic markets.
Functions mainly as a filter to help you trade in the direction of the trend.
Features.
Simple and easy to use. Low load and easy to try out The excellent tracking performance and smooth lines that make it ideal for market analysis Can be used as a trend filter
FREE
Hello Everyone ,
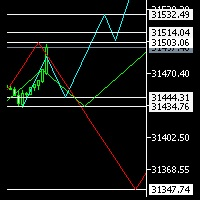
I am not an Elliot pro , but I promise to let you see it in a different way , have you ever considered to see 3 probabilities of different time frames on same chart ? this will not only enhance your trades entry , but will give you confidence and certainty when everything is not clear.
in my indicator you will be able to select 3 time frames of your choice , define number of candles per each time frame , give the color per each trend (Bearish or Bullish), not only that , yo

The Outside The Box (OTB) is a complete trading system that provides the user with immense trading ability by highlighting on the chart areas where the trader should prepare to Re-enter the trend after pullbacks (Pullback trading strategy) Take partial/complete profit(Profit taking strategy), and Trade breakouts (Stock breakout strategy) - We have updated the indicator to show/hide Micro breakout areas around the major breakouts (Micro Breakouts). The above is supported by an alert system to no

DESCRIPCION GENERAL * Bot automático * Bot de uso exclusivo de la plataforma binary.com donde se podemos encontrar los Sintéticos * Mercado de Sintéticos recomendado Range Break 200 * Deposito mínimo para el Bot 1 000 USD CONFIGURACION * No cambiar los valores de las Bandas de Bollinguer * En el parámetro TP_of_SL poner 100 * El stop loss es automático *Temporalidad de vela recomendada 1 minuto Como recomendación si quieres usarlo con menos capital se sugiere que cambies el parámetro de mu
FREE

Supported currency pairs: EURUSD,USDCAD, GBPUSD, EURGBP
Setting Lot -frist trading lot TakeProfit, in pips - t ake profit value Step between positions: Step between positions(Distance) Volume increase factor Max lot Author
I have an experience of more than 8 years in forex and gold trading, I started my career as a trader and now developing Expert Advisors to make trading process and trading fully automated I believe "if you can't make money while you sleep, you have to work fo

you don't have to monitor your trades all the time. save yourself screen time and leave management of your trades to Dynamic Trades Manager. Dynamic Trades Manager is a trading assistant tool. it has automated capabilities to break even, take partial profits, trails stops and to set your risk to reward ratio . it does not take trades on its own but only performs the aforementioned functions when the user has already conducted their analysis and opened a trade. this would save you the time of ha

*OPTIMIZE BEFORE TEST AND USE* Sentient is the next evolution of of scalping and has all the angles covered. I tested it on XAU/USD. Optimize on the time frame assets you choose. I like XAU/USD.
Sentient has more points and indicators to it to create a cluster signal and there are many inputs to optimize. You can use the basic ones for the threshold or all of them.
Note: There are many steps and points. Optimizing longer than 1 month, would require much time and power. Forward opti

Volality 75 Fractal Scalper Non-repaint The arrows appear on the current candle. momentum and trend based strategy Works on all timeframes from the 1 Minute to the Monthly timeframe Bollinger bands have been added to show the trend direction whether its bullish or bearish Blue fractal arrow is your buy entry Orange fractal arrow is your sell entry you can use the Vix 75 fractal scalper in combination with other indicators.

Description: Protect your live or evaluation accounts by not letting it hit the maximum daily draw down! This utility is best for prop firms such as FTMO and MFF(MyForexFunds) and etc. Guide: Apply to EURUSD 1m Chart.
Default Settings: Maximum Draw Down Balance: 4% Account Balance. Maximum Draw Down Equity: 4% Account Balance Target Profit Balance: 1% Account Balance. Target Profit Equity: 1% Account Balance. Time To Reset: 16:57 to 16:58 GMT
Behavior: Setting starting_balance to 0 will au
FREE

Trade with an edge by using the Trader Starter Kit. This powerful assistant was built to help all types of traders. It uses the T.A.E framework to analyze the chart in order to provide a filtered view of the market. T: Trend - Identified by checking for a series of higher highs and higher lows or lower highs and lower lows A: Area of value - Identified through a trading range calculation that obeys the rules of buy low and sell high E: Entry-trigger - Identified by analyzing candlesticks for var
FREE
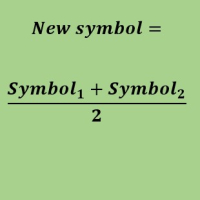
Create a new custom symbol based on average of Multiple arbitrary symbols (for MT5)
An Expert Advisor (EA) used to create custom symbol by averaging multiple input symbols (e.g. EURUSD and GBPUSD) and provide real-time updates. This is an MT4 "offline" chart equivalent which is very simple to use.
You can attach any MT5 compatible indicator or template to this new symbol and perform your technical analysis. You can back-test any EA on this new custom symbol in strategy tester. for example

Trend Panel은 사용자가 선택한 10개 쌍을 사용하여 시간 프레임 M1 - D1의 확인된 추세 방향을 표시하는 간단하고 편리한 도구입니다.
이 표시기는 모든 전략/템플릿에 방향 확인을 추가한 다음 차트를 다른 쌍 또는 기간으로 빠르게 변경하기 위한 깨끗한 대화식 인터페이스로 작동하도록 설계되었습니다. 그룹채팅 : https://www.mql5.com/en/users/conorstephenson
구매 후 설정 조언과 무료 전문가 고문을 위해 저에게 연락하십시오! 내 제품은 MQL5에서만 판매되는 제품입니다 . 다른 곳에서 이 제품을 본다면 모조품입니다. 속지 마세요. 주요 특징들 차트 패널을 정리하면 시간 프레임의 추세 방향을 빠르게 결정할 수 있습니다. 대화형 기능. 차트에 있는 양초의 색상을 변경합니다. 현재 및 과거 추세를 쉽게 볼 수 있습니다. 페어 및 타임프레임 버튼은 클릭 시 작동하여 현재 열려 있는 차트를 변경합니다. 템플릿 설정에 가장 적합한 위치로 차트
FREE

이 표시기는 소위 "악" 숫자를 가중치 계수로 사용합니다. 그들의 반대는 이 지표에도 표시되는 "혐오스러운" 숫자입니다. 숫자를 이 두 클래스로 나누는 것은 특정 숫자의 이진 표기법에서 단위 수에 의해 결정되는 해밍 가중치와 연관됩니다. 이러한 숫자를 가중치 요인으로 사용하면 추세 추종 지표가 생성됩니다. 또한, 혐오스러운 숫자는 더 민감한 지표를 제공하고, 악한 숫자는 보수적인 지표를 제공합니다. 그들 사이의 차이는 그리 크지 않으며 시장의 급격한 가격 움직임에서만 알 수 있습니다. 이 지표를 사용하면 새로운 추세의 시작을 결정하는 데 도움이 될 수 있습니다. 이를 통해 위치를 여는 순간을 보다 정확하게 결정할 수 있습니다. 표시 매개변수: Type numbers - 숫자 유형 선택, Evil 또는 Odious; iPeriod - 표시 기간. 표시기의 감도는 이 매개변수에 따라 다릅니다. 작을수록 가격 변화와 시장 동향의 변화에 대한 민감도가 높아집니다. 표시기 동작의

Golden God은 머신 러닝을 사용합니다. 논리로 OHLC를 거래하는 XAUUSD 1 HR 시간 프레임 또는 기타 시간 프레임에서 거래하십시오. 입력의 균형 위험을 설정합니다(기본값 5%). 가져갈 최대 로트를 제어합니다. 모든 거래에는 스톱이 있고 이익을 얻습니다. 이 EA는 활발하게 거래됩니다. 이것은 지표를 기반으로 하지 않기 때문에 데모에서 거래하고 라이브하십시오. 지표를 사용하는 많은 EA와 달리 실시간으로 시도하십시오. 이 EA는 지표를 사용하지 않습니다
Golden God은 머신 러닝을 사용합니다. 논리로 OHLC를 거래하는 XAUUSD 1 HR 시간 프레임 또는 기타 시간 프레임에서 거래하십시오. 입력의 균형 위험을 설정합니다(기본값 5%). 가져갈 최대 로트를 제어합니다. 모든 거래에는 스톱이 있고 이익을 얻습니다. 이 EA는 활발하게 거래됩니다. 이것은 지표를 기반으로 하지 않기 때문에 데모에서 거래하고 라이브하십시오. 지표를 사용하는 많은 EA와 달리 실시

EA Goldlytic use a trend built-in indicator. It's specifically designed for trading the XAUUSD (GOLD) but can be used with other assets (forex, crypto...).
The Expert Advisor opens an order based on a signal from the indicators and fixes the profit at a certain level with the ability to open order basket For best results, it is recommended to cancel the direction of trade on the EA panel on the chart Since this is a trend-following Expert Advisor, we recommend disabling the Expert Advisor in

Very powerful indicator! converted from TradingView with upgraded alerts and added notifications. Ideal use in EAs.
Use as a supplementary Indicator to confirm your entries, but it is as good on it's own.
The indicator consists of 3 different Trend Meters and a 2 Trend Bars which are used to confirm trend
How to Use:
The more Trend meters are lit up the better =>>
-more GREEN COLOR at one bar means more confirmation to open buy trade,
- more RED COLOR signals for one bar = more

The indicator plots a trend channel using the technique by Gilbert Raff. The channel axis is a first-order regression. The upper and lower lines show the maximum distance the Close line had moved away from the axis line. Therefore, the upper and lower lines can be considered as resistance and support lines, respectively. A similar version of the indicator for the MT4 terminal
As a rule, most movements of the price occur within a channel, going beyond the support or resistance line only for a s
FREE

This indicator is very useful for day traders or short term traders. (MT5 version) No need to calculate the number of pips manually, just look at the chart and you will see the Virtual Take Profit / Virtual Stop Loss target line and evaluate whether the entry point is feasible to reach the intended target or not.
Enter the intended Take Profit / Stop Loss pips for your trade. The indicator will display Virtual Take Profit / Virtual Stop Loss lines for you to easily see if the target i
FREE

The idea of a Value Chart indicator was presented in the very good book I read back in 2020 , " Dynamic Trading Indicators: Winning with Value Charts and Price Action Profile ", from the authors Mark Helweg and David Stendahl. The idea is simple and the result is pure genius: Present candlestick Price analysis in a detrended way!
HOW TO READ THIS INDICATOR
Look for Overbought and Oversold levels. Of course, you will need to test the settings a lot to find the "correct" one for your approach.
FREE

You can see Binance Futures data instantly in Metatrader 5 and it allows you to use all the features that Metatrader has provided to you.
You can access the data of all symbols listed on Binance Futures. Don't forget to set the timezone. Binance it's 00:00 UTC. You need to fix it according to your own country You need to pre-install the free Binance Future Symbol List plugin. https://www.mql5.com/tr/market/product/82891 After loading, it automatically downloads the data of the cryptos in the

Adds the symbols listed in Binance Future to Metatrader5
With this free file, you can list the entire list right away. You can easily install it on your demo account It is the first file to be uploaded for Binance Future Tick and is offered for free.
Tools menu / Options / Expert Advisors / You need to select Use WebRequest for listed
You can watch videos to add metatrader
FREE

1. Торговая стратегия Что делает советник: Советник следит за некотоными индикаторами и при определенном условии (или условиях) помещать торговый запрос (на продажу или покупку) в зависимости от условий. Стратегия:
Используем индикатор Moving Average (скользящие средние) с периодом 8 (вы можете выбрать любой период, но в данной стратегии мы будем использовать период 8). Советник покупает, если 8-периодная скользящая средняя (далее для удобства будем называть ее MA-8) возрастает и текущая цена з
FREE

Think of the Super Fractal Indicator as the Bill WIlliams Indicator on Steroids. Indicator Abilities: 1. Adjust Candle around Fractal High or Low. 2. Adjust Lookback period and only plot for a specific number of history candles avoiding cluttering your trading desk. 3. The Indicator uses buffers so you call and use it from any EA.
Note : The higher the candles around Fractal, the stronger the Turning point anfd viceversa is true.
FREE

The tool is intended to help traders who cannot look at the chart all the time, or who use several charts, the trader can mark regions of interest as supports and resistances and as soon as the price approaches these regions an audible warning and on the screen will be presented for the trader to take some action, in addition the tool can automatically mark the highs and lows of the day and time.
FREE

The ADX indicator (average directional index) is a technical tool designed to measure the strength of a market trend. The ADX indicator is used for various purposes such as measuring the strength of a trend, finding a trend and a trading range, and as a filter for various Forex trading strategies.
Some of the best trading strategies are based on following the market trend. There are also strategies through which traders make profit by trading against the trend. In any case, if you can identif

What is this indicator? This EA is a plugin of MT5's FX verification software " Knots Composito r". You can open, change and close positions just like in a real trade.
The profit and loss of all positions is recorded in account.
How to set up
1. Download all historical data for the target currency pair to calculate the profit of the position in dollars. 2. Open the chart of the target currency pair and scroll to the end in the past direction. 3. If the target currency pair is a cross cur
FREE

What is this indicator? This indicator is a plugin of MT5's FX verification software " Knots Composito r". You can take a screenshot of the entire chart by pressing the hotkey and save it to a specified folder.
Features
- Screenshot the entire chart by pressing the hotkey. - Saves the screenshot image in the sandbox folder specified by the relative path. - Show the time of Common Thread on the screenshot image. - Play the screenshot sound.
How to open the sandbox folder 1. Hold down th
FREE

What is this indicator? This indicator plots a customized text object as a note at any point on the chart. To plot the text object, press the hotkey and then click at any point on the chart. You can also add your favorite words and sentences to the template and plot them.
How to stick a note 1. Press the hotkey to enter sticky mode. 2. Click any point to stick. 3. Edit the text of the text object plotted as a note.
About sticky mode
This mode is for plotting a text object as a note. If
What is this indicator?
This indicator controls the visibility of graphic objects on the chart when the hotkey is pressed. If you switch on, the graphic objects will be hidden. If you switch off, the graphic objects will be shown. You can specify the object to control with object type.
List of supported object types - Vertical Line - Horizontal Line - Trendline - Trendl By Angle - Cycle Lines - Arrowed Line - Equidistant Channel - Standard Deviation Channel - Linear Regression Channel - An

What is this indicator? This indicator stamps any customized number at any point on the chart. To stamp any number, press the hotkey (0–9) and then click at any point on the chart. You can also stamp a series of numbers to indicate a chart pattern. (Each number synchronizes modification)
How to stamp any number
1. Press the hotkey (0–9) to enter stamping mode. 2. Click any point to stamp.
How to stamp a double top/bottom pattern 1. Press the hotkey to enter stamping mode. 2. Click any p

What is this indicator? This indicator draws a customized vertical, horizontal, or trend line at any position on the chart. To draw each line, press the hotkey and then click at any point on the chart. Each drawn line is synchronized with other charts by timeframe. (Each chart requires this indicator to be installed)
How to draw a vertical or horizontal line 1. Press the hotkey to enter drawing mode. 2. Move the mouse to any point. 3. Click to draw the line.
How to draw a trendline 1. Pr

What is this indicator? This indicator draws a customized Fibonacci retracement or expansion at any position on the chart. To draw the object, press the hotkey and then click at any point on the chart. Each anchor point magnets to the high or low price of the nearest bar on the chart.
How to draw
1. Press the hotkey to enter drawing mode. 2. Click any point to draw. 3. Drag and drop each anchor point to adjust if needed.
About drawing mode
This mode is for drawing a Fibonacci retracem

The purpose of the inidcator is to identify the reversal point.
The blue arrow is buy signal and the yellow star is its stop loss. The red arrow is sell signal and the yellow star is its stop loss. Please note that the singal is against trend,it could be continual fail. Alert feature: if there is a signal, the indicator will send alerts of popup window,email or mobile push. Inputs: Popup Window Alert: it is false in default Email Alert : it is false in default Mobile Push Alert: it is false in

The Spots Indicator can be used for Entering and Exiting your trades based on the common candlestick patterns such as: engulfing, hanging man, doji etc. It is designed to publish desktop and mobile notification every time a signal is triggered. However, it is worth noting that this indicator is recommended to be used with other indicator for confirming the entries. It is best to use it with the Investment Castle Trend Lines indicator and the Supply and Demand indicator .
FREE

Indicator alerts for Dual Relative strength index rsi. Large rsi preset at 14 is below 30 small rsi preset at 4 is below 10 for buy bullish signals .
Large rsi preset are 14 is above 70 small rsi preset at 4 is above 90 for sell bearish signals . Includes mobile and terminal alerts. draws lines when alerts.
This indicator can help identify extremes and then the tops or bottoms of those extremes .
FREE
Tool converted from tradingview indicator. Modified version with pivot points calculated in a more intuitive way.
This tool displays relative volatility and directional trend. Excellent way to pickup diversions and reversals. Length can be lowered to 11 or 13 in settings to show price range.
Can be used to identify patterns such as parallel channels and likely direction of price action.
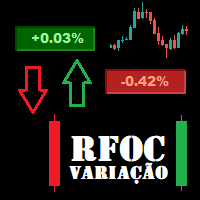
O Produto RFOC Variação Diária apresenta a função de indicar no gráfico a variação, em porcentagem, do preço em relação ao preço de fechamento do dia anterior.
O indicador permite configurar 100% da coloração para variações de alta, baixa e neutra (0.00%).
O painel com a apresentação da variação diária do preço fica fixada na parte superior do gráfico, e se ajusta automaticamente no centro da janela.
FREE

Funciona como bandas de bollinger normais. Criado por Joe Ross, é um setup de maior risco por ser contra-tendência. Pode ser usado para Day Trade, Swing Trade e Position. Para identificar, é necessário inserir no gráfico as Bandas de Bollinger, com uma Média Móvel Simples de 20 períodos e largura (desvio) 2. Verifica-se um fechamento de determinado candle abaixo da banda inferior de Bollinger. Se o próximo candle fechar dentro das Bandas, marca-se a máxima dele. O rompimento dessa máxima será o
FREE

Optimize before back test or use.
New Wave trades trends. 3 moving averages and trends up and trends down, buying and selling. Finding the optimal parameters for yourself, you will need to optimize in the platform. A set file is in the comments to use in the test to show the Expert. Optimize inputs according to your asset and risk. I optimized this with EURUSD on a 1 hour time frame. Percentage of balance is used to trade by.
Este EA foi desenvolvido para o mercado financeiro Brasileiro, porem, com os Parâmetros corretos pode ser aplicado a todos ativos disponíveis na metatrader inclusive forex e metais. Não julgue o resultado com os parâmetros padrão, entenda que os parametros são para validação de diversos ativos, por isso cada ativo tem um valor que se enquadra na realidade do contexto do mercado. Qualquer duvida, pode me chamar no Telegram @andrefonsecaloureiro ou no email vendas.mercadocapital@gmail.com

Supported currency pairs: EURUSD,USDCAD, GBPUSD, EURGBP Recommended timeframe: M15
The EA should run on a VPS continuously Setting Fixed Lot - fixed frist trading lot StopLoss, in pips - stop loss value TakeProfit, in pips - t ake profit value RSI : averaging period, Averaging period for calculation
RSI : type of price RSI :RSI value calculation
Use martingale, martingale Mode Martingale coefficient, martingale multiplier Order Maximum number of multiplications
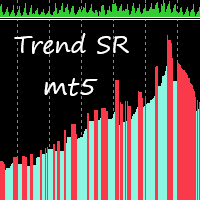
This indicator takes input from Support and Resistance levels, combined with a special trend filter. Easily spot tops and bottoms, and trade with more confidence. Great for scalping. This indicator can be used on all time frames and pairs. Features alert function.
No need to set up the indicator.
How to use: Simply attach to any chart. Zoom chart out completely. Red histogram line color = Selling opportunities. Blue histogram line color = Buying opportunities. See pictures below. To spot high
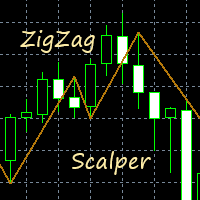
This indicator gives you a modified ZigZag, combined with a trend filter. Great for scalping. Perfect for channel trading. Features alert functions. No need to set up the indicator. How to use: Simply attach to any chart. Buy when the golden line stops below the price. Sell when the golden line stops above the price. It also helps to keep the audible alert set to true. Best results when checking two or more timeframes before entering trades on the lower time frames. Use as you see fit for your

This Expert trades macd crosses , using ADX and AC. Designed for 4hr EURUSD trading but able to trade major pairs. Code is designed for speedy metatrader optimisation using open price testing as ea uses open prices on indicators used. EA identifies trends with specific momentum and exits using the ADX or stop loss. Please optimise using out of sample data. preset at 0.1 lots best to start with 0.01 lots.
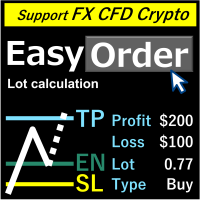
개요 이동 라인만으로도 로트는 손실 컷 금액을 작성하여 자동으로 계산됩니다. 8 개의 통화 다음에 따라 계산할 수 있습니다. (USD, EUR, GBP, JPY, AUD, NZD, CHF, NZD) 고정 금액 또는 균형 비율을 선택할 수 있습니다. 위험 보상을 계산합니다. 시장 주문, 제한 주문 및 정지 주문이 자동으로 적용됩니다. FX, CFD 및 암호화 통화를 지원합니다. 주목
"무료 데모"는 작동하지 않습니다. 다음 페이지에서 데모 버전을 다운로드 할 수 있습니다.
https://www.mql5.com/en/blogs/post/750010 자세한 도구 설명은 위의 링크를 참조하십시오.

이 로봇은 트렌드 웨이브 표시기를 사용하며 새로운 웨이브 트렌드 움직임의 시작과 끝을 식별할 수 있습니다. 오실레이터로서 지표는 과매수 및 과매도 영역을 식별합니다. 단기 가격 반전을 포착하는 데 효과적이며 마틴게일 전략을 사용하여 이익의 모든 거래를 마감합니다. 보다 정확한 거래를 위해 모든 쌍에서 m15 이상의 시간 프레임에서 기본 설정을 사용하십시오! 헤지를 할 수 있는 계정이 필요합니다! 여기에서 찾을 수 있는 내 신호
최고의 사용자 정의 및 선물을 얻으려면 구매 후 저에게 연락하십시오. 매개변수
Max Buys - 로봇이 열 수 있는 최대 구매 주문 수입니다. Max Sells - 로봇이 열 수 있는 최대 판매 주문 수입니다. Comment - 주문에 대한 의견. Lot - 시작 부지. Use dynamic lot - 다이나믹 로트를사용합니다. Martin - 로트 증가 계수 Grid distance - 주문사이의 거리. Max lot - 최
이 거래 전문가의 주요 목적은 후행 정지 기능을 수행하는 것입니다. 포지션을 열거나 닫지 않고 설정 및 이동만 이익을 얻고 손실 수준을 중지합니다. 이익실현 및 손절매를 계산하기 위해 가격 변동 통계와 D. Bernoulli의 도덕적 기대가 사용됩니다. 이로 인해 전문가가 설정한 새로운 수준은 위험/보상 비율 측면에서 가능한 최상의 옵션을 제공합니다. 거래 로봇의 매개변수를 살펴보겠습니다.
Tracked Symbols - EA에서 추적할 통화 쌍입니다. 관심 있는 모든 문자를 쉼표로 구분하여 입력하십시오. 예: EURUSD,GBPUSD,USDCHF. 이 필드를 비워두면 어드바이저는 설치된 심볼에서만 작동합니다. 로봇이 시작되면 터미널의 "전문가" 탭에 모니터링되는 기호가 표시됩니다. Estimated Timeframe - EA가 가격 변동 통계를 수집할 기간을 설정합니다. 적은 수익(스캘핑 등)으로 많은 수의 항목을 사용하는 거래 전략의 경우 작은 기간을 사용해야 합니다

중앙 피벗 범위 수준은 중앙 피벗 지점을 중심으로 형성됩니다.
중앙 피벗과 관련된 이러한 수준은 수많은 시장 동향과 가능한 결과를 결정하는 데 사용할 수 있습니다.
중앙 피벗으로부터의 거리와 이전 날 수준과 관련하여 새로운 수준이 형성하는 가격은 다음 날의 추세 방향과 강도를 결정하는 데 사용할 수 있습니다.
중앙 피벗 범위는 지지와 저항 역할을 할 수 있으며, 손절매를 어디에 두어야 할지 안내하고 가격의 지속적인 움직임/브레이크아웃 신호를 제공할 수도 있습니다.
그룹 채팅: https://www.mql5.com/en/users/conorstephenson 주요 기능
추가 피벗 포인트, 피보나치 및 OHLC 수준이 있는 중앙 피벗 범위 중심 지표. 피벗 포인트(R1, R2, R3, S1, S2, S3)를 그립니다. 피보나치 수준 그리기 - 0, 0.23, 0.38, 0.50, 0.61, 0.78, 1 또는 사용자 지정 피보나치 수준. 알림 기능. - MT4 모바일
FREE

기관 수준/은행 수준... 심리적 수준/분기 이론.
이 지표는 "000, 200, 500, 800" 수준에서 자동으로 그려집니다. 제가 '기관 수준'이라고 알고 있는 수준입니다. 또는 "000, 250, 500, 750" 수준을 차트에 그릴 수도 있습니다.
기관 수준 거래/분기 이론을 어디서 배웠는지에 따라 다른 이름으로 알고 있을 수 있지만, 기본적으로 핵심 아이디어는 이러한 수준이 대부분의 외환 시장에서 강력한 지지 및 저항 지점 역할을 한다는 것입니다.
그룹 채팅: https://www.mql5.com/en/users/conorstephenson 질문이 있거나 구매 후 설정/운영에 대한 조언을 받으려면 저에게 연락하세요. 감사합니다! 주요 기능
현재 가격 위아래로 "000, 200, 500 및 800" 또는 "000, 250, 500 및 750"의 숫자에 지지선 및 저항선 또는 선을 그립니다. 알림 기능. - MT4 모바일 앱을 사용하여 숫자에 도달하면 알림을 받
FREE
MetaTrader 마켓은 거래 로봇과 기술 지표들의 독특한 스토어입니다.
MQL5.community 사용자 메모를 읽어보셔서 트레이더들에게 제공하는 고유한 서비스(거래 시그널 복사, 프리랜서가 개발한 맞춤형 애플리케이션, 결제 시스템 및 MQL5 클라우드 네트워크를 통한 자동 결제)에 대해 자세히 알아보십시오.
트레이딩 기회를 놓치고 있어요:
- 무료 트레이딩 앱
- 복사용 8,000 이상의 시그널
- 금융 시장 개척을 위한 경제 뉴스
등록
로그인
계정이 없으시면, 가입하십시오
MQL5.com 웹사이트에 로그인을 하기 위해 쿠키를 허용하십시오.
브라우저에서 필요한 설정을 활성화하시지 않으면, 로그인할 수 없습니다.