YouTubeにあるマーケットチュートリアルビデオをご覧ください
ロボットや指標を購入する
仮想ホスティングで
EAを実行
EAを実行
ロボットや指標を購入前にテストする
マーケットで収入を得る
販売のためにプロダクトをプレゼンテーションする方法
MetaTrader 5のための新しいエキスパートアドバイザーとインディケータ - 75

It adds the symbols listed on Binance Spot to the Metatrader5 market clock. With this free file you can list the entire list in seconds. You can easily upload it to your demo account. It is the first file uploaded for Binance Spot Tick and is available for free. Tools menu / Options / Expert Advisors / You need to select Use WebRequest for listed URL You can watch videos to add Metatrader.
FREE

It is a script that allows you to open all market watch symbols at one go having the current time frame of the opened chart. I have been looking for a script like this for a very long time when I first started trading. Finally figured out how to do it, so no more problem for those who are suffering like me. This is a blessing for me now hopefully for you too. Buy the script, if it does not work as shown full refund. DM me for any problems, this script is only for MT5 . instruction Are : 1 - Keep

place a vwap line starting from the line placed on the chart parameters: tick_mode: enable to use ticks instead of bars. this uses a lot more cpu processing power prefix: prefix to add for line created by indicator line_color: set the color of the line created line_style: set the line style of the line created applied_price: set the price of bar to use of the bar std_dev_ratio: set the multiplier for the std dev channel

Do you like to trade on EURUSD and GBPUSD? This expert may be for you. Trading starts with pending orders: buylimit and selllimit. The second order is at the market price - the so-called probing order (reduces risk). Then the EA adjusts subsequent orders according to the market situation. Both the first and subsequent orders are closed based on a trailing stop. The expert selects the volume himself, as well as how many positions will be closed. input start_enum inp_start= 2 ; //S

The indicator plots the Up and Down arrows on every price swing made by the classic Zigzag indicator. When Zigzag makes a new swing low, a green arrow is plotted. Likewise, a red arrow is plotted when Zigzag makes a new swing high.
Features
Compared to the classic ZigZag, it marks the swing points more effectively. It helps to identify the forming chart patterns in advance. It comes with a Multi-Timeframe scanner which shows the Zigzag direction on each timeframe. All Metatrader alerts includ

This indicator shows the bullish/bearish market regime using the no. of bars moved above and below the overbought/oversold region of RSI. The green histogram depicts the Bull power, while the red depicts the Bear power.
Features
It can be used to enter new trades or validates trades from other strategies or indicators. It comes with a multi-timeframe scanner that scans the bulls/bears power across all the time frames. It's a perfect choice to boost the confidence of new traders via validatin

The indicator measures the buying and selling force between the buyers and sellers in the form of a histogram/oscillator by using a BOP equation:
BOP = Moving Average of [close – open)/(high – low)]
Igor Levshin first introduced the Balance of power in the August 2001 issue of Technical Analysis of Stocks & Commodities magazine.
Features
Quickly find the buying and selling pressure among the traders. It comes with simple inputs and an interface. All Metatrader alerts included.
Appli
SSL stands for Semaphore Signal Level channel. It consists of two moving averages applied to high and low, respectively, to form a price following envelope. Buy Signal: When the price closes above the higher moving average. Sell Signal: When the price closes below the lower moving average.
Features It comes with a multi-timeframe scanner that scans for the new signals across all the timeframes. A straightforward personal implementation of the classic SSL effortlessly finds the trend directio

Back to the Future это индикатор который определяет направление тренда. Определяет четыре уровня для роста и падения 1-й уровень флета 2 -й уровень коррекции 3-й уровень продолжения тренда и 4-й уровень возможного разворота. Индикатор рисует трендовые линии краткострочного и долгострочного тренда. Так же индикатор определяет динамические сел и бай зоны в виде прямоугольников. От ближайшего максимума или минимума рисует фибо уровни для определения целей движения. В меню индикатора отключа

It's a modified, and improved version of the classic HMA developed initially by Alan Hull in 2005. It uses a combination of three weighted moving averages to reduce the lag. Long Entry: When HMA turns blue from red with an upward slope. Short Entry: When HMA turns red from blue with a downward slope.
Features It comes with a multi-timeframe scanner which scans for the new signals across all the timeframes. HMA reduces lags which usually come with the traditional moving averages. Effectively
This is a break even/break even plus EA. It moves your stop loss to break even(BE) or BE+ based on pre-set number of pips in profit. You can edit this in the input section. This EA sets breakeven for both manually and auto-opened trades. Moving stop-loss to a breakeven is popular among traders who wish to safeguard their trades and to let the trades run without incurring a risk of loss. With this EA , you can have your stop-loss orders moved to a breakeven point automatically when a po

HEIKEN PLUS is the only indicator you really need to be a successful trader , without in depth knowledge of the forex trading or any tools.
Also there is automatically trading EA available now: https://www.mql5.com/en/market/product/89517? with superb SL/TP management! and sky high profit targets !!!
Very suitable tool for new traders or advanced traders too. This is MT5 version. For MT4 version visit : https://www.mql5.com/en/market/product/85235?source=Site
HEIKEN+ is a combination o

Numa folha qualquer
Eu desenho um sol amarelo
E com cinco ou seis retas
É fácil fazer um castelo
Corro o lápis em torno da mão e me dou uma luva
E se faço chover com dois riscos, tenho um guarda-chuva
Se um pinguinho de tinta
Cai num pedacinho azul do papel
Num instante imagino uma linda gaivota a voar no céu
Vai voando, contornando
A imensa curva norte-sul
Vou com ela viajando
Havai, Pequim ou Istambul
Pinto um barco à vela
Branco navegando
É tanto céu e mar num beijo azul
Entr
FREE
indicador para opciones binarias que siempre funciona en favor de la tendencia principal , por favor identifiquela en temporalidades altas para poder tomar operaciones en las temporalidades bajas , puede usar una media movil de cualquier periodo para identificarla , recomendada la de 50 periodos exponencial ideal para operar el mercado de indices sinteticos del broker deriv y/o divisas, se puede acompañar de cualquier oscilador usando unicamente el nivel 50 para validar tendencia alcista o baji

MASpeedは、移動速度を示す普遍的な移動平均です。 ライン上のポイントは、平均がしきい値よりも速く移動すると表示されます。 しきい値は設定で指定できます。 この指標に基づいて、あなたは取引戦略の多種多様を構築することができます。 この指標には、移動平均を調整するための巨大な機会があります-10種類の平滑化。 構築するための12の価格オプション。 結果の移動をサンプリングする可能性を追加しました。 追加の利点は、高速で最適化されたコード、制限なしに専門家を使用する機能、インジケータのステータスと位置に関する有用な情報を含む追加のバッファ この種の指標の最も一般的な使用法は、インパルス取引戦略です。 インパルス取引は、市場での強力で活発な動きの間に取引を開くことで構成される貿易です。 このようなポジションは、数分間、または取引セッション全体で保持することができます。 それはすべて、勢いがどれほど強いか、そして逆転の前提条件があるかどうかに依存します。 一般的に、運動量は古典的な傾向とは異なり、より鋭く安定していません。 実際、そのような動きには大きな引き戻しはなく、市場は単に奈落の底に
FREE

時間枠: M1 通貨ペア: XAU / USD ゴールドブースターMT5 は、ドルに対して金を取引する革新的な開発です。戦略はサポート/レジスタンスレベルを使用します。各取引はストップロスによって保護されており、適応追跡アルゴリズムがあります。このエキスパートアドバイザーは、特別な適応アルゴリズムの助けを借りて、保留中の注文を行った後に決定する最も重要なサポートとレジスタンスのレベルを突破することに基づいています。 推奨事項: Expertを使用する前に、インストールとブローカーの推奨事項について、必ず作成者に問い合わせてください。 ブローカーのサーバーには、必ずVPSまたはネットワーク遅延が最小のサーバーを使用してください。 スプレッドと手数料が最も低いブローカーを使用してください。 実際のアカウントで使用する前に、必要なロットでテストしてください。 取引戦略: アルゴリズムは、穏やかな市場期間中にボラティリティの異常なスパイクを検出します。 サポートおよびレジスタンスレベルからのリバウンド。 狭い方向のチャネルでの取引。 トレンドの方向に取引を開始し、偏差を伴う

Distance Price Moving Average
This is an indicator that calculates in real time the distance from the price to the moving average.
With it you can monitor the maximum deviation of the price from the moving average in a certain period of time chosen by you, for example, monitor the distance according to the maximum deviation of the last 30 days.
It is possible to choose the period and type of the moving average.
To make it even better, we have added the possibility of two alert levels
FREE

The worktime indicator helps you identify the most important times to day to trade the currency pairs. It was created based on the ICT day trading free tutorials that are freely vailable on his youtube channel. You can use this indicator together with my other indicators that i have shared freely with you like the true day, custom periods, daily month, weekly open lines - they together complement each other very well.
Nuggets from this indicator: 1. Draws the asian session box showinng you th
FREE
The Higher timeframe candle tracker is used to get a glimpse of what the selected higher time frame candle is like. It plot the candle after the current price. It can come in handy for day traders and short term traders that often worry about how the current higher timeframe candle may look like. You can select the higher time frame or lower time frame from the options provided: By default the color for bears is red and for bulls is green. You are able to change the width of the candle, its wick
FREE
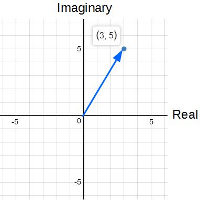
ComplexVector is an indicator based on market analysis using the mathematical apparatus of complex numbers. The essence of the indicator is that it, with clear impulses, indicates the points in time when it is necessary to make decisions. The impulses are like a cardiogram showing the heartbeat of the market.
For example: it may be the moment of planning a new entry. this may be the moment to exit the position. if you work with a series that is in a drawdown, you are recommended to close it i
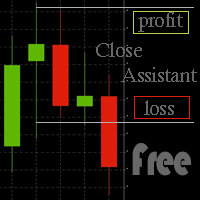
Simple program to automatically close positions by profit or loss.
User can select "Total Profit" to close all positions at the same time, once the total profit or loss is reached.
User can select "Single Profit" to close one by one positions, once single profit or loss is reached. Notes: 1. The assistant will not open any position.
2. The assistant only provide market orders, so due maket volatility positions can suffer slippage.
FREE

抜群の 追従性と最小限のノイズ ! このトレンド検出インジケーターはノイズや波打ちの影響を最小限に抑えた上で、トレンドの変化に対して機敏に反応します。
また、ダイナミックな市場に合わせて適応するよう設計されてます。
主にトレンドの方向にトレードするのに役立つフィルターとして機能します。 特徴 シンプルで使い方も簡単です。低負荷なので気軽に試せます。 抜群の追従性と滑らかなラインで相場分析に最適です。 既存戦略のトレンドフィルターとして使用できます。 2本のラインでゴールデンクロスとデッドクロスを表示できます。
ローソク足が閉じた後は決してリペイントしません。 すべての 通貨ペア& 時間足に対応しています。 EA開発と互換性があります。
こちらのブログからアラート機能が付いたプロフェッショナル版を特別価格 で 入手できます。
本格的に使用する場合はプロフェッショナル版をお勧めします。 : ここをクリック
パラメーター メイン設定
Period - トレンド計算用の期間です。
Factor - リトレースメントの大きさを指定します。 表示設定
Up colo
FREE
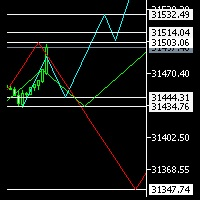
Hello Everyone ,
I am not an Elliot pro , but I promise to let you see it in a different way , have you ever considered to see 3 probabilities of different time frames on same chart ? this will not only enhance your trades entry , but will give you confidence and certainty when everything is not clear.
in my indicator you will be able to select 3 time frames of your choice , define number of candles per each time frame , give the color per each trend (Bearish or Bullish), not only that , yo

The Outside The Box (OTB) is a complete trading system that provides the user with immense trading ability by highlighting on the chart areas where the trader should prepare to Re-enter the trend after pullbacks (Pullback trading strategy) Take partial/complete profit(Profit taking strategy), and Trade breakouts (Stock breakout strategy) - We have updated the indicator to show/hide Micro breakout areas around the major breakouts (Micro Breakouts). The above is supported by an alert system to no

DESCRIPCION GENERAL * Bot automático * Bot de uso exclusivo de la plataforma binary.com donde se podemos encontrar los Sintéticos * Mercado de Sintéticos recomendado Range Break 200 * Deposito mínimo para el Bot 1 000 USD CONFIGURACION * No cambiar los valores de las Bandas de Bollinguer * En el parámetro TP_of_SL poner 100 * El stop loss es automático *Temporalidad de vela recomendada 1 minuto Como recomendación si quieres usarlo con menos capital se sugiere que cambies el parámetro de mu
FREE

Supported currency pairs: EURUSD,USDCAD, GBPUSD, EURGBP
Setting Lot -frist trading lot TakeProfit, in pips - t ake profit value Step between positions: Step between positions(Distance) Volume increase factor Max lot Author
I have an experience of more than 8 years in forex and gold trading, I started my career as a trader and now developing Expert Advisors to make trading process and trading fully automated I believe "if you can't make money while you sleep, you have to work fo

you don't have to monitor your trades all the time. save yourself screen time and leave management of your trades to Dynamic Trades Manager. Dynamic Trades Manager is a trading assistant tool. it has automated capabilities to break even, take partial profits, trails stops and to set your risk to reward ratio . it does not take trades on its own but only performs the aforementioned functions when the user has already conducted their analysis and opened a trade. this would save you the time of ha

*OPTIMIZE BEFORE TEST AND USE* Sentient is the next evolution of of scalping and has all the angles covered. I tested it on XAU/USD. Optimize on the time frame assets you choose. I like XAU/USD.
Sentient has more points and indicators to it to create a cluster signal and there are many inputs to optimize. You can use the basic ones for the threshold or all of them.
Note: There are many steps and points. Optimizing longer than 1 month, would require much time and power. Forward opti

Volality 75 Fractal Scalper Non-repaint The arrows appear on the current candle. momentum and trend based strategy Works on all timeframes from the 1 Minute to the Monthly timeframe Bollinger bands have been added to show the trend direction whether its bullish or bearish Blue fractal arrow is your buy entry Orange fractal arrow is your sell entry you can use the Vix 75 fractal scalper in combination with other indicators.

Description: Protect your live or evaluation accounts by not letting it hit the maximum daily draw down! This utility is best for prop firms such as FTMO and MFF(MyForexFunds) and etc. Guide: Apply to EURUSD 1m Chart.
Default Settings: Maximum Draw Down Balance: 4% Account Balance. Maximum Draw Down Equity: 4% Account Balance Target Profit Balance: 1% Account Balance. Target Profit Equity: 1% Account Balance. Time To Reset: 16:57 to 16:58 GMT
Behavior: Setting starting_balance to 0 will au
FREE

Trade with an edge by using the Trader Starter Kit. This powerful assistant was built to help all types of traders. It uses the T.A.E framework to analyze the chart in order to provide a filtered view of the market. T: Trend - Identified by checking for a series of higher highs and higher lows or lower highs and lower lows A: Area of value - Identified through a trading range calculation that obeys the rules of buy low and sell high E: Entry-trigger - Identified by analyzing candlesticks for var
FREE
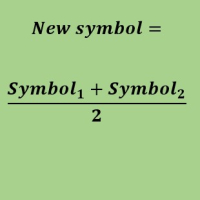
Create a new custom symbol based on average of Multiple arbitrary symbols (for MT5)
An Expert Advisor (EA) used to create custom symbol by averaging multiple input symbols (e.g. EURUSD and GBPUSD) and provide real-time updates. This is an MT4 "offline" chart equivalent which is very simple to use.
You can attach any MT5 compatible indicator or template to this new symbol and perform your technical analysis. You can back-test any EA on this new custom symbol in strategy tester. for example

トレンドパネルは、ユーザーが選択した10ペアを使用して、時間枠M1〜D1の確認されたトレンド方向を表示するシンプルで便利なツールです。 インディケータは、任意の戦略/テンプレートに方向性の確認を追加するように設計されており、チャートを別のペアまたは時間枠にすばやく変更するためのクリーンなインタラクティブインターフェイスとしても機能します。 グループチャット: https://www.mql5.com/en/users/conorstephenson セットアップのアドバイスと無料のエキスパートアドバイザーについては、購入後に私に連絡してください! 私の製品はMQL5でのみ販売されています 。この製品を他の場所で見た場合、それは模倣品です。だまされてはいけません。 主な機能
チャート上のパネルをきれいにして、時間枠の傾向をすばやく判断できるようにします。 インタラクティブ機能。 チャート上のキャンドルの色を変更します-現在と過去のトレンドを簡単に確認できます。 ペアと時間枠のボタンはクリックすると機能し、現在開いているチャートを変更します。 チャートのパネルをクリックして、テンプレート
FREE

この指標は、いわゆる「悪」の数値を重み係数として使用します。それらの反対は「いやらしい」数字であり、これもこのインジケーターに表示されます。これらの2つのクラスへの数値の分割は、特定の数値のバイナリ表記の単位数によって決定されるハミングの重みに関連付けられています。 これらの数値を重み係数として使用すると、トレンド追跡インジケーターが得られます。さらに、いやらしい数字はより敏感な指標を与え、邪悪な数字は保守的な指標を与えます。それらの違いはそれほど大きくはなく、市場での急激な価格変動によってのみ顕著になります。このインジケーターの使用は、新しいトレンドの開始を判断するのに役立ちます。これにより、位置を開く瞬間をより正確に決定することが可能になります。 インジケーターパラメーター: Type numbers -番号タイプの選択、EvilまたはOdious; iPeriod -インジケーター期間。インジケーターの感度は、このパラメーターによって異なります。小さいほど、価格の変化や市場動向の変化に対する感度が高くなります。 インジケーターの動作例を図に示します。

黄金の神は機械学習を使用しています。 XAUUSD 1 HRの時間枠、またはOHLCをロジックとして取引する他の時間枠で取引します。 入力のバランスのリスクを設定します。デフォルトは5%です。 取得する最大ロットを制御します。 すべての取引は停止し、利益を上げます。 このEAは積極的に取引されています。 これは指標に基づいていないため、デモで取引してライブを行います。 リアルタイムで試してみてください。インジケーターを使用する多くのEAとは異なります。 このEAはインジケーターを使用しません
黄金の神は機械学習を使用しています。 XAUUSD 1 HRの時間枠、またはOHLCをロジックとして取引する他の時間枠で取引します。 入力のバランスのリスクを設定します。デフォルトは5%です。 取得する最大ロットを制御します。 すべての取引は停止し、利益を上げます。 このEAは積極的に取引されています。 これは指標に基づいていないため、デモで取引してライブを行います。 リアルタイムで試してみてください。インジケーターを使用する多くのEAとは異なります。 このEAはインジケーターを使用しません

EA Goldlytic use a trend built-in indicator. It's specifically designed for trading the XAUUSD (GOLD) but can be used with other assets (forex, crypto...).
The Expert Advisor opens an order based on a signal from the indicators and fixes the profit at a certain level with the ability to open order basket For best results, it is recommended to cancel the direction of trade on the EA panel on the chart Since this is a trend-following Expert Advisor, we recommend disabling the Expert Advisor in

Very powerful indicator! converted from TradingView with upgraded alerts and added notifications. Ideal use in EAs.
Use as a supplementary Indicator to confirm your entries, but it is as good on it's own.
The indicator consists of 3 different Trend Meters and a 2 Trend Bars which are used to confirm trend
How to Use:
The more Trend meters are lit up the better =>>
-more GREEN COLOR at one bar means more confirmation to open buy trade,
- more RED COLOR signals for one bar = more

The indicator plots a trend channel using the technique by Gilbert Raff. The channel axis is a first-order regression. The upper and lower lines show the maximum distance the Close line had moved away from the axis line. Therefore, the upper and lower lines can be considered as resistance and support lines, respectively. A similar version of the indicator for the MT4 terminal
As a rule, most movements of the price occur within a channel, going beyond the support or resistance line only for a s
FREE

This indicator is very useful for day traders or short term traders. (MT5 version) No need to calculate the number of pips manually, just look at the chart and you will see the Virtual Take Profit / Virtual Stop Loss target line and evaluate whether the entry point is feasible to reach the intended target or not.
Enter the intended Take Profit / Stop Loss pips for your trade. The indicator will display Virtual Take Profit / Virtual Stop Loss lines for you to easily see if the target i
FREE

The idea of a Value Chart indicator was presented in the very good book I read back in 2020 , " Dynamic Trading Indicators: Winning with Value Charts and Price Action Profile ", from the authors Mark Helweg and David Stendahl. The idea is simple and the result is pure genius: Present candlestick Price analysis in a detrended way!
HOW TO READ THIS INDICATOR
Look for Overbought and Oversold levels. Of course, you will need to test the settings a lot to find the "correct" one for your approach.
FREE

You can see Binance Futures data instantly in Metatrader 5 and it allows you to use all the features that Metatrader has provided to you.
You can access the data of all symbols listed on Binance Futures. Don't forget to set the timezone. Binance it's 00:00 UTC. You need to fix it according to your own country You need to pre-install the free Binance Future Symbol List plugin. https://www.mql5.com/tr/market/product/82891 After loading, it automatically downloads the data of the cryptos in the

Adds the symbols listed in Binance Future to Metatrader5
With this free file, you can list the entire list right away. You can easily install it on your demo account It is the first file to be uploaded for Binance Future Tick and is offered for free.
Tools menu / Options / Expert Advisors / You need to select Use WebRequest for listed
You can watch videos to add metatrader
FREE

1. Торговая стратегия Что делает советник: Советник следит за некотоными индикаторами и при определенном условии (или условиях) помещать торговый запрос (на продажу или покупку) в зависимости от условий. Стратегия:
Используем индикатор Moving Average (скользящие средние) с периодом 8 (вы можете выбрать любой период, но в данной стратегии мы будем использовать период 8). Советник покупает, если 8-периодная скользящая средняя (далее для удобства будем называть ее MA-8) возрастает и текущая цена з
FREE

Think of the Super Fractal Indicator as the Bill WIlliams Indicator on Steroids. Indicator Abilities: 1. Adjust Candle around Fractal High or Low. 2. Adjust Lookback period and only plot for a specific number of history candles avoiding cluttering your trading desk. 3. The Indicator uses buffers so you call and use it from any EA.
Note : The higher the candles around Fractal, the stronger the Turning point anfd viceversa is true.
FREE

The tool is intended to help traders who cannot look at the chart all the time, or who use several charts, the trader can mark regions of interest as supports and resistances and as soon as the price approaches these regions an audible warning and on the screen will be presented for the trader to take some action, in addition the tool can automatically mark the highs and lows of the day and time.
FREE

The ADX indicator (average directional index) is a technical tool designed to measure the strength of a market trend. The ADX indicator is used for various purposes such as measuring the strength of a trend, finding a trend and a trading range, and as a filter for various Forex trading strategies.
Some of the best trading strategies are based on following the market trend. There are also strategies through which traders make profit by trading against the trend. In any case, if you can identif

What is this indicator? このEAはMT5のFX検証ソフト「 Knots Compositor 」の MT5で裁量トレードをシミュレーションするための拡張機能 です。 専用の注文パネルをクリックすることで、 実際のトレードのように注文して決済できるようになります 。 専用のアカウントにはレパレッジなどの設定やトレード履歴が保存されていて、レバレッジなどの設定はインプットタブのパラメーターで変更できて、トレード履歴は専用の注文パネルから閲覧できます。
How to set up
1. このEAを Knots Compositor がインストールされた全てのチャートにインストールします。 2. 通貨ペアごとにチャートを過去方向へ最後までスクロールして、その通貨ペアのヒストリカルデータを全てダウンロードします。 3. 通貨ペアがクロス通貨ペアの場合、そのペアの決済通貨と米ドルの通貨ペアのチャートでも同様に操作します 。(損益をドル建てで計算するため) 4. EAプロパティー画面のインプットタブの各パラメーターをカスタマイズします。(各パラメーターは全てのTe
FREE

What is this indicator? このインジケーターはMT5のFX検証ソフト「 Knots Compositor 」の チャートをスクリーンショットするための拡張機能 です。 ホットキーを押すだけで、 チャートをスクリーンショットして指定したフォルダーに保存します 。 スクリーンショットを保存するフォルダーやスクリーンショットの効果音、共通の垂直線のタイムスタンプ、スクリーンショットのホットキーなど、インプットタブのパラメーターで設定を変更できます。
Features
- ホットキーを押すことでチャート全体をスクリーンショットできます。 - スクリーンショットを サンドボックスフォルダーの中の 相対パスで指定したフォルダーに保存できます。 - スクリーンショット上に共通の垂直線の日付を表示させられます。 - スクリーンショットの効果音などを設定できます。
How to open the sandbox folder 1. "Ctrl + Shift + D"を押してデータフォルダーを開きます。 2. MQL5フォルダーを開きます。 3. Filesフォ
FREE

What is this indicator? このMT5のインジケーターはメモとして カスタマイズしたテキストオブジェクトをチャート上のクリックした位置に作成可能 です。 メモを作成するには、ホットキーを押した後にチャート上の任意の位置をクリックして、テキストオブジェクトのテキストを変更します。 定型文のテンプレートを設定して、 ワンクリックでよく使用する単語や文章を作成することも可能 です。
How to stick a note 1. ホットキーの"N"を押してスティッキーモードを起動します。 2. メモがマウスに追従するので、適当な位置までマウスを移動します。 3. クリックしてメモの位置を固定します。 4. メモとしてのテキストオブジェクトのテキストを変更します。
How to stick a template note 1. ホットキーの"Shift+N"を押してスティッキーモードを起動します。 2. メモがマウスに追従するので、適当な位置までマウスを移動します。 3. クリックしてメモの位置を固定します。
About sticky mode
チャー
What is this indicator?
このインジケーターはホットキーが押されることにより、 チャート上のオブジェクトの表示・非表示を切り替えることが可能 です。 スイッチがオンになれば、チャート上のオブジェクトが非表示になります。 スイッチがオフになれば、チャート上のオブジェクトが再表示されます。 オブジェクトタイプを指定して、 非表示にするオブジェクトを限定することも可能 です。
List of supported object types - Vertical Line - Horizontal Line - Trendline - Trendl By Angle - Cycle Lines - Arrowed Line - Equidistant Channel - Standard Deviation Channel - Linear Regression Channel - Andrews’ Pitchfork - Gann Line - Gann Fan - Gann Grid - Fibonacci Retracement - Fibonacci T

What is this indicator? このMT5のインジケーターは 作成する番号と同じキー(0–9)を押した後にチャート上をクリックするだけで任意の番号を作成可能 です。 各番号のスタイル等はインプットタブのパラメーターで設定します。 対応するホットキーを押せば、 エリオット波動などの一連の番号をチャートを連続でクリックしていくだけで作成可能 です。
How to stamp any number
1. 作成する番号と同じキー(0–9)を押してスタンプモードを起動します。 2. 番号がマウスに追従するので、適当な位置までマウスを移動します。 3. クリックして番号の作成を完了します。
How to stamp a double top/bottom pattern 1. ホットキーの"Shift+2"を押してドローイングモードを起動します。 2. 番号がマウスに追従するので、適当な位置までマウスを移動します。 3. クリックして番号の作成を完了します。 4. 2.と3.の操作を繰り返します。(バックスペースキーで1つ前に戻れます) 5. 2番を作成した時点で

What is this indicator? このMT5のインジケーターは ホットキーを押した後にチャートをクリックするだけで垂直線・水平線・トレンドラインを作成可能 です。 各ラインのスタイル等はインプットタブのパラメーターで設定します。 各ラインの 作成・変更・削除はこのインジケーターがインストールされた他のチャートと同期可能 です。(時間軸を指定して同期しないことも可能です)
How to draw a vertical or horizontal line 1. ホットキーの"V"あるいは"H"を押してドローイングモードを起動します。 2. ラインがマウスに追従するので、適当な位置までマウスを移動します。 3.クリックして垂直線の作成を完了します。
How to draw a trendline 1. ホットキーの"T"を押してドローイングモードを起動します。 2. 起点を決定するために、適当な位置をクリックします。 3. 終点がマウスに追従するので、適当な位置までマウスを移動します。 4. 必要に応じて、起点の位置を矢印キーで調整します。 5. クリックして

What is this indicator? このMT5のインジケーターは ホットキーを押した後にチャートをクリックするだけでフィボナッチリトレースメント・エクスパンションを作成可能 です。 フィボナッチリトレースメント・エクスパンションの スタイルはテンプレートとして各3タイプずつ設定可能 です。 フィボナッチリトレースメント・エクスパンションの 各アンカーポイントはチャート上で最も近い高値か安値にマグネット します。
How to draw a Fibonacci retracement
1. ホットキーの"R"を押してドローイングモードを起動します。 2. 起点にしたいバーの高値か安値のあたりをクリックします。 3. 必要に応じて、2点のアンカーポイントをドラッグアンドドロップで調整します。
How to draw a Fibonacci expansion
1. ホットキーの"E"を押してドローイングモードを起動します。 2. 起点にしたいバーの高値か安値のあたりをクリックします。 3. 必要に応じて、3点のアンカーポイントをドラッグアンドドロップで調

The purpose of the inidcator is to identify the reversal point.
The blue arrow is buy signal and the yellow star is its stop loss. The red arrow is sell signal and the yellow star is its stop loss. Please note that the singal is against trend,it could be continual fail. Alert feature: if there is a signal, the indicator will send alerts of popup window,email or mobile push. Inputs: Popup Window Alert: it is false in default Email Alert : it is false in default Mobile Push Alert: it is false in

The Spots Indicator can be used for Entering and Exiting your trades based on the common candlestick patterns such as: engulfing, hanging man, doji etc. It is designed to publish desktop and mobile notification every time a signal is triggered. However, it is worth noting that this indicator is recommended to be used with other indicator for confirming the entries. It is best to use it with the Investment Castle Trend Lines indicator and the Supply and Demand indicator .
FREE

Indicator alerts for Dual Relative strength index rsi. Large rsi preset at 14 is below 30 small rsi preset at 4 is below 10 for buy bullish signals .
Large rsi preset are 14 is above 70 small rsi preset at 4 is above 90 for sell bearish signals . Includes mobile and terminal alerts. draws lines when alerts.
This indicator can help identify extremes and then the tops or bottoms of those extremes .
FREE
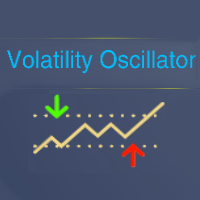
Tool converted from tradingview indicator. Modified version with pivot points calculated in a more intuitive way.
This tool displays relative volatility and directional trend. Excellent way to pickup diversions and reversals. Length can be lowered to 11 or 13 in settings to show price range.
Can be used to identify patterns such as parallel channels and likely direction of price action.
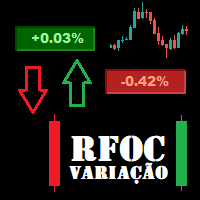
O Produto RFOC Variação Diária apresenta a função de indicar no gráfico a variação, em porcentagem, do preço em relação ao preço de fechamento do dia anterior.
O indicador permite configurar 100% da coloração para variações de alta, baixa e neutra (0.00%).
O painel com a apresentação da variação diária do preço fica fixada na parte superior do gráfico, e se ajusta automaticamente no centro da janela.
FREE

Funciona como bandas de bollinger normais. Criado por Joe Ross, é um setup de maior risco por ser contra-tendência. Pode ser usado para Day Trade, Swing Trade e Position. Para identificar, é necessário inserir no gráfico as Bandas de Bollinger, com uma Média Móvel Simples de 20 períodos e largura (desvio) 2. Verifica-se um fechamento de determinado candle abaixo da banda inferior de Bollinger. Se o próximo candle fechar dentro das Bandas, marca-se a máxima dele. O rompimento dessa máxima será o
FREE

Optimize before back test or use.
New Wave trades trends. 3 moving averages and trends up and trends down, buying and selling. Finding the optimal parameters for yourself, you will need to optimize in the platform. A set file is in the comments to use in the test to show the Expert. Optimize inputs according to your asset and risk. I optimized this with EURUSD on a 1 hour time frame. Percentage of balance is used to trade by.
Este EA foi desenvolvido para o mercado financeiro Brasileiro, porem, com os Parâmetros corretos pode ser aplicado a todos ativos disponíveis na metatrader inclusive forex e metais. Não julgue o resultado com os parâmetros padrão, entenda que os parametros são para validação de diversos ativos, por isso cada ativo tem um valor que se enquadra na realidade do contexto do mercado. Qualquer duvida, pode me chamar no Telegram @andrefonsecaloureiro ou no email vendas.mercadocapital@gmail.com

Supported currency pairs: EURUSD,USDCAD, GBPUSD, EURGBP Recommended timeframe: M15
The EA should run on a VPS continuously Setting Fixed Lot - fixed frist trading lot StopLoss, in pips - stop loss value TakeProfit, in pips - t ake profit value RSI : averaging period, Averaging period for calculation
RSI : type of price RSI :RSI value calculation
Use martingale, martingale Mode Martingale coefficient, martingale multiplier Order Maximum number of multiplications
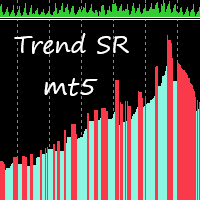
This indicator takes input from Support and Resistance levels, combined with a special trend filter. Easily spot tops and bottoms, and trade with more confidence. Great for scalping. This indicator can be used on all time frames and pairs. Features alert function.
No need to set up the indicator.
How to use: Simply attach to any chart. Zoom chart out completely. Red histogram line color = Selling opportunities. Blue histogram line color = Buying opportunities. See pictures below. To spot high
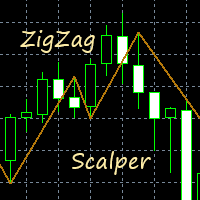
This indicator gives you a modified ZigZag, combined with a trend filter. Great for scalping. Perfect for channel trading. Features alert functions. No need to set up the indicator. How to use: Simply attach to any chart. Buy when the golden line stops below the price. Sell when the golden line stops above the price. It also helps to keep the audible alert set to true. Best results when checking two or more timeframes before entering trades on the lower time frames. Use as you see fit for your

This Expert trades macd crosses , using ADX and AC. Designed for 4hr EURUSD trading but able to trade major pairs. Code is designed for speedy metatrader optimisation using open price testing as ea uses open prices on indicators used. EA identifies trends with specific momentum and exits using the ADX or stop loss. Please optimise using out of sample data. preset at 0.1 lots best to start with 0.01 lots.
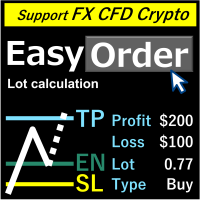
概要
ラインを移動するだけで、ロスカット量を記入することでロットが自動計算されます。 21通貨で損失計算ができます。 ( USD, EUR, GBP, JPY, AUD, NZD, CHF, NZD, RUB, TRY, CNK, THB, SEK, SGD, SEK, DKK, HUF, HKD, CZK, MXN, PLN, KRW) 損失金額は、「固定金額」または「口座残高比率」が選択できます。 成行注文、指値注文、ストップ注文は自動的に適用されます。 FX、CFD、 仮想 通貨のロット計算に対応。 注意
「無料のデモ」は機能しません。説明ページでデモバージョンをダウンロードできます。
https://www.mql5.com/en/blogs/post/750010 詳細なツールの説明は上記リンクをご参照ください。

このエキスパートアドバイザーはトレンドウェーブインジケーターを使用し、新しいウェーブトレンドムーブメントの開始と終了を識別できます。 オシレーターとして、インジケーターは買われ過ぎと売られ過ぎのゾーンを識別します。 短期的な価格の逆転をキャッチするのに最適であり、マーチンゲール戦略を使用してすべての利益の取引を閉じます。 より正確な取引のために、任意のペアでm15以上の時間枠のデフォルト設定を使用してください! ヘッジを許可するアカウントが必要です! ここにある私のmqlチャネルここにあ る私の信号と他の製品 ご購入後、ご連絡ください。 パラメーター
Max Buys - トレーディングアドバイザーが開くことができる買い注文の最大数 Max Sells - トレーディングアドバイザーが開くことができる売り注文の最大数。 Comment -注文に関するコメント Lot-コメントコメント。 Use dinamic lot - 動的ロットを使用します。 Martin - ロットを増やす係数 Grid distance - 注文間の距離 Maxlot-最大ロット。 Stop Lo
このトレーディングエキスパートの主な目的は、トレーリングストップの機能を実行することです。ポジションをオープンまたはクローズするのではなく、セットとムーブだけが利益を取り、損失レベルを停止します。テイクプロフィットとストップロスを計算するために、価格変動の統計とD.ベルヌーイの道徳的期待が使用されます。このため、専門家によって設定された新しいレベルは、リスク/報酬の比率に関して(可能な限り)最良のオプションを提供します。トレーディングロボットのパラメータを見てみましょう。
Tracked Symbols -EAによって追跡される通貨ペア。興味のある文字をすべてコンマで区切って入力してください。例:EURUSD、GBPUSD、USDCHF。このフィールドを空のままにすると、アドバイザーはそれがインストールされているシンボルに対してのみ機能します。起動すると、ロボットは監視対象のシンボルを端末の[エキスパート]タブに表示します。 Estimated Timeframe -EAが価格変動統計を収集する時間枠を設定します。利益の少ない多数のエントリを使用する取引戦略(スキャルピングなど)

中央ピボット レンジ レベルは、中央ピボット ポイントの周囲に形成されます。
中央ピボットに対するこれらのレベルは、さまざまな市場行動や起こり得る結果を判断するために使用できます。
中央ピボットからの距離、および前日のレベルに対する新しいレベルの価格を使用して、翌日のトレンドの方向と強さを判断できます。
中央ピボット レンジはサポートとレジスタンスとして機能し、ストップロスを設定するためのガイドを提供し、価格の継続的な動き/ブレイクアウトのシグナルも提供します。
グループ チャット: https://www.mql5.com/en/users/conorstephenson 主な機能
追加のピボット ポイント、フィボナッチ、OHLC レベルを備えた中央ピボット レンジに重点を置いたインジケーター。 ピボット ポイント (R1、R2、R3、S1、S2、S3) を描画します。 フィボナッチ レベルを描画します - 0、0.23、0.38、0.50、0.61、0.78、1 またはカスタム フィボナッチ レベル。 アラート機能 - MT4 モバイル アプリを使用して、レベ
FREE

機関レベル / 銀行レベル ... 心理レベル / 四半期理論。
このインジケーターは、私が「機関レベル」と呼んでいるレベル「000、200、500、800」を自動的に描画します。または、「000、250、500、750」のレベルをチャート上に描画することもできます。
機関レベル取引 / 四半期理論をどこで学んだかによって、異なる名前で知っているかもしれませんが、基本的に、これらのレベルはほとんどの外国為替市場で強力なサポート ポイントとレジスタンス ポイントとして機能するという考え方です。
グループ チャット: https://www.mql5.com/en/users/conorstephenson ご質問がある場合、または購入後にセットアップ / 操作に関するアドバイスが必要な場合は、私にご連絡ください。ありがとうございます! 主な機能
現在の価格の上下に「000、200、500、800」または「000、250、500、750」の数字でサポートとレジスタンスまたはラインを描画します。 アラート機能。 - MT4モバイルアプリを使用して、数字に達したときに通知できま
FREE
MetaTraderマーケットは自動売買ロボットとテクニカル指標を販売するための最もいい場所です。
魅力的なデザインと説明を備えたMetaTraderプラットフォーム用アプリを開発するだけでいいのです。マーケットでプロダクトをパブリッシュして何百万ものMetaTraderユーザーに提供する方法をご覧ください。
取引の機会を逃しています。
- 無料取引アプリ
- 8千を超えるシグナルをコピー
- 金融ニュースで金融マーケットを探索
新規登録
ログイン