MetaTrader 5용 기술 지표 - 3

ADR 경보 대시보드는 가격이 일반적인 일일 평균 범위와 관련하여 현재 거래되고 있는 위치를 한 눈에 보여줍니다. 가격이 평균 범위를 초과하고 선택한 수준보다 높을 때 팝업, 이메일 또는 푸시를 통해 즉각적인 알림을 받을 수 있으므로 신속하게 철회 및 반전에 뛰어들 수 있습니다. 대시는 빈 차트에 배치되도록 설계되었으며 배경에 앉아서 레벨에 도달하면 경고하므로 앉아서 보거나 전혀 볼 필요가 없습니다!
MT4 버전은 여기에서 사용 가능: https://www.mql5.com/en/market/product/62756
새로운 기능: 이제 평균 WEEKLY 및 MONTHLY 범위와 경고도 표시됩니다!
여기에서 차트의 수준을 나타내는 ADR 반전 표시기를 얻으십시오. https://www.mql5.com/en/market/product/64477
시간의 약 60%는 가격이 정상적인 일일 평균 범위(ADR) 내에서 거래되고 이 수준 이상으로 상승하면 일반적으로 급격한 가격 변

MA3 Trend MT5 - is the good trend indicator on three MAs . Benefits of the indicator: The indicator produces signals with high accuracy.
The confirmed signal of the indicator does not disappear and is not redrawn.
You can trade on the MetaTrader 5 trading platform of any broker.
You can trade any assets (currencies, metals, cryptocurrencies, stocks, indices etc.).
You can trade on any timeframes (M5-M15 scalping and day trading / M30-H1 medium-term trading / H4-D1 long-term trading).
FREE

The Supertrend indicator was originally created by a french fellow named Olivier Seban , and its goal is to identify the Primary Trend of prices . Its calculation is easy and based on the average of Highs and Lows and then we add the volatility of a custom period, plus a multiplier. This way we get the Supertrend Line. You can find in the web several approaches and trading strategies using this very useful indicator.
HOW TO "READ" THIS INDICATOR
If the closing prices are above Supertrend Line
FREE
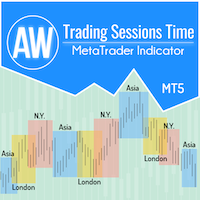
거래자가 시장 성과에 대한 데이터를 쉽게 얻고 거래 전략을 더 잘 수립할 수 있도록 거래 세션 지표를 개발했습니다. 다양한 거래소의 개장 시간은 시장 활동 및 거래량에 영향을 미치므로 거래에 영향을 미칩니다. 이러한 요소는 다양한 상품의 변동성과 거래 기회를 결정합니다. AW 거래 세션 표시기는 아시아, 런던 및 뉴욕 시장의 거래 시간을 표시합니다. 거래자는 더 나은 경험을 위해 다양한 시간대를 표시하거나 숨길 수 있습니다. 차트에서는 세션 종료까지의 시간과 거래 세션 규모를 확인할 수 있습니다. 차트의 데이터 표시에는 다양한 스타일의 거래 차트에 적합한 유연한 그래픽 조정 기능이 있습니다.
더 많은 제품 -> 여기
장점:
아시아, 런던, 뉴욕 거래 세션을 표시합니다. 필요한 경우 세션 크기를 숫자로 표시하고, 켜져 있으면 거래 세션이 끝날 때까지의 시간을 표시합니다. 거래 세션을 개별적으로 비활성화할 수 있습니다. 차트의 사용자 정의 가능한 세션 테두리 스타일 필요한
FREE

금융 지표 SolarTrade Suite: 수은 시장 지표 - 금융 시장 세계에서 신뢰할 수 있는 가이드!
특별하고 혁신적이고 진보된 알고리즘을 사용하여 가치를 계산하고 눈을 즐겁게 하는 디자인을 갖춘 이동 평균입니다.
파란색 - 매수, 빨간색 - 매도 등 이 지표의 수치를 이해하는 것은 매우 간단합니다. 색상이 밝을수록 신호가 강해집니다.
설명 하단에서 다른 SolarTrade Suite 제품을 확인하세요.
투자 및 금융 시장의 세계를 자신있게 탐색하고 싶습니까? SolarTrade Suite Financial Indicator: Mercury Market Indicator는 정보에 입각한 투자 결정을 내리고 수익을 높이는 데 도움을 주기 위해 설계된 혁신적인 소프트웨어입니다.
SolarTrade Suite 재무 지표의 장점: Mercury Market Indicator:
- 정확한 예측: 우리 지표는 고급 알고리즘과 분석 방법을 사용하여 시장 움직임을 정확

The indicator draws the time scale on the chart. You can specify the time offset, adjust the size and font to display on the chart ( it is displaying your local time on your chart instead of MT time ). You can also select the desired format for displaying the date and time. You may be interested in my other product , which contains a more advanced version of the Time Scale .
Parameters Hours (time shift) — time shift (hours); Minutes (time shift) — time shift (minutes); Show time on mouse — sh
FREE

MACD (short for Moving Average Convergence/Divergence) is one of the most famous and oldest indicators ever created and is widely used among beginners . However, there is a newer version of the MACD that is named Impulse MACD which have less false signals than the standard MACD. Classic MACD helps us to identify potential trends by displaying crossovers between two lines. If MACD line crosses above the Signal line it shows us that the market is potentially up trending and that

This indicator can identify more than 60 candlestick patterns on the chart, including their bullish and bearish variants. Just choose the pattern you want in the settings.
Available Patterns 2 Crows Gravestone Doji On Neck 3 Black Crows Hammer Piercing 3 Inside Hanging Man Rick Shawman 3 Line Strike Harami Rising and Falling Three Method 3 Outside Harami Cross Separating Lines 3 Stars in South High Wave Shooting Star 3 White Soldiers Hikkake Short Line Abandoned Baby Hikkake Modified Spinning

지표는 여러 쌍의 스프레드를 동시에 모니터링하는 스프레드 스크리너를 제공하며 캔들 타이머 카운트다운은 현재 막대가 닫히고 새로운 막대가 형성되기까지 남은 시간을 표시합니다.
기간 한정 제공: 당사의 모든 프리미엄 지표는 단 50$에 제공됩니다. MQL5 블로그에 액세스하면 프리미엄 지표에 대한 모든 세부 정보를 찾을 수 있습니다. 여기를 클릭하세요.
주요 특징들 동시에 확산되는 다중 쌍을 모니터링합니다. 현지 시간이 아닌 서버 시간을 추적합니다. 구성 가능한 텍스트 색상 및 글꼴 크기 CPU 사용량을 줄이기 위해 최적화 개인화 된 쌍 목록.
연락하다 질문이 있거나 도움이 필요하면 비공개 메시지를 통해 저에게 연락하십시오.
경고 경고 모든 지표와 도구는 공식 Metatrader Store( MQL5 Market )를 통해서만 사용할 수 있습니다.
작가 SAYADI ACHREF, 핀테크 소프트웨어 엔지니어이자 Finansya의 설립자
FREE

Classic MACD
It has MACD line, Signal line, and Histogram . The Histogram has 4 colors , showing its movement direction as simple as possible. The smoothing factor in the input helps to eliminate noisy signals. Besides different price types (hlc, hlcc, ohlc, ...), there is an option to use volume data as the source for MACD calculations (which is better to be used by real volume not unreliable tick volume). While the original MACD indicator uses Exponential Moving Average, this indicator provid
FREE
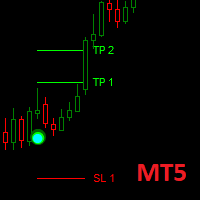
Dark Point is an Indicator for intraday trading. This Indicator is based on Trend Following strategy, also adopting the use of the atr to determine the right volatility. We can enter in good price with this Indicator, in order to follow the strong trend on the current instrument. If you love Dark Point, consider adding some power: Dark Power
Key benefits
Easily visible take profit/stop loss lines Intuitive directional points/arrows by colors Useful statistics , which indicate the
FREE

금융 지표 SolarTrade Suite: 명왕성 시장 지표 - 금융 시장 세계에서 신뢰할 수 있는 가이드!
특별한 혁신적이고 고급 알고리즘을 사용하여 가치를 계산하고 멋진 디자인을 갖춘 변동성 오실레이터입니다.
이 지표의 수치를 이해하는 것은 매우 간단합니다. 녹색 - 낮은 변동성과 무역 거래를 개시하기에 가장 좋은 시간, 주황색 - 높은 변동성과 거래 포지션 마감을 고려할 시간입니다. 색상이 밝을수록 신호가 강해집니다. 귀하의 편의를 위해 이 표시기의 창을 클릭하여 신호를 반전시킬 수 있습니다.
설명 하단에서 다른 SolarTrade Suite 제품을 확인하세요.
투자 및 금융 시장의 세계를 자신있게 탐색하고 싶습니까? SolarTrade Suite Financial Indicator: Pluto Market Indicator는 정보에 입각한 투자 결정을 내리고 수익을 높이는 데 도움이 되도록 설계된 혁신적인 소프트웨어입니다.
SolarTrade Suite 재

지표는 가격과 오실레이터/지표 사이에 다이버전스가 발생하는 시점을 식별합니다. 그것은 규칙적인 발산과 숨겨진 발산을 모두 식별합니다. 가장 강력한 설정만 필터링할 수 있는 RSI 필터 옵션이 있습니다. 지표는 또한 Engulfing 대형, Donchian 채널 돌파 또는 가격이 이동 평균을 넘을 때까지 기다릴 수 있는 옵션을 제공합니다 (스크린샷 #3 참조) 거래 기회를 알리기 전에 다이버전스를 확인합니다. 고유한 규칙 및 기술과 결합하여 이 표시기를 사용하면 자신만의 강력한 시스템을 생성(또는 강화)할 수 있습니다. 특징
의 끝에서 제품의 블로그 지표에서 거래 신호를 검색하기 위해 iCustom() 함수를 사용하는 예제 EA(전문가 고문)의 소스 코드를 다운로드할 수 있습니다. EA가 완벽하게 작동하더라도 주요 목적은 코드를 사용하여 자신이 개발한 EA에 붙여넣는 것입니다. 내 제한된 시간을 감안할 때 하지만 프로그래밍 지원은

이 다중 시간 프레임 및 다중 기호 표시기는 스토캐스틱 신호 라인이 스토캐스틱 메인 라인을 교차하는 시기를 식별합니다. 대안으로 스토캐스틱이 과매수/과매도 영역을 벗어나는 경우(본선을 가로지르는 신호선 없이) 경고할 수도 있습니다. 보너스로 볼린저 밴드와 RSI 과매수/과매도 교차를 스캔할 수도 있습니다. 자신의 규칙 및 기술과 결합하여 이 지표를 사용하면 자신만의 강력한 시스템을 만들거나 향상시킬 수 있습니다. 특징 Market Watch 창에 표시되는 모든 기호를 동시에 모니터링할 수 있습니다. 지표를 하나의 차트에만 적용하고 전체 시장을 즉시 모니터링하십시오. M1에서 MN까지 모든 시간 프레임을 모니터링할 수 있으며 교차가 식별되면 실시간 경고를 보냅니다. 모든 Metatrader 기본 경고 유형이 지원됩니다. 표시기에는 대화형 패널이 포함되어 있습니다. 설명은 별도의 스크린샷을 참조하십시오. 표시기는 신호를 텍스트 파일에 쓸 수 있습니다. 또는 전역 변수

The Market Structures MT5 indicator finds and shows the Break Of Structures (BoS) pattern on the chart. The pattern is an important part of the Smart Money Concepts (SMC) system.
The appearance of a pattern means that the price breaks the last peak of an uptrend, or the last bottom of a downtrend. This indicates a change in the existing trend structure and the beginning of a new movement.
BOS is a technical analysis tool used to identify trend reversals.
The set of input parameters is simple
FREE

For any trader, the result of market analysis is the correct determination of entry and exit points from the market. The ClearArrows indicator does not display any unnecessary information that may distract or mislead the trader, but only the most important thing. The indicator is very easy to use, when a down arrow appears, you need to open a SELL deal, when an up arrow appears you need to open a BUY deal.
The ClearArrows indicator, despite its outward simplicity, has a large analytical algor

Volality Index scalper indicator Meant for Volality pairs such as Volality 10, 25, 50, 75 and 100 The indicator works on all timeframes from the 1 minute to the monthly timeframe the indicator is non repaint the indicator has 3 entry settings 1 color change on zero cross 2 color change on slope change 3 color change on signal line cross Orange line is your sell signal Blue line is your buy signal.

차트에 지지 및 저항 수준과 추진 캔들 갭을 자동으로 그려주므로 다음 가격 방향 및/또는 잠재적 반전 가능성을 확인할 수 있습니다.
이 보조지표는 제 웹사이트(시장 구조 트레이더)에서 가르치는 포지션 트레이딩 방법론의 일부로 사용하도록 설계되었으며 타겟팅 및 잠재적 진입을 위한 주요 정보를 표시합니다. MT4 Version: https://www.mql5.com/en/market/product/97246/ 이 보조지표에는 2가지 핵심 기능과 4가지 추가 기능이 있습니다: 핵심 기능 1 - 일일, 주간 및 월간 시간대의 자동 지지선 및 저항선 이 인디케이터는 지난 2일에서 최대 6주 및 몇 달 전의 가장 최근 지원 및 저항 수준을 자동으로 가져옵니다. 이러한 레벨의 모양을 원하는 대로 완전히 사용자 지정하고 표시되는 레벨 수를 표시할 수 있습니다. 이러한 주요 레벨은 종종 가격이 하락하거나 반전되는 주요 지지 및 저항 구간으로 작용합니다. 또한 가격이 향할 목표가 되기도 하므로

기능
피보나치 리트레이스먼트 트레이딩을 위한 지표 1H, 4H, 1D 및 1W 중에서 선택한 이전 바를 기반으로 피보나치 차트가 그려집니다. 시장 가격이 피보나치 레벨에 닿으면 색상이 변경되고 닿은 시간이 표시됩니다. -23.6, 0, 23.6, 38.2, 50, 61.8, 76.4, 100 및 123.6 레벨에 피보나치 그래프가 그려지며, 바가 업데이트될 때마다 차트가 새로 고침됩니다.
변수
타임프레임: 1H, 4H, 1D 및 1W 중에서 선택한 타임프레임으로 피보나치 차트가 그려집니다. FiboWidth: 레벨의 두께를 결정합니다. FiboStyle: 피봇 레벨의 스타일을 설정합니다. TouchedColor: 닿았을 때 변경되는 색상입니다.
오류가 있거나 개선 사항이 있다면 의견을 남겨주세요. 평가는 개발자에게 큰 도움이 됩니다. 만족하셨다면 5성을 부여해 주시기 바랍니다.
FREE

The indicator identifies when a divergence occurs between price and an indicator or oscillator. It identifies both regular and hidden divergences. Combined with your own rules and techniques, this indicator will allow you to create (or enhance) your own powerful system. Features
Can detect divergences for the following oscillators/indicators: MACD, OsMA, Stochastics, RSI, CCI, RVI, Awesome, ADX, ATR, OBV, Composite index, MFI and Momentum. Only one oscillator/indicator can be selected. Draws
FREE
check out Megaclasic Spikes Robot here: https://www.mql5.com/en/market/product/109140 https://www.mql5.com/en/market/product/109140 MEGASPIKES BOOM AND CRASH v 2.0 NB: source codes of this indicator are available: PM me: https://t.me/Machofx The indicator is developed form a Studied combination of MA - Moving Average SAR - Parabolic Support and Resistance CCI - Commodity Channel Index
MegaSpikes 1.0 Download the 'MegaSpikes Boom and Crash' Technical Indicator for MetaTrader 5 in MetaTr
FREE

This information indicator will be useful for those who always want to be aware of the current situation on the account.
- More useful indicators
The indicator displays data such as profit in points, percentage and currency, as well as the spread for the current pair and the time until the bar closes on the current timeframe. There are several options for placing the information line on the chart: - To the right of the price (runs behind the price); - As a comment (in the upper left corner
FREE

WHY IS OUR FXACCCURATE LS MT5 THE PROFITABLE ? PROTECT YOUR CAPITAL WITH RISK MANAGEMENT
Gives entry, stop and target levels from time to time. It finds Trading opportunities by analyzing what the price is doing during established trends. POWERFUL INDICATOR FOR A RELIABLE STRATEGIES
We have made these indicators with a lot of years of hard work. It is made at a very advanced level.
Established trends provide dozens of trading opportunities, but most trend indicators completely ignore them!

The Price Action Finder Multi indicator is an indicator of entry points that searches for and displays Price Action system patterns on dozens of trading instruments and on all standard time frames: (m1, m5, m15, m30, H1, H4, D1, Wk, Mn). The indicator places the found patterns in a table at the bottom of the screen. By clicking on the pattern names in the table, you can move to the chart where this pattern is located. Manual (Be sure to read before purchasing) | Version for MT4 Advantages
1. Pa

** All Symbols x All Timeframes scan just by pressing scanner button ** *** Contact me after the purchase to send you instructions and add you in "M W Scanner group" for sharing or seeing experiences with other users. Introduction: Double Top(M) and Double Bottom(W) is a very repetitive common type of price reversal patterns. Double Top resembles M pattern and indicates bearish reversal whereas Double Bottom resembles W pattern and indicates a bullish reversal that they have high win r

The order block locator is powered by three main search algorithms thar can be used to find order blocks. Simple Fractal Search Algorithm Naive Fractal Movers Algorithm
Candle Transition Algorithm You can even combine the power of your 2 favourite algorithms and get the best of both worlds: Mixed Algorithm (Naive Fractal + Candle transition) Mixed Algorithm (Simple Fractal + Candle Transition
Simple Fractal Search Algorithm
The algorithm finds the fractals based on your setting paramers fo

This is the latest iteration of my famous indicator, Reversal Fractals, published for the first time almost a decade ago. It examines the price structure of fractals to determine possible reversal points in the market, providing timing to positional traders that already have a fundamental or technical valuation model. [ Installation Guide | Update Guide | Troubleshooting | FAQ | All Products ] Reversal fractals can start long trends The indicator is non repainting
It implements alerts of all k
FREE

Royal Scalping Indicator is an advanced price adaptive indicator designed to generate high-quality trading signals. Built-in multi-timeframe and multi-currency capabilities make it even more powerful to have configurations based on different symbols and timeframes. This indicator is perfect for scalp trades as well as swing trades. Royal Scalping is not just an indicator, but a trading strategy itself. Features Price Adaptive Trend Detector Algorithm Multi-Timeframe and Multi-Currency Trend Low

Insight Pro is a comprehensive tool for market analysis. It offers various features such as trend analysis, resistance and support levels, and distribution analysis, suitable for both novice and experienced traders. Features Trend Analysis Detects and visualizes market trends. Suggests potential entry and exit points based on trends. Customizable trend lines for clear market direction. Displays extreme levels based on standard deviation. Positive slope indicates buy orders; negative slope indic

이 대시보드는 선택한 기호에 대한 거래 전략에 따라 스캘핑 모드와 장기 모드 모두에서 차트의 공급 및 수요 영역을 검색하고 표시합니다. 또한 대시보드의 스캐너 모드를 통해 원하는 모든 기호를 한눈에 확인하고 적합한 위치를 놓치지 않도록 도와줍니다 / MT4 버전 .
무료 보조지표: Basic Supply Demand
특징 여러 통화쌍에 대한 거래 기회를 볼 수 있으며, 공급 및 수요 영역에 대한 근접성에 따라 순위가 매겨진 모든 쌍을 명확하고 간결하게 볼 수 있습니다. 색상부터 감지 매개변수까지 특정 요구에 맞게 사용자 지정 설정 가능
주요 입력 Indicator mode : 표시기 모드 또는 새로운 기능이 포함된 패널 모드 중에서 선택 가능 Symbols : "28개 주요 통화쌍" 또는 "선택한 심볼" 중에서 선택 Selected Symbols : 쉼표로 구분하여 모니터링하려는 원하는 심볼("EURUSD, GBPUSD, XAUUSD")을 선택합

This indicator shows Fractal Breakout Trendlines and Support and Resistance
The Fractal Ascending Trendline and Fractal Descending Trendline are drawn from the last valid fractals. Breakouts can be taken above or below these trendlines. Horizontal lines are drawn from the Last upper and Last lower fractal to show support and resistance levels. Horizontal Upper and Lower Intersection lines are drawn where a fractal trendline has been last intersected, to show where to place a buy or sell orde
FREE

Consolidation Zone Indicator is a powerful tool designed for traders to identify and capitalize on consolidation patterns in the market. This innovative indicator detects consolidation areas and provides timely alerts when the price breaks above or below these zones, enabling traders to make informed trading decisions. MT4 Version : https://www.mql5.com/en/market/product/118734
Key Features:
1. Consolidation Detection : - Precise Identification : The Consolidation Zone Indicator a
FREE

FREE Heiken Ashi Smoothed indicator is fully adjustable, easy to use and comes with possibility to access the indicator via iCustom function so you can use it in your own trading software. Indicator can also pop up alerts when signal changes or send push notifications. For Metatrader 4 version click here: https://www.mql5.com/en/market/product/70824 For detailed information click: >>HERE<< Features
Easy to use Accessible via iCustom Fully adjustable Alerts and Push notifications Possi
FREE

The CAP Channel Trading is a volatility-based indicator that makes use of the “advanced envelope theory”. These envelopes consist of two outer lines. Envelope theory states that the market price will generally fall between the boundaries of the envelope (or channel). If prices move outside the envelope, it is a trading signal or trading opportunity.
Benefits of the Channel Trading Indicator CAP Channel Trading works with any asset
It can be applied to any financial assets: forex, cryptoc
FREE

MT4 버전 | FAQ | EA Universal Breakout Universal Box 는 차트에 가격대를 표시하여 나중에 가격대 돌파 시 거래에 사용할 수 있습니다. 이 지표를 적용할 수 있는 전략은 다양합니다. 이 인디케이터는 기본적으로 차트에 아시아, 유럽 및 미국 거래 세션 범위를 표시하도록 설정되어 있습니다. 범위는 직사각형으로 표시되며, 그 경계는 거래 세션의 시작 및 종료 시간과 해당 기간의 최대 및 최소 가격 수준입니다. Telegram 채팅: @it_trader_chat 새로운 Expert Advisor Prop Master - 트레이딩 터미널에서 테스트해보세요 https://www.mql5.com/ko/market/product/115375
인디케이터 설정은 매우 간단합니다.
Time Open - 거래 세션 시작 시간 Time Close - 거래 세션 종료 시간 Box color - 사각형의 색상 인디케이터에 4개의 가
FREE

Level 2 Book Visualization Indicator Our innovative indicator seamlessly integrates Level 2 order book data onto your trading chart, offering a real-time view of market depth and the dynamics of supply and demand. With its two key features, you can enhance your market analysis and make more informed trading decisions: Biggest Volume Highlight: This input allows traders to instantly identify the price levels with the largest order lots. By highlighting the heaviest concentration of buy or sell or
FREE

FREE

** NOTE: This indicator uses realtime data. Thus DO NOT download Demo version. If you still need demo version, please refer to free version .
Symbol Chart Changer is an indicator/utility that offers you the option to switch between symbols and timeframes.
You can choose any symbol and timeframe on the same chart with just a few clicks. In addition, this indicator also shows the profit of the symbol through the color of the buttons.
Features: Click buttons on the chart to monitor all your

MetaCOT 2 is a set of indicators and specialized utilities for the analysis of the U.S. Commodity Futures Trading Commission reports. Thanks to the reports issued by the Commission, it is possible to analyze the size and direction of the positions of the major market participants, which brings the long-term price prediction accuracy to a new higher-quality level, inaccessible to most traders. These indicators, related to the fundamental analysis, can also be used as an effective long-term filter

Setup Tabajara는 "월스트리트의 OGRO"로 알려진 브라질 상인이 만들었습니다.
이 설정의 아이디어는 거래자에게 현재 가격 추세와 그래프에서 찾아야 하는 작업 유형을 나타내는 것입니다.
작업 이것은 오전 10시 40분까지 양초와 VWAP를 닫는 위치를 지정하고 그 이후에 4가지 색상으로 양초를 칠하는 20주기의 산술 평균으로 수행합니다. 녹색 -> 가격 상승 추세 (구매 진입점 검색) 검은색 -> 강세 추세에서 가격 수정(구매 진입점 검색) 빨간색 -> 하락 추세에 있는 가격 (매도 진입점 검색) 흰색 -> 하락세 시 가격 조정 (판매 진입점 검색) 또한 스크립트에 다음 표시기를 넣었습니다. 8 기간의 지수 평균: 단기 가격 움직임 식별 50개 기간의 산술 평균: 중기 가격 움직임 식별 80 기간의 지수 평균: 중기 가격 움직임 식별 200개 기간의 산술 평균: 장기 가격 움직임 식별
여전히 질문이 있는 경우 다이렉트 메시지로 저에게 연락하십시오: https:
FREE

This indicator obeys the popular maxim that: "THE TREND IS YOUR FRIEND" It paints a GREEN line for BUY and also paints a RED line for SELL. (you can change the colors). It gives alarms and alerts of all kinds. IT DOES NOT REPAINT and can be used for all currency pairs and timeframes. Yes, as easy and simple as that. Even a newbie can use it to make great and reliable trades. NB: For best results, get my other premium indicators for more powerful and reliable signals. Get them here: https://www.m
FREE

차트에 수동으로 피보나치 레벨을 그리는 데 지쳤습니까? 거래에서 주요 지지선과 저항선을 식별할 수 있는 편리하고 효율적인 방법을 찾고 계십니까? 더 이상 보지 마세요! 자동 피보나치 수준 을 수행하는 최고의 MetaTrader 5 지표인 DrawFib Pro를 소개합니다. 차트에 그림을 그리고 이러한 수준이 위반되면 적시에 경고를 제공합니다. DrawFib Pro를 사용하면 거래 전략을 강화하고 시간을 절약하며 정보에 입각한 결정을 내릴 수 있습니다. 내 피보나치 기반 지표 : Advanced Gartley Pattern MT5 || Price Wave Pattern MT5 주요 특징들:
자동화된 피보나치 그리기. 사용자 지정 가능한 매개변수. 정확 하고 신뢰할 수 있음. 실시간 알림. 사용자 친화적인 인터페이스. DrawFib Pro는 효율적이고 신뢰할 수 있으며 사용자 친화적인 방식으로 차트에 피보나치를 자동으로 그
FREE

This is MT5 version, MT4 on this link: Alert Line Pro MT4 Alert line pro allows to make alert when price cross these objects: Horizontal lines Trendline Price Zone (Rectangle) Alert when close current bar (have new bar) When the price crosses the alert lines, the software will sound an alarm and send a notification to the MetaTrader 5 mobile application. You need to settings your MetaQuotes ID of MT5 apps to MetaTrader5 software to get notification to the mobile phone. Sound files must be pl

이 프로젝트를 좋아한다면 5 스타 리뷰를 남겨주세요. 인스 타 그램: borelatech 이 지표는 열리고, 높은, 낮은 및 마감 가격을 지정합니다.
기간과 그것은 특정한 시간대를 위해 조정될 수 있습니다. 이들은 많은 기관 및 전문가에 의해 보는 중요한 수준입니다
상인은 당신이 더 많은 것일 수있는 장소를 알고 도움이 될 수 있습니다
이름 * 사용 가능한 기간: 이전 날. 이전 주. 지난 달. 이전 분기. 이전 연도. 또는: 현재 날. 현재 주. 현재 달. 현재 분기. 현재 년.
FREE

Introduction to X3 Chart Pattern Scanner X3 Cherart Pattern Scanner is the non-repainting and non-lagging indicator detecting X3 chart patterns including Harmonic pattern, Elliott Wave pattern, X3 patterns, and Japanese Candlestick patterns. Historical patterns match with signal patterns. Hence, you can readily develop the solid trading strategy in your chart. More importantly, this superb pattern scanner can detect the optimal pattern of its kind. In addition, you can switch on and off individu

MT5용 Koala FVG를 소개합니다 - 귀하의 프로페셔널한 Fair Value Gap (FVG) 패턴 인디케이터입니다. Koala FVG: MT5에서 정밀 트레이딩을 위한 당신의 길 Koala FVG를 사용하여 Fair Value Gap (FVG) 패턴의 힘을 발견하세요. 이것은 MetaTrader 5용으로 설계된 최첨단 인디케이터입니다. 한정된 시간 동안 이 프로페셔널한 도구에 무료로 액세스할 수 있습니다. 이 도구가 프리미엄 인디케이터로 전환되기 전에 무료로 이용해보세요. 주요 특징: FVG 패턴 감지: Koala FVG는 최소 및 최대 크기를 사용자 정의할 수 있는 기준에 따라 자동으로 FVG 패턴을 식별합니다. 시각적 표현: FVG 영역을 나타내는 동적 사각형을 포함한 그래픽 표시로 명확성을 경험해보세요. 세 개의 선이 정밀한 분석을 위해 FVG 레벨을 강조합니다. 화살표 입장 신호: 거래 기회를 놓치지 마세요. Koala FVG는 입장 지점을 나타내는 명확한 화살표
FREE

Blahtech Fisher Transform indicator is an oscillator that displays overbought and oversold locations on the chart. The Fisher Transform algorithm transforms prices with any distribution shape into a normal distribution. The end result is a curve with sharp turning points that may help to identify bullish or bearish trends. Fisher Transform values exceeding 1.66 on the daily chart are considered to be good areas for reversal trades. Links [ Install | Update | Training | All Products ]

A top-quality implementation of the famous Super Trend indicator, which needs no introduction. It is completely loyal to the original algorithm, and implements many other useful features such as a multi-timeframe dashboard. [ Installation Guide | Update Guide | Troubleshooting | FAQ | All Products ] Easy to trade It implements alerts of all kinds It implements a multi-timeframe dashboard It is non-repainting and non-backpainting Input Parameters
ATR Period - This is the average true range per
FREE

Was: $69 Now: $34 Blahtech VWAP - Volume Weighted Average Price (VWAP) is the ratio of price to total volume. It provides an average price over a specified time interval. Links [ Install | Update | Documentation ] Feature Highlights
Configurable VWAP Line Sessions, intervals, anchored or continuous Previous day settlement line Standard Deviation bands Alerts at bar close or real time Automatic Broker or Tick volumes Significantly reduced CPU usage
Input Parameters
Expert Advisor

BeST_Keltner Channels Strategies MT5 is an MT5 Indicator based on the original Keltner Channels Indicator and it can display in the Chart all the known Variations of Keltner Channels and also the corresponding 10 totally Strategies. Every such generally consists of a Central Moving Average Line and two Boundary Bands at a distance above and below it and can be traded mainly in a Trending Mode but also in a Ranging ReEntry Mode.
BeST_Keltner Channels Strategies Indicator Draws definite Bu

BUY INDICATOR AND GET A PIVOT POINT EA FOR FREE AS A BONUS + SOME OTHER GIFTS! Attention, the MT5 version of this application does not work on strategy tester, only on live accounts or demo accounts on live market. If you need an MT5 demo version of the Indicator send me a private message here: https://www.mql5.com/en/users/italobr ITALO PIVOTS INDICATOR is the best pivot point indicator for strong price reversals and continuations of price movements ever created, and why is that? You

This indicator plots the volume profile by Price on the chart
There are 5 ways to view it:
By Total Volume Traded; Volume Ticks(Forex) Separated by Buyers and Sellers; Buyers Only; Sellers Only and; Business balance (Buyers - Sellers).
It is possible to select how many days the profiles will be calculated.
On the current day it recalculates the histogram data for each new candlestick.
Another feature is to select the highest trading range by entering the desired percentage.
Th
FREE

혁신적인 기본 캔들 패턴 대시보드는 차트에서 수익성 있는 캔들 패턴을 자동으로 식별하도록 특별히 설계되었습니다. 이 대시보드는 고급 알고리즘을 사용해 실시간으로 가격 차트를 스캔하고 클래식부터 복잡한 패턴까지 다양한 캔들 패턴을 감지합니다. 또한 감지된 패턴을 다양한 시간대에 시각화할 수 있는 사용하기 쉬운 인터페이스가 있어 정보에 입각한 결정을 쉽게 내릴 수 있습니다 / MT4 버전
무료 보조지표: Basic Candlestick Patterns
하모닉 패턴 포함 상승 패턴 Hammer Inverse hammer Bullish engulfing Morning star 3 White soldiers 약세 패턴 Hanging man Shooting star Bearish engulfing Evening star 3 Black crows
표시기 열 Symbol: 선택한 기호가 표시됩니다. Pattern: 패턴 유형(해머, 역해머, 강세잉태형..

## WAPV Full을 사용하여 전문적으로 작동하고 추적할 수 있습니다. 큰 선수 돈은 어디에 있습니까 당신의 손에 혼자 읽기를 수행하는 도구가 있다고 상상해보십시오. 최고의 거래 지역을 보여주는 주요 마켓 플레이어의 가격 및 볼륨 분석을 기반으로 합니다. WAPV Full은 R. Wyckoff의 운영에 100% 초점을 맞춘 완전한 도구입니다. 거래 파동에서 시장 움직임을 매핑하는 것 외에도 매핑합니다. 가격과 거래량을 읽어 시장. 프로페셔널 마켓은 R. Wyckoff의 3가지 법칙에 따라 운영됩니다. # 원인과 결과 # 수요와 공급 # 노력 x 결과 이 모든 것이 WAPV Full로 제공되며 16가지 기본 도구를 제공합니다. 시장을 전문적으로 분석하고 결과적으로 결과를 개선하십시오. 내가 말하는 내용을 이해하려면 이미지와 비디오를 참조하십시오. ## WAPV Fulleul sayonghayeo jeonmunjeog-eulo jagdonghago chujeoghal su isss

check out Megaclasic Spikes Robot here: https://www.mql5.com/en/market/product/109140 https://www.mql5.com/en/market/product/109140
MEGASPIKES BOOM AND CRASH v1.32 NB: source codes of this indicator are available: PM me: https://t.me/Machofx PLEASE JOIN THE CHANNEL BELOW TO HAVE ACCESS TO ALL PREVIOUS VERSIONS check out Spikes robot
BoomCrash Cheatcode EA : https://www.mql5.com/en/market/product/103365 https://t.me/machofxprotradin g Note: PLEASE THE NEW VERSION 1.32 OF THE SPIKES
FREE

Scalping Entry Points - is a manual trading system that can adjust to price movements and give signals to open trades without redrawing. The indicator determines the direction of the trend by the central level of support and resistance. The dot indicator provides signals for entries and exits. Suitable for manual intraday trading, scalping and binary options. Works on all time frames and trading instruments.
The indicator gives several types of alerts.
How to use the product
The blue line

이 VWAP은 간단한 VWAP이지만 VWAP이 단순 VWAP에 닿거나 가격이 VWAP을 횡단할 때 알림을 설정했습니다. 이 지표는 MetaTrader 5 (MT5)용 전통적인 VWAP 지표입니다. 기본 매개 변수는 일반 VWAP의 매개 변수이지만 새로운 계산과 최고의 기능을 사용할 수 있습니다: 가격이 VWAP에 닿거나 횡단할 때 알림, 휴대전화 알림, 이메일 또는 소리 이벤트를 통해 알 수 있습니다. MetaTrader 5용 무료 VWAP 앵커 지표 . 매개 변수: VWAP 주기 VWAP은 시간 주기를 기반으로 계산됩니다. 일반 VWAP은 매일 새로운 계산으로 시작됩니다. 그러나이 매개 변수를 사용하여 선호하는 VWAP 주기를 선택할 수 있습니다. 즉, M1 시간 프레임에 있을 수 있고 H1의 새로운 막대로마다 갱신되는 H1의 VWAP 계산을 볼 수 있습니다. 계산은 선택한 프레임 타임 주기마다 항상 다시 시작됩니다. 그러나 지금은 걱정하지 않아도됩니다. 기본 매개 변수는 표준 V
FREE

Introducing the Order Block Indicator , the pinnacle of trading technology. Order blocks, the large cluster of buy or sell orders placed by institutional traders, significantly influence market direction. They form at critical price levels and can act as robust support and resistance zones. Our cutting-edge indicator allows you to harness the full potential of these influential market dynamics, providing a never-before-seen level of precision and customization. Here's why this tool stands apart:

Fair Value Gap (FVG) Indicator: Master the ICT Method in Forex Trading
What Traders Are Saying: " Transformed my trading approach with its precise gap spotting ..." – J. Doe " The alert feature is a lifesaver, never miss a trading opportunity.. ." – Alex P. " A crucial tool for anyone following the ICT methodologies in Forex. .." – Samantha R. Unlock the secrets of price movement in the Forex market with the revolutionary Fair Value Gap (FVG) Indicator. Designed for precision and ease of use,

피봇 포인트 Fibo RSJ는 피보나치 비율을 사용하여 당일의 지지선과 저항선을 추적하는 지표입니다.
이 멋진 지표는 피보나치 비율을 사용하여 피벗 포인트를 통해 최대 7단계의 지지와 저항을 생성합니다. 가격이 작업의 가능한 진입/종료 지점을 인식할 수 있는 이 지원 및 저항의 각 수준을 어떻게 존중하는지 환상적입니다.
특징 최대 7단계 지원 및 7단계 저항 레벨의 색상을 개별적으로 설정
입력 피벗 유형 피벗 피보 RSJ1 = 피보 비율 1 계산 피벗 피보 RSJ2 = 피보 비율 2 계산 피벗 Fibo RSJ3 = Fibo 비율 3 계산 피벗 피보 클래식 = 클래식 피벗 계산 최소 피벗 수준 피벗 3 레벨 피벗 4 레벨 피벗 5 레벨 6단계 피벗 피벗 7 레벨
여전히 질문이 있는 경우 다이렉트 메시지로 저에게 연락하십시오: https://www.mql5.com/ko/users/robsjunqueira/
FREE

This is a simple order block locator. Searched for the existence of order blocks only at extremums. If you want multi criteria order block location check my other indicator which is more powerful here These order blocks are ICT order blocks without any buttering.
The indicator can be a useful tool for detecting reversals, continuations. You can also use the indicator as confluence with your other tools
FREE

An ICT fair value gap is a trading concept that identifies market imbalances based on a three-candle sequence. The middle candle has a large body while the adjacent candles have upper and lower wicks that do not overlap with the middle candle. This formation suggests that there is an imbalance where buying and selling powers are not equal. Settings Minimum size of FVG (pips) -> FVGs less than the indicated pips will be not be drawn Show touched FVGs Normal FVG color -> color of FVG that hasn't
FREE

인기 있는 "슈퍼트렌드" 지표는 테크니컬 분석 도구로, 금융 시장에서의 트렌드 방향과 가능한 진입 또는 청산 지점을 식별하는 데 도움을 줍니다. 이 지표는 평균 실 범위 (ATR)를 기반으로 하며, 이는 가격 범위를 기반으로 시장 변동성을 측정합니다. 다른 플랫폼에서는 무료로 제공되며, 여기서도 마찬가지입니다! 일반적으로 세 가지 방법으로 사용됩니다: 현재 트렌드 식별: 가격이 이 라인 위에 있는 경우 상승 트렌드로 간주되며, 가격이 이 라인 아래에 있는 경우 하락 트렌드로 간주됩니다. 손실 제한 수준으로 사용됩니다. 동적 지지/저항으로: 상승 트렌드에서 이 라인은 가격 아래에 위치하며 동적 지지 수준으로 작용합니다. 하락 트렌드에서는 이 라인이 가격 위에 위치하며 동적 저항 수준으로 작용합니다.
FREE

The balance of supply and demand is a simple and effective market analysis method. The supply and demand diagram can show you in advance, even before the trend reversal, where the supply ends and the demand is already emerging, where the demand ends and the supply is emerging, while substantially increasing the probability of making a deal in the right direction and with a high profit factor.
Indicator signals The indicator uses the price/volume values to generate signals: ED – excess demand.

이제 메타트레이더에서 사용 가능 범위 및 다음 가능한 움직임 식별 | 추세의 초기 신호와 강도를 확인하세요 | 반전 전 명확한 출구 확보 | 가격이 테스트 할 피보 레벨 파악 비추적, 비지연 지표 - 수동 및 자동 거래에 이상적 - 모든 자산 및 모든 시간 단위에 적합 - 출시 시 50% 할인 - 이후 >> $149로 복귀 구매 후 이 채널로 문의 하여 권장 설정을 확인하세요. MT4 버전: 여기를 클릭하세요 BladeSCALPER 및 PowerZONES 로 전체 방법을 확인하세요.
어떤 서비스인가요?
트렌드디코더는 추세 모니터링을 간단하고 쉽게 하기 위한 여러 혁신 기술의 집약체입니다.
투영 추세선(투영 추세선) - 다가오는 추세의 속도 기준 실시간 추세선과 투영 추세선 비교 - 시장이 이전과 같은 방향으로 움직이고 있는지, 아니면 둔화되고 있는지? 실시간 추세선 교차 - 추세가 궤

A personal implementation of the famous Bollinger bands indicator as a trend following mechanism, which uses a moving average and the standard deviation to define what a trend is and when it changes. Bollinger bands are usually used as an oversold/overbought indicator only, but in my opinion, the trading approach is more complete using the trend variant as an exit strategy. [ Installation Guide | Update Guide | Troubleshooting | FAQ | All Products ] Easy to trade Customizable colors and sizes I
FREE
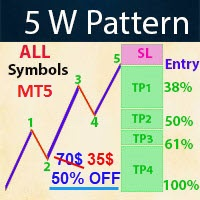
- Real price is 70$ - 50% Discount ( It is 35$ now )
Contact me for instruction, any questions! Introduction The Elliott Wave in technical analysis describes price movements in the financial market that are related to changes in trader sentiment and psychology. The 5 W Pattern (Known as 3 Drives) is an Elliott Wave pattern that is formed by 5 consecutive symmetrical moves up or down. In its bullish form, the market is making 5 drives to a bottom before an uptrend forms. In a bearish 5-d

MetaCOT 2 is a set of indicators and specialized utilities for the analysis of the U.S. Commodity Futures Trading Commission reports. Thanks to the reports issued by the Commission, it is possible to analyze the size and direction of the positions of the major market participants, which brings the long-term price prediction accuracy to a new higher-quality level, inaccessible to most traders. These indicators, related to the fundamental analysis, can also be used as an effective long-term filter

BUY INDICATOR AND GET EA FOR FREE AS A BONUS + SOME OTHER GIFTS! ITALO TREND INDICATOR is the best trend indicator on the market, the Indicator works on all time-frames and assets, indicator built after 7 years of experience on forex and many other markets. You know many trend indicators around the internet are not complete, does not help, and it's difficult to trade, but the Italo Trend Indicator is different , the Italo Trend Indicator shows the signal to buy or sell, to confirm the signal t

Volume Weighted Average Price (VWAP) The volume weighted average price (VWAP) is a trading benchmark used by traders that gives the average price a security has traded at throughout the day, based on both volume and price. It is important because it provides traders with insight into both the trend and value of a security. This indicator VWAP V2 is free and is the manual version of the extended Easy VWAP indicator (30 Euro), where the date and time properties are automatically entered. With
FREE
MetaTrader 마켓은 거래로봇과 기술지표를 판매하기에 최적의 장소입니다.
오직 어플리케이션만 개발하면 됩니다. 수백만 명의 MetaTrader 사용자에게 제품을 제공하기 위해 마켓에 제품을 게시하는 방법에 대해 설명해 드리겠습니다.
트레이딩 기회를 놓치고 있어요:
- 무료 트레이딩 앱
- 복사용 8,000 이상의 시그널
- 금융 시장 개척을 위한 경제 뉴스
등록
로그인
계정이 없으시면, 가입하십시오
MQL5.com 웹사이트에 로그인을 하기 위해 쿠키를 허용하십시오.
브라우저에서 필요한 설정을 활성화하시지 않으면, 로그인할 수 없습니다.