Indicadores técnicos para MetaTrader 5 - 3

Próxima generación de zonas de oferta y demanda automatizadas. Algoritmo nuevo e innovador que funciona en cualquier gráfico. Todas las zonas se crean dinámicamente de acuerdo con la acción del precio del mercado.
DOS TIPOS DE ALERTAS --> 1)CUANDO EL PRECIO LLEGA A UNA ZONA 2)CUANDO SE FORMA UNA NUEVA ZONA
No obtienes un indicador inútil más. Obtiene una estrategia comercial completa con resultados probados.
Nuevas características:
Alertas cuando el precio llega a la z

KT Custom High Low shows the most recent highs/lows by fetching the data points from multi-timeframes and then projecting them on a single chart. If two or more highs/lows are found at the same price, they are merged into a single level to declutter the charts.
Features
It is built with a sorting algorithm that declutters the charts by merging the duplicate values into a single value. Get Highs/Lows from multiple timeframes on a single chart without any fuss. Provide alerts when the current

RSI divergence indicator finds divergences between price chart and RSI indicator and informs you with alerts (popup, mobile notification or email). Its main use is to find trend reversals in the chart. Always use the divergence indicators with other technical assets like support resistance zones, candlestick patterns and price action to have a higher possibility to find trend reversals. Three confirmation type for RSI divergences: RSI line cross 50 level Price returns to previous H/L C
FREE

3 Indicators in 1 indicator
Strategy based on price action
Made specifically for the best forex currency pairs
Can be used in the best time frame of the market
at a very reasonable price This indicator is basically 3 different indicatos . But we have combined these 3 indicators in 1 indicator so that you can use 3 indicators at the lowest price.
All three strategies are based on price action. But based on different trends. Long term, medium term and short term
Attributes : No repaintin

MT4 version | Indicador Owl Smart Levels | Estrategia Owl Smart Levels | FAQ El Indicador Fractals es uno de los elementos de la estrategia comercial del autor de Bill Williams. Se utiliza para buscar puntos de inversión de precios en el gráfico de precios y, en consecuencia, niveles de soporte y resistencia. El Indicador Full Fractals es un Fractals mejorado que está disponible en el conjunto de herramientas de casi todos los terminales comerciales. Su única diferencia es que pa
FREE
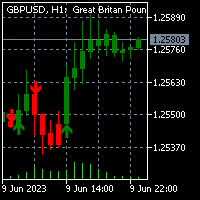
To get access to MT4 version please click here . This is the exact conversion from TradingView: "UT Bot Alerts" by "QuantNomad". This is a light-load processing and non-repaint indicator. Buffers are available for processing in EAs. You can message in private chat for further changes you need. Here is the source code of a simple Expert Advisor operating based on signals from UT Bot Alerts . #include <Trade\Trade.mqh> CTrade trade; int handle_utbot= 0 ; input group "EA Setting" input int magic_

Was: $69 Now: $34 Blahtech VWAP - Volume Weighted Average Price (VWAP) is the ratio of price to total volume. It provides an average price over a specified time interval. Links [ Install | Update | Documentation ] Feature Highlights
Configurable VWAP Line Sessions, intervals, anchored or continuous Previous day settlement line Standard Deviation bands Alerts at bar close or real time Automatic Broker or Tick volumes Significantly reduced CPU usage
Input Parameters
Expert Advisor

This is the forex visual orders tool & forex position size (lot) calculator with intuitive panel. Risk Reward Ratio Indicator works on all kind of symbols: currency pairs, indices, metals, commodities, cryptocurrencies, etc.
If you want to make sure that Risk Reward Ratio Indicator works on your favorite symbols contact us ( visit our profile ) and ask for 7-day free trial to test this tool without limits. If you want to place orders easier, faster and more intuitive? If you like to mark tr

Permíteme presentarte el Golden Sniper Indicator , una poderosa herramienta de MQL5 meticulosamente diseñada para traders que buscan mejorar su experiencia de trading. Desarrollado por un equipo de traders experimentados con más de 6 años de experiencia , este indicador ofrece un método confiable para identificar oportunidades de trading con una precisión notable. Características clave : Alertas y flechas de señal : El Golden Sniper Indicator proporciona alertas oportunas y flechas visuales de

Este indicador de marco de tiempo múltiple y símbolo múltiple puede identificar las siguientes 5 cruces: cuando una media móvil rápida cruza una línea de media móvil lenta. cuando el precio ha alcanzado una única media móvil (cerrado por encima / por debajo o simplemente rebotando). cuando ha aparecido una formación de media móvil triple (las 3 MA: s en alineación consecutiva) cuando la línea principal del MACD cruza la línea de señal. cuando la línea de señal cruza la línea MACD cero (0). Combi

Ultra-fast recognition of parabolic channels (as well as linear, horizontal and wavy channels) throughout the depth of history, creating a hierarchy of channels. Required setting: Max bars in chart: Unlimited This indicator is designed primarily for algorithmic trading, but can also be used for manual trading. This indicator will have a very active evolution in the near future and detailed descriptions on how to apply to create robots

If you want to find good trading opportunities, then you must trade near the Trend Line. This allows you to have a tighter stop loss on your trades — which improves your risk to reward . But that’s not all… Because if you combine Trend Line with Support and Resistance, that’s where you find the best trading opportunities. Now you might wonder: “So when do I enter a trade?” Well, you can use reversal candlestick patterns (like the Hammer, Bullish Engulfing, etc.) as your e

This LEGIT Indicator Can Accurately Predict the Outcome of One Bar.
Imagine adding more filters to further increase your probability!
Unlike other products, Binary Options PRO can analyze past signals giving you the statistical edge.
How Increase Your Probability
Information revealed here www.mql5.com/en/blogs/post/727038 NOTE: The selection of a Good Broker is important for the overall success in trading Binary Options.
Benefits You Get
Unique algorithm that anticipates price weaknes
Zig Zag Multi Time Frame Indicator counts in how many consecutive candlesticks the current Zig Zag "lit" on the different Time Frames. It can be used for both trend signal strategies and range breakout strategies. Shows simultaneously on all Frames in how many candles we have had Zig Zag value in the current swing. The Zig Zag period can be adjusted in the Indicator settings.

El indicador muestra cuando hay sobreprecios y divergencias sobre el RSI. Además, tiene alertas configurables, niveles de sobreprecios dinámicos y una función especial “limpiador RSI”. ¡El indicador que calcula automáticamente los rangos de sobreprecio! RSImaxmin es un indicador basado en el oscilador RSI (Relative Strength Index) que identifica de manera efectiva cambios de tendencias en el precio, ya que refleja la fuerza relativa de los movimientos alcistas, en comparación con los movimiento

Matreshka self-testing and self-optimizing indicator: 1. Is an interpretation of the Elliott Wave Analysis Theory. 2. Based on the principle of the indicator type ZigZag, and the waves are based on the principle of interpretation of the theory of DeMark. 3. Filters waves in length and height. 4. Draws up to six levels of ZigZag at the same time, tracking waves of different orders. 5. Marks Pulsed and Recoil Waves. 6. Draws arrows to open positions 7. Draws three channels. 8. Notes support and re
Indicador de tiempo hasta el final de la vela. Muestra el tiempo hasta el final de la vela, así como el tiempo del servidor. El texto puede mostrar la tendencia o la dirección de la vela, las notificaciones de sonido están integradas Peculiaridades:
Muestra el tiempo hasta el final de la vela actual, así como otros marcos de tiempo que se pueden ajustar o desactivar si es necesario AW Candle Time puede seleccionar la dirección de la vela o tendencia actual con el indicador AW Super Trend La est
FREE

El indicador muestra cuando hay sobreprecios y divergencias sobre un MACD normalizado Además, muestra señales con alertas configurables, niveles de sobreprecios dinámicos autorregulados y una configuración e interfaz simple El indicador que calcula automáticamente los rangos de sobreprecio! MACDmaxmin es un indicador basado en el oscilador MACD que identifica de manera efectiva cambios de tendencias en el precio, ya que es un indicador de momentum que captura la tendencia y muestra la relación

Indicador Heikin Ashi multidivisa y multiplazo. Muestra el estado actual del mercado. En el panel del escáner puede ver la dirección, la fuerza y el número de barras de la tendencia actual. Las velas de Consolidación/Reversión también se muestran usando colores. Puede especificar las monedas y períodos que desee en los parámetros. Además, el indicador puede enviar notificaciones cuando cambia la tendencia o cuando aparecen velas de reversión y consolidación (dojis). Al hacer clic en una celda,
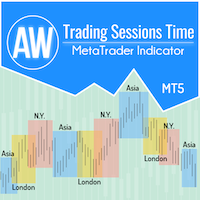
Para facilitar a los operadores la obtención de datos sobre el desempeño de los mercados y la mejor formulación de estrategias comerciales, hemos desarrollado un indicador de sesión comercial. Los horarios de apertura de varias bolsas afectan las operaciones, ya que afectan la actividad del mercado y los volúmenes de operaciones. Estos factores determinan la volatilidad y las oportunidades comerciales de los diferentes instrumentos. El indicador AW Trading Sessions Time muestra los horarios de
FREE

El indicador dibuja automáticamente los niveles de Fibonacci basándose en el indicador ZigZag, sesiones de negociación, fractales o velas (incluidos períodos de tiempo no estándar: año, 6 meses, 4 meses, 3 meses, 2 meses) (retroceso automático de Fibo). Puede elegir cualquier período de tiempo superior para el cálculo de Fibonachi. Los niveles se vuelven a dibujar cada vez que se cierra la barra actual. Es posible habilitar alertas al cruzar los niveles especificados.
También puedes analizar
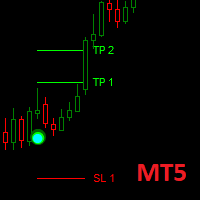
Dark Point is an Indicator for intraday trading. This Indicator is based on Trend Following strategy, also adopting the use of the atr to determine the right volatility. We can enter in good price with this Indicator, in order to follow the strong trend on the current instrument. If you love Dark Point, consider adding some power: Dark Power
Key benefits
Easily visible take profit/stop loss lines Intuitive directional points/arrows by colors Useful statistics , which indicate the
FREE

El indicador muestra los puntos de entrada y salida más adecuados. También muestra datos estadísticos sobre todas las señales para un mejor análisis de las operaciones.
Con la ayuda de este indicador podrá comprender mejor el mercado.
Tan pronto como la fuerza de la tendencia comience a debilitarse (esto se mostrará en el panel), la línea de tendencia gravitará hacia la posición horizontal - esta es la señal para salir de la operación. O puede salir cuando se alcance el nivel de beneficio me

Robust median Renko style indicator for creating custom charts resembling Median Renko, Mean Renko, Turbo Renko and Better Renko candles as well as vanilla Renko with wicks plus Point-O charts. This all in one package provides all of the signals needed by day traders, scalpers, and even long-term traders.
Main characteristics The indicator is an overlay on the main chart so it is possible to utilize one-click trading and order manipulation directly on the custom charts. Visual order placement

Indicador multidivisa y multitemporal del Canal de Desviación Estándar. Muestra la dirección actual del mercado. En el panel se pueden ver rupturas y toques (por precio) de los niveles del canal de regresión lineal. En los parámetros, puede especificar las monedas y plazos que desee. Además, el indicador puede enviar notificaciones cuando se tocan niveles. Al hacer clic en una celda, se abrirá este símbolo y punto. Este es el escáner MTF.
La clave para ocultar el panel del gráfico es "D" de f

Dibuja automáticamente los niveles de soporte y resistencia MÁS los gaps de las velas de propulsión en su gráfico, para que pueda ver hacia dónde es probable que el precio se dirija a continuación y/o potencialmente retroceda.
Este indicador está diseñado para ser utilizado como parte de la metodología de negociación de posiciones que se enseña en mi sitio web (The Market Structure Trader) y muestra información clave para la orientación y entradas potenciales. MT4 Version: https://www.mql5.c

For MT4 version please click here . This is the exact conversion from TradingView: "Range Filter 5min" By "guikroth". - This indicator implements Alerts as well as the visualizations. - Input tab allows to choose Heiken Ashi or Normal candles to apply the filter to. It means it is a (2 in 1) indicator. - This indicator lets you read the buffers for all data on the window. For details on buffers please message me. - This is a non-repaint and light processing load indicator. - You can message in p

Introducing the BOOM CRASH MASTER Indicator: Unleash the Power of Precision Trading! Step into the world of unparalleled trading with the BOOM CRASH Master Indicator, exclusively designed for the Boom and Crash indices offered by Deriv broker. This cutting-edge tool is your gateway to mastering the art of spike detection and anti-spike entries, ensuring you stay ahead of the market’s every move. Key Features: Precision Spike Detection: Harness the power of advanced algorithms to catch spikes wi

Dark Absolute Trend is an Indicator for intraday trading. This Indicator is based on Trend Following strategy but use also candlestick patterns and Volatility. We can enter in good price with this Indicator, in order to follow the main trend on the current instrument. It is advised to use low spread ECN brokers. This Indicator does Not repaint and N ot lag . Recommended timeframes are M5, M15 and H1. Recommended working pairs: All. I nstallation and Update Guide - Troubleshooting

SMT (Smart Money Technique) Divergence refers to the price divergence between correlated assets or their relationship to inversely correlated assets. By analyzing SMT Divergence, traders can gain insights into the market's institutional structure and identify whether smart money is accumulating or distributing assets. Every price fluctuation should be confirmed by market symmetry, and any price asymmetry indicates an SMT Divergence, suggesting a potential trend reversal. MT4 Version - https:/
Silas is a trading assistant for multi-timeframes traders. It show on the screen, in a very clear way, all the informations needed to suits to your trading. It show : - Supply and demand zone from 2 timeframes of your choice - Setups based of market structure from 2 timeframes of your choice - Daily current high and low points - The last 2 closed candles and the current candle from an higher time frame on the right of the graph. - Actual daily candle on the left Everything is customisable !

The Market Structure Analyzer is a powerful tool designed for traders who follow market structure and smart money concepts. This comprehensive indicator provides a suite of features to assist in identifying key market levels, potential entry points, and areas of liquidity. Here's what it offers:
1. Swing High/Low Detection : Accurately identifies and marks swing highs and lows, providing a clear view of market structure.
2. Dynamic Supply and Demand Zones: Draws precise supply and demand zo
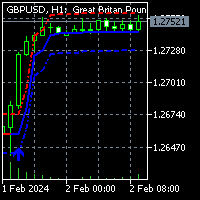
To get access to MT4 version please click here . This is the exact conversion from TradingView: "HalfTrend" by "Everget". This is a light-load processing indicator. This is a non-repaint indicator. Buffers are available for processing in EAs. All input fields are available. You can message in private chat for further changes you need. Thanks for downloading

Funciones
Indicador para el Trading de Retroceso de Fibonacci Se dibuja un gráfico de Fibonacci basado en la barra previa seleccionada entre 1H, 4H, 1D y 1W. Cuando el precio del mercado toca el nivel de Fibonacci, cambia el color y se muestra la hora del toque. El gráfico de Fibonacci se dibuja en los niveles -23.6, 0, 23.6, 38.2, 50, 61.8, 76.4, 100 y 123.6, y el gráfico se refresca cuando se actualiza la barra.
Variables
Marco de tiempo: Se dibuja un gráfico de Fibonacci con el marco
FREE

MetaBands utiliza algoritmos potentes y únicos para dibujar canales y detectar tendencias para que pueda proporcionar a los traders puntos potenciales para entrar y salir de operaciones. Es un indicador de canal junto con un potente indicador de tendencia. Incluye diferentes tipos de canales que se pueden fusionar para crear nuevos canales simplemente utilizando los parámetros de entrada. MetaBands utiliza todos los tipos de alertas para notificar a los usuarios sobre eventos del mercado. Caract

Bienvenido a Twin Peak Indicator MT5 --(Doble parte superior/inferior)-- El indicador Double Top and Bottom es una herramienta de análisis técnico diseñada para identificar posibles patrones de reversión en el mercado.
Identifica áreas donde el precio ha alcanzado dos picos o valles consecutivos de casi la misma altura, seguidos de un movimiento de precios en la dirección opuesta.
Este patrón indica que el mercado está perdiendo impulso y puede estar listo para un cambio de tendencia. *Cont

Live Trading Results MT4 Version Contact for Manual Guide Next Price $125 Free Scanner Dashboard (Contact me)
Strategy - Breakout / Retest / Aggressive Hello Everyone, We are excited to introduce one of the most reliable and high win rate patterns in trading: the Cup and Handle . This is the first time we are releasing this meticulously crafted indicator, boasting an impressive 95% success rate . It is versatile and effective across all types of pairs, stock

Classic MACD
It has MACD line, Signal line, and Histogram . The Histogram has 4 colors , showing its movement direction as simple as possible. The smoothing factor in the input helps to eliminate noisy signals. Besides different price types (hlc, hlcc, ohlc, ...), there is an option to use volume data as the source for MACD calculations (which is better to be used by real volume not unreliable tick volume). While the original MACD indicator uses Exponential Moving Average, this indicator provid
FREE

A simple indicator that automatically highlights all FVGs (Fair Value Gaps) formed on the chart, as well as FVGs on history. It is possible to select colors for FVGs of different directions (long or short), select the time interval, select the color of middle point and you can also choose whether to delete filled FVGs or leave them on the chart (the option is beneficial for backtesting). The indicator can be very useful for those, who trade according to the concept of smart money, ICT, or simply
FREE

The Price Action Finder Multi indicator is an indicator of entry points that searches for and displays Price Action system patterns on dozens of trading instruments and on all standard time frames: (m1, m5, m15, m30, H1, H4, D1, Wk, Mn). The indicator places the found patterns in a table at the bottom of the screen. By clicking on the pattern names in the table, you can move to the chart where this pattern is located. Manual (Be sure to read before purchasing) | Version for MT4 Advantages
1. Pa

Elliott Wave Trend was designed for the scientific wave counting. This tool focuses to get rid of the vagueness of the classic Elliott Wave Counting using the guideline from the template and pattern approach. In doing so, firstly Elliott Wave Trend offers the template for your wave counting. Secondly, it offers Wave Structural Score to assist to identify accurate wave formation. It offers both impulse wave Structural Score and corrective wave Structure Score. Structural Score is the rating to sh

El indicador identifica cuando ocurre una divergencia entre el precio y un indicador u oscilador. Identifica divergencias tanto regulares como ocultas. Combinado con sus propias reglas y técnicas, este indicador le permitirá crear (o mejorar) su propio sistema poderoso. Características
Puede detectar divergencias para los siguientes osciladores / indicadores: MACD, OsMA, estocásticos, RSI, CCI, RVI, Awesome, ADX, ATR, OBV, índice compuesto, MFI y Momentum. Solo se puede seleccionar un os
FREE
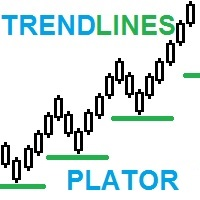
TrendPlator: Un Potente Indicador de Proyección de Tendencias para Estrategias de Trading Optimizadas ¡Descubre el poder de nuestro nuevo indicador! Con la capacidad de calcular líneas de tendencia de marcos temporales más amplios y proyectarlas directamente en tu marco temporal actual, proporciona un soporte estratégico que llama la atención de todos los traders. Estos puntos se convierten en poderosos niveles de soporte o resistencia para tus operaciones, impulsando tu estrategia de trading. I

Este indicador de múltiples marcos de tiempo y múltiples símbolos alerta sobre los cambios de color de Heiken Ashi Smoothed. Como beneficio adicional, también puede buscar cambios de color (tendencia) en la media móvil del casco. Combinado con sus propias reglas y técnicas, este indicador le permitirá crear (o mejorar) su propio sistema poderoso. Características
Puede monitorear todos los símbolos visibles en su ventana Market Watch al mismo tiempo. Aplique el indicador a un solo gráfico y mon

The Engulf Seeker indicator is a powerful tool designed to detect engulfing candlestick patterns with precision and reliability. Built on advanced logic and customizable parameters, it offers traders valuable insights into market trends and potential reversal points.
Key Features and Benefits: Utilizes revised logic to analyze previous candles and identify strong bullish and bearish engulfing patterns. Convenient arrow-based alert system notifies traders of pattern occurrences on specific symb

El indicador de superposición de gráficos muestra la acción del precio de varios instrumentos en el mismo gráfico, lo que le permite evaluar qué tan diferentes fluctúan los pares de divisas entre sí. [ Guía de instalación | Guía de actualización | Solución de problemas | FAQ | Todos los productos ]
Encuentre pares de divisas sobrecomprados o sobrevendidos fácilmente Trace hasta seis pares de divisas superpuestos en el mismo gráfico Mostrar símbolos invertidos si es necesario Adaptarse al ta
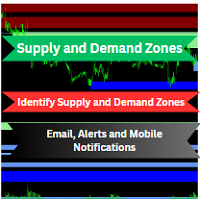
This powerful Indicator can automatically identify supply and demand zones and send you alerts, email and push notification on mobile whenever a new zone is created or when the price enters a specific zone.
This indicator integrates with any timeframe and chart or currency pair, ensuring its versatility across your trading endeavors. Supply & Demand Zones Finder(SDZF) indicator seamlessly identifies proven supply and demand zones, areas where price has consistently found support or resistanc

To get access to MT4 version please click here . This is the exact conversion from TradingView: "SwingArm ATR Trend Indicator" by " vsnfnd ". Also known as : "Blackflag FTS" by "Jose Azcarate" This is a light-load processing and non-repaint indicator. All input options are available except multi time frame. Buffers are available for processing in EAs. Extra option to show buy and sell signal alerts. You can message in private chat for further changes you need.

MA3 Trend MT5 - is the good trend indicator on three MAs . Benefits of the indicator: The indicator produces signals with high accuracy.
The confirmed signal of the indicator does not disappear and is not redrawn.
You can trade on the MetaTrader 5 trading platform of any broker.
You can trade any assets (currencies, metals, cryptocurrencies, stocks, indices etc.).
You can trade on any timeframes (M5-M15 scalping and day trading / M30-H1 medium-term trading / H4-D1 long-term trading).
FREE
FREE Heiken Ashi Smoothed indicator is fully adjustable, easy to use and comes with possibility to access the indicator via iCustom function so you can use it in your own trading software. Indicator can also pop up alerts when signal changes or send push notifications. For Metatrader 4 version click here: https://www.mql5.com/en/market/product/70824 For detailed information click: >>HERE<< Features
Easy to use Accessible via iCustom Fully adjustable Alerts and Push notifications Possi
FREE

This is advanced Multi-Symbol and Multi-Timeframe version of the "Candle Pattern Finder" indicator (search for candlestick patterns based on the book by Gregory L. Morris "Candlesticks charting explained. Timeless techniques for trading stocks and futures" ). The indicator searches for candlestick patterns for ALL symbols of the "Market Watch" window and for ALL standard timeframes from M1 to MN1. When patterns appear on any symbol / timeframe, the indicator gives a signal (text, sound, sending

The Supertrend indicator was originally created by a french fellow named Olivier Seban , and its goal is to identify the Primary Trend of prices . Its calculation is easy and based on the average of Highs and Lows and then we add the volatility of a custom period, plus a multiplier. This way we get the Supertrend Line. You can find in the web several approaches and trading strategies using this very useful indicator.
HOW TO "READ" THIS INDICATOR
If the closing prices are above Supertrend Line
FREE

Quarterly Cycles
Quarterly Cycles is based on the Quarterly Theory developed by Daye ( traderdaye on X ). This is an aid to the user to find Cycles and it is NOT automatic detected, user can select AMDX or XAMD in each Cycle and it will be visually drawn on the chart. Quarterly Cycles: Yearly, Monthly, Weekly, Daily, 6 Hour (90 minutes)
– Yearly Cycle : The year is divided in four sections of three months each Q1 - January, February, March Q2 - April, May, June Q3 - July, August, Sept

The Market Structures MT5 indicator finds and shows the Break Of Structures (BoS) pattern on the chart. The pattern is an important part of the Smart Money Concepts (SMC) system.
The appearance of a pattern means that the price breaks the last peak of an uptrend, or the last bottom of a downtrend. This indicates a change in the existing trend structure and the beginning of a new movement.
BOS is a technical analysis tool used to identify trend reversals.
The set of input parameters is simple
FREE

Level 2 Book Visualization Indicator Our innovative indicator seamlessly integrates Level 2 order book data onto your trading chart, offering a real-time view of market depth and the dynamics of supply and demand. With its two key features, you can enhance your market analysis and make more informed trading decisions: Biggest Volume Highlight: This input allows traders to instantly identify the price levels with the largest order lots. By highlighting the heaviest concentration of buy or sell or
FREE

Consolidation Zone Indicator is a powerful tool designed for traders to identify and capitalize on consolidation patterns in the market. This innovative indicator detects consolidation areas and provides timely alerts when the price breaks above or below these zones, enabling traders to make informed trading decisions. MT4 Version : https://www.mql5.com/en/market/product/118734
Key Features:
1. Consolidation Detection : - Precise Identification : The Consolidation Zone Indicator a
FREE

¿Estás cansado de dibujar manualmente los niveles de Fibonacci en tus gráficos? ¿Está buscando una forma conveniente y eficiente de identificar los niveles clave de soporte y resistencia en sus operaciones? ¡No busque más! Presentamos DrawFib Pro, el último indicador de MetaTrader 5 que realiza niveles automáticos de F ibonacci basándose en sus gráficos y proporciona alertas oportunas cuando se superan estos niveles. Con DrawFib Pro, puede mejorar sus estrategias comerciales, ahorrar
FREE

Smart Liquidity Levels is a valuable tool for identifying optimal liquidity levels, enabling retail traders like us to strategically set our stop-loss orders. T he essential tool for traders seeking to maximize their trading success. The liquidity level is a critical component of inner circle trading (ICT). It assists us in determining when and how we should enter the market. Watch the video for detailed instructions. Here's why understanding liquidity levels is crucial in trading and how our

Are You Tired Of Getting Hunted By Spikes And Whipsaws?
Don't become a victim of the market's erratic moves.. Do Something About It!
Instantly make smarter decisions with Impulse Pro's precise balance of filters and accurate statistics.
Timing Is Everything In Trading
To learn more, please visit www.mql5.com/en/blogs/post/718212 Anticipate the next big move before it unfolds in 3 Simple Steps!
Advantages You Get
Early impulse detection algorithm.
Flexible combination to different tr

** All Symbols x All Timeframes scan just by pressing scanner button ** *** Contact me after the purchase to send you instructions and add you in "Wolfe Wave Scanner group" for sharing or seeing experiences with other users.
Introduction: A Wolfe Wave is created with five-wave patterns in price. It shows supply and demand and a fight towards a balance price. T hese waves of price actions can help traders identify the boundaries of the trend . Also It helps forecast how the price will mo

This is the latest iteration of my famous indicator, Reversal Fractals, published for the first time almost a decade ago. It examines the price structure of fractals to determine possible reversal points in the market, providing timing to positional traders that already have a fundamental or technical valuation model. [ Installation Guide | Update Guide | Troubleshooting | FAQ | All Products ] Reversal fractals can start long trends The indicator is non repainting
It implements alerts of all k
FREE

This indicator is converted from UT Bot alerts indicator by @QuantNomad of Trading View to MT5. its considering ATR and creating new candles on chart and also is giving good entry points based on its candles. all buffers of new candles and also entry signals are included as buffer so can be used easily on any EA. there are also some different strategies on the internet that can be used or contact me to create it for you.

Modificación multidivisa y multitemporal del indicador Media Móvil (MA). En el tablero puede ver el estado actual del indicador: rupturas y toques (por precio) de Fast MA y Slow MA, así como la intersección de las líneas MA entre sí (cruce de media móvil). En los parámetros puede especificar las monedas y plazos que desee. Además, el indicador puede enviar notificaciones sobre el precio que toca las líneas y sobre su cruce. Al hacer clic en una celda con un punto, se abrirá este símbolo y punto
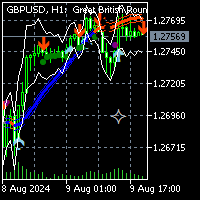
To get access to MT4 version please click here . This is the exact conversion from TradingView: " SSL Hybrid" by Mihkel00.
This is a light-load processing and non-repaint indicator. All input options are available. Buffers are available for processing in EAs. You can message in private chat for further information/changes you need. Thanks for downloading
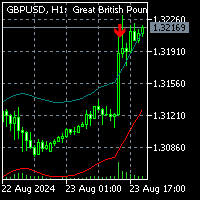
To get access to MT4 version click here . This is the exact conversion from "Nadaraya-Watson Envelope" by " LuxAlgo ". (with non-repaint input option) This is not a light-load processing indicator if repaint input is set to true . All input options are available. Buffers are available for processing in EAs. I changed default input setup to non-repaint mode for better performance required for mql market validation procedure . Here is the source code of a simple Expert Advisor operating based on

Smart Fibo Zones are powerful, auto-generated Fibonacci Retracements that are anchored to key market structure shifts . These zones serve as critical Supply and Demand levels, guiding you to identify potential price reactions and confirm market direction. Fibonacci calculations, widely used by professional traders, can be complex when it comes to identifying highs and lows. However, Smart Fibo Zones simplify this process by automatically highlighting order blocks and key zones, compl

The professional browser of News and Trading Sessions is now available in MetaTrader 5.
Now all the most important market information is collected on one dial!
News located on the Time scale. Planning your working time has never been so easy and convenient ... The news scale can be switched a day, two, a week, a month forward or backward (see the details in the short video). All news updates in real time.
Thanks to the built-in filters, you can configure the display of news by importance,

This indicator shows Fractal Breakout Trendlines and Support and Resistance
The Fractal Ascending Trendline and Fractal Descending Trendline are drawn from the last valid fractals. Breakouts can be taken above or below these trendlines. Horizontal lines are drawn from the Last upper and Last lower fractal to show support and resistance levels. Horizontal Upper and Lower Intersection lines are drawn where a fractal trendline has been last intersected, to show where to place a buy or sell orde
FREE

A top-quality implementation of the famous Super Trend indicator, which needs no introduction. It is completely loyal to the original algorithm, and implements many other useful features such as a multi-timeframe dashboard. [ Installation Guide | Update Guide | Troubleshooting | FAQ | All Products ] Easy to trade It implements alerts of all kinds It implements a multi-timeframe dashboard It is non-repainting and non-backpainting Input Parameters
ATR Period - This is the average true range per
FREE

This indicator plots the volume profile by Price on the chart
There are 5 ways to view it:
By Total Volume Traded; Volume Ticks(Forex) Separated by Buyers and Sellers; Buyers Only; Sellers Only and; Business balance (Buyers - Sellers).
It is possible to select how many days the profiles will be calculated.
On the current day it recalculates the histogram data for each new candlestick.
Another feature is to select the highest trading range by entering the desired percentage.
Th
FREE
Compruebe lo fácil y sencillo que es comprar un robot en la MetaTrader AppStore, la tienda de aplicaciones para la plataforma MetaTrader.
El Sistema de pago MQL5.community permite efectuar pagos con ayuda de PayPal, tarjeta bancaria y los sistemas de pago más populares. Además, le recomendamos encarecidamente testar el robot comercial antes de la compra, para así hacerse una idea más completa sobre él.
Está perdiendo oportunidades comerciales:
- Aplicaciones de trading gratuitas
- 8 000+ señales para copiar
- Noticias económicas para analizar los mercados financieros
Registro
Entrada
Si no tiene cuenta de usuario, regístrese
Para iniciar sesión y usar el sitio web MQL5.com es necesario permitir el uso de Сookies.
Por favor, active este ajuste en su navegador, de lo contrario, no podrá iniciar sesión.