MetaTrader 5용 새 기술 지표 - 22

고정밀 거래 및 전체 시장을 위해 설계된 슬리피지 분석 라이브 또는 데모 계정 모두에서 이익 실현 및 손절로 모든 포지션을 분석하여 브로커의 슬리피지를 분석할 수 있습니다.
내 다른 개발은 여기에서 볼 수 있습니다
모든 것을 정확하게 식별할 수 있도록 모든 포지션을 이익실현 및 손절매와 함께 사용하는 것이 좋습니다.
도움이 필요하면 구매 후 즉시 저에게 연락하십시오
여러 번 우리는 슬라이딩 옵션이 있고 무엇을 배치해야할지 모릅니다. 자 이제 좋아하는 브로커에서 시장 슬라이드를 분석하고 분석한 시간에 따라 최적의 구성을 사용할 수 있습니다. 일별, 주별, 월별, 연도 등으로 분석할 수 있습니다.
수신 매개변수 -
3가지 고급 구성이 있습니다. - 구성 모드 1회 분석 - 구성 모드 2 평균화 모드 - 구성 모드 3 슬리피지 분석
FREE

MQL5 "일일 저항 및 지지" 지표 - 일별 지지 및 저항선을 그립니다. 그리기는 그래픽 개체(추세선)의 도움을 통해서만 수행됩니다. 이 지표에는 지표 버퍼가 사용되지 않습니다. 표시기에는 설정이 없습니다. 레벨 검색은 "D1" 시간 프레임의 마지막 500개 막대에서 수행되며 이 매개변수는 코드 내부에 고정되어 있습니다. 수동 거래: 수동으로 거래할 때 이 지표는 "M10"에서 "H1"까지의 기간에 사용하는 것이 좋습니다. 그것은 두 가지 전략으로 사용될 수 있습니다: 수준 돌파와 수준에서 반등, 또는 두 전략의 조합. 기억해야 할 주요 사항은 일일 레벨이 3~4일 지연되어 그려진다는 것입니다. 이것은 레벨이 형성되는 최소 시간입니다. 드문 경우지만 추세가 3~4일 이내에 급격하게 변하면 수치가 사라질 수 있습니다. 보다 보수적인 거래를 사용하는 경우 다른 지표(추세 또는 오실레이터)에서 확인을 찾아야 합니다.

Just another Auto Fibonacci Retracement indicator . However, this is the most Flexible & Reliable one you can find for FREE. If you use this indicator and you like it, please leave a review/comment. If you are looking for a more advanced Fibo indicator, check this Free Trend-Based Fibo indicator . ### FEATURES ### Auto-calculate up to 7 Fibonacci levels on your customized frame. Adjust levels as your need. Use High/Low price or Open/Close price to calculate. Freeze the levels and don
FREE

Welcome to the Ultimate Harmonic Patterns recognition indicator that is focused to detect advanced patterns. The Gartley pattern, Bat pattern, and Cypher pattern are popular technical analysis tools used by traders to identify potential reversal points in the market.
Our Ultimate Harmonic Patterns recognition Indicator is a powerful tool that uses advanced algorithms to scan the markets and identify these patterns in real-time.
With our Ultimate Harmonic Patterns recognition Indicator, you

T he most Flexible & Reliable Trend-Based Fibonacci indicator by Safe Trading. This indicator helps you calculate Trend-Based Fibonacci levels base on the main and retracement trends to predict future price . If you just looking for a simple Fibonacci Retracement indicator, please use this Free indicator .
### FEATURES ### Auto-calculate up to 7 Trend-Based Fibonacci levels on adjustable frame. Adjust Fibonacci levels as your need. Adjust the start and the end of calculated frame
FREE

TransitTrendlines this is a automatically trendline drawer, it draw both horizontal and diagonal trendlines. The horizontal trendlines are the pivot points of the day timeframe and the diagonal trendlines are based on the current time frames. You can adjust the diagonal trendlines by increasing the number of bars to draw the diagonal trendline and can also adjust the steepness. Note that the Horizontal trendlines are based on the day pivot points not currant time frame. Join mql5 transitbk98 cha
FREE

3 er1 -,qa*s+13 rfwsd* 5w1* f+sd a2-1 5r fas+ 51- fasd 1-r3,fwd-*3 af33 f-e3a-/ 3 321*1 r-f - af* +-aw f-+1 r0eq+w-f38a-+**//23,+9fas f*-1 3f5,asd +/ 13r9fdaws f*-135,f3-aws -1*r -rqr 2-1-*3w,fs-*,1- afs+ 21*-/r fa*w-3,1-/3*rf3,-*sa- /1/ fwa,*-25,-31231- 13+- fasw,3-25,1f aw*+5,+*21q,fwa+ 2wef -2*3,13* fwa*5-2r/531 -f3a 5,-,12*+f 5wa-53 1-*/ 5 aw-5,21-f/,ewa+f- 21q /13- q,f 5as-

Count on our trend tracker to carry out your operations!
Operational Green is BUY and Pink is SELL! Enter the operation after closing the first color block!
Developed and Tested on the 5 or 15 minute Chart for Mini Index and Mini Dollar!
Can be used on any chart!
Editable colors and period!
“All strategies and investments involve risk of loss. No information contained in this channel should be interpreted as a guarantee of results or investment recommendation!”

The Advanced Pivot Point Indicator is a powerful tool designed to help traders identify key support and resistance levels in the market. This versatile indicator offers a customizable and user-friendly interface, allowing traders to select from five different pivot point calculation methods: Floor, Woodie, Camarilla, Tom DeMark, and Fibonacci. With its easy-to-read lines for pivot points (PP), support (S1, S2, S3, S4), and resistance (R1, R2, R3, R4) levels, the Advanced Pivot Point Indicator pr
FREE

Bollinger Bands based on Returns This indicator characterizes the price and volatility by providing a channel/band of standard deviations like the Bollinger Bands. In contrary to standard Bollinger Bands which uses price directly, this indicator uses returns due to normalization. The standard Bollinger Bands based on price directly, were one of the first quant or statistical methods for retail traders available. The issue with these bands, standard deviations can only be calculated, if the u

OHLC Volume Histogram displays the difference between two streams of the OHLC Volume volume indicator as a colored histogram. There are no input parameters. Calculation: Histogram = StreamUP - StreamDN where: StreamUP = Volume * UP_Coeff / (UP_Coeff+DN_Coeff) StreamDN = Volume * DN_Coeff / (UP_Coeff+DN_Coeff) UP_Coeff = High-Open DN_Coeff = Close-Low Volume - tick volume

What Is Moving Average Convergence/Divergence (MACD)? Moving average convergence/divergence (MACD, or MAC-D) is a trend-following momentum indicator that shows the relationship between two exponential moving averages (EMAs) of a security’s price. The MACD line is calculated by subtracting the 26-period EMA from the 12-period EMA. The result of that calculation is the MACD line. A nine-day EMA of the MACD line is called the signal line, which is then plotted on top of the MACD line,

“Multi timeframe Slow Volume Strength Index” shows data of three SVSI indicators from different timeframes on the current chart. The indicator has nine adjustable parameters: EMA period – EMA SVSI calculation period Smoothing – SVSI smoothing period Overbought – overbought level Middle – middle line Oversold – oversold level Drawing mode – indicator drawing type Steps – as a ladder Slope – sloping lines First SVSI timeframe – the timeframe of the first SVSI Second SVSI timeframe – th

Se você está procurando uma maneira de melhorar seus resultados de negociação, então o indicador VWAPiEagleVision é o que você precisa! Este robô é programado para rastrear o VWAP em tempo real e usar essas informações para identificar tendências e oportunidades de negociação lucrativas.
O VWAP (Volume Weighted Average Price) é um indicador amplamente utilizado pelos traders para determinar o preço médio ponderado pelo volume negociado. Ele é comumente usado por traders institucionais e pode
FREE
촛불이 끝날 때까지의 시간 표시기. 촛불이 끝날 때까지의 시간과 서버 시간을 표시합니다. 텍스트는 캔들의 추세 또는 방향을 표시할 수 있으며 소리 알림이 내장되어 있습니다. 특징:
필요한 경우 조정하거나 비활성화할 수 있는 다른 시간 프레임뿐만 아니라 현재 캔들이 끝날 때까지의 시간을 표시합니다. AW 캔들 타임은 AW Super Trend 지표로 현재 캔들 또는 추세의 방향을 선택할 수 있습니다. 추세 전략은 선택한 색상으로 강조 표시됩니다. 내장형 소리 알림 및 캔들 교체 전 시간 추가 컬러링 디스플레이는 현재 가격 옆이나 차트의 모든 모서리에 구성할 수 있으며 입력 설정에서 유연하게 조정할 수 있습니다. Instruction -> 여기 / 더 많은 제품 -> 여기 입력 변수:
기본 Candle_Time_Location - 캔들 타임스탬프의 위치입니다. 차트의 모서리 또는 현재 가격 옆에 위치할 수 있습니다. Trend_Strategy - 컬러 캔들 타임스탬프를 사용합
FREE

'Supertrend MetaTrader 5' 지표는 가장 간단한 추세 거래 시스템의 기초입니다. 그러나 여전히 매우 효과적입니다. 지표는 모든 시간대(현재 차트의 시간대)에서 작동합니다. 이름에서 알 수 있듯이 이 지표는 추세를 따르고 있으며 추세가 변경되면 지표가 추세 변경 지점을 정확하게 표시합니다. 'Supertrend MetaTrader 5'의 기본은 가격과 승수를 곱한 'Average True Range 지표' 값을 비교하는 것입니다('ATR' 대신 'True Range'를 기반으로 계산된 '이동 평균'을 사용하는 옵션도 있음) .
지표는 추세 시장 영역과 매개변수 10 및 3('ATR 기간'은 10, 'ATR 승수'는 3)에서 최상의 결과를 보여줍니다. D1 기간에는 확인 지표를 사용하는 것이 좋습니다.
매개변수에서 지표 유형을 'ATR' 또는 '이동 평균'으로 설정할 수 있으며('ATR 계산 방법 변경 ?' 매개변수가 이를 담당함) '매수' 및 '매도' 신호

"Scalper Channel MT5" is a modern channel indicator that shows the trader the direction of the trade. For work, the indicator uses built-in and proprietary technical means and a new secret formula. Load it on the chart and the indicator will show you the entry direction in color:
If the upper limit of the price channel of the indicator is blue, open a buy position. If the lower limit of the price channel of the indicator is red, open a sell position. If the border of the indicator is gray, ne

Finally a Metatrader version of the very popular (and expensive) Market Cipher B indicator, or the Vumanchu Cipher B + Divergences very popular on Tradingview platform.
This tool is very heavy on calculations, total are 31 plots using 97 buffers from several indicators. On my mid end computer, timeframes below M15 start getting a bit laggy, so it would require a powerful computer to run it properly at very low timeframes. It's still usable here, but somewhat sluggish response in Metatrader (l
FREE

This indicator is suitable for trading on the pair and many others. The indicator itself uses universal calculations of additional accuracy, but so far they are optimized for some currency pairs. Many settings can be configured on the main menu. He displays his calculations on the graph in the form of icons. There are two types of icons. In the tester, it works fine by default in the settings. You can specify a color for its icons. There is a panel. Happy trading.

Multi-timeframe trend indicator based on the ADX / ADXWilder indicator with Fibonacci levels
The indicator shows trend areas using ADX or ADXWilder indicator data from multiple timeframes. The impulse mode of the indicator allows you to catch the beginning of a trend, and several "Screens" with different timeframes allow you to filter out market noise. Fibonacci levels are added to the price chart, which have flexible settings.
How the indicator works: if PDI is greater than NDI, then it`
FREE

The fact that round number levels have a significant influence on the market cannot be denied and should not be overlooked. These psychological levels are used by both retail Forex traders and major banks that deal in Forex. Very simple and effective indicator and most importantly free. ////////////////////////////////////////////////////////////////////////////////////////////////////////////////////////////////////////////////////////////// The program does not work in the strategy tester.
FREE

This indicator is an automated version of the Fibonacci retracement (Fib) indicator. Deciding the best areas to use when drawing the fib can be tricky and this indicator was made with that in mind. When you drop it on the chart it will automatically choose the best points to draw the fib with, but in case you aren't satisfied with those regions, you can adjust it as you wish.
FREE

Multi-timeframe trend indicator, based on the ADX / ADXWilder indicator The indicator shows trend areas using ADX or ADXWilder indicator data from multiple timeframes. The impulse mode of the indicator allows you to catch the beginning of a trend, and several "Screens" with different timeframes allow you to filter out market noise.
How the indicator works: if PDI is greater than NDI, then it`s bullish movement; if PDI is less than NDI, then it`s bearish movement; to determine any trend, it
FREE

Trend indicator based on the ADX / ADXWilder indicator
The indicator shows trend areas using ADX or ADXWilder indicator data.
How the indicator works: if PDI is greater than NDI, then it`s bullish movement; if PDI is less than NDI, then it`s bearish movement; if ADX is less than or equal to the filter value specified in the parameters, then there is no movement state.
Input parameters of the indicator: Calculate Timeframe - timeframe for calculation; ADX Type - type of ADX calculation
FREE

The Advanced Momentum Trend indicator is an indicator used to determine trend directions. It determines the trends by considering many factors while calculating the trend. You can use this indicator as a trend indicator or in combination with other indicators that suit your strategy. You can also use it as a stand-alone trend filtering. Thanks to the alert feature, you can instantly learn about the new trends. To View Our Other Products Go to the link: Other Products

Price Stellar! is a bot that has the strategy of grabbing rebounds on the roofs or floors of the Yellow channel, accompanying an ema to hunt the bullish or bearish trend, It can be seen very clearly in the photo what the strategy is about works for all seasons to scalp and long works for all forex pairs and for the pairs of synthetic indices ! from now to enjoy good profit World Investor.

Trend Uranus! It is an indicator that works in line with support and resistance, giving entrances with the roofs and floors Red (Sale) Green (Buy) to catch a better trend ideal for scalping in the Volatility 75! works for all synthetic index pairs ! and for all forex pairs! ideal for the pair Eur/Usd, Usd/Jpy! from now to enjoy good profit!!!!! World Investor.

Arrow Venus! is an oscillator that uses the strategy of crosses capturing the entry whether for sale or purchase where it can be seen in the photo, when the line crosses the blue line with the red one, marking the red arrow it's sale, when the blue line crosses the red one upwards and marks the blue arrow, it is a buy signal very good for scalping and long! used at any time for forex markets and synthetic indices

Fibo expert! It is an automatic fibonacci indicator. adapting to any temporality, to catch those rebounds, or the path of that trend, special to make longs in H1 or H4 clear the trend, but it also works for scalp in m1 up to m15 works for all forex pairs and for all pairs of synthetic indices, ideal for volatility 75 in synthetics no more to enjoy good profit World Investor.

Stock Mantra It is an oscillator that is used to hunt long trends, as can be seen in the mantra, it gives input when the lines are crossed, the blue line above crossing the red line gives entry for sale, When it is the other way around, crossing the blue line, the red one up gives a buy entry signal. super simple and effective! works for all forex pairs and synthetic indices! used in all seasons good profit World Investor

"AV Monitor MT5" is an indicator for MetaTrader 5, which alowes a history analysis of the closed orders. It helps to achieve a quick visual analysis of your own trading or different expert advisors among themselves. Compare and analyze your expert advisors: Which one is the best?
I use an "AV Monitor MT5" indicator per running expert advisor chart to track its performance split into long & short, as well as an index chart e.g. DOW with this indicator and the setting "Show Balance & Equity" to
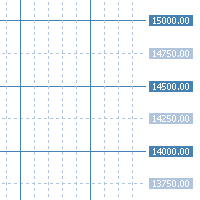
"AV Grid MT5" is an indicator for MetaTrader 5, which automatically displays round numbers as horizontal lines and a sensible period separation .
Round prices can be used as support and resistance in trading.
It is an improvement on the "Grid" setting, which also draws a grid on the chart.
Improvements :
- Round levels instead of arbitrary positioning of the horizontals
- Structure by highlighting all x lines (main lines, 2 or 5 makes sense)
- Vertical lines are each in two p

El indicador "Time Broker Deriv" está diseñado específicamente para su uso en los índices sintéticos Boom y Crash, así como en otros pares de trading disponibles en la plataforma MT5. Su función principal es proporcionar la hora del broker en comparación con nuestra hora local. Es importante destacar que el indicador "Time Broker Deriv" solo muestra la hora del broker.
FREE

The indicator is getting the four most important trading sessions: New York London Sydney
Tokyo The indicator auto calculate the GMT time. The indicator has buffers that can be used to get the current session and the GMT.
You can use it as stand alone indicator and you can turn the draw off and call it from your EA. INPUTS Max Day: Max days back to get/draw. London Session On: Show/Hide London Session. New York Session On: Show/Hide New York Session. Sydney Session On: Show/Hide Sydney Sessi
FREE

This creative simple indicator will provide a precise framework for market sentiment within technical analysis of different timeframes. For instance, for traders like me that uses "Mark Fisher" strategy regularly, this is a perfect indicator for having an insight to markets from short term to long term point of view, using Break points of candles' lows and highs and perfect to combine with "Price Action" . For more options and modifications you can also edit the low timeframe candles withi
FREE

*Used by MeditionSeed EA. Meditation is a practice in which an individual uses a technique – such as mindfulness, or focusing the mind on a particular object, thought, or activity – to train attention and awareness, and achieve a mentally clear and emotionally calm and stable state.[1][2][3][4][web 1][web 2] Plant a Meditation Seed to have wonderful future.
FREE

*Used by MeditionSeed EA. Meditation is a practice in which an individual uses a technique – such as mindfulness, or focusing the mind on a particular object, thought, or activity – to train attention and awareness, and achieve a mentally clear and emotionally calm and stable state.[1][2][3][4][web 1][web 2] Plant a Meditation Seed to have wonderful future.
FREE

*Used by MeditionSeed EA. Meditation is a practice in which an individual uses a technique – such as mindfulness, or focusing the mind on a particular object, thought, or activity – to train attention and awareness, and achieve a mentally clear and emotionally calm and stable state.[1][2][3][4][web 1][web 2] Plant a Meditation Seed to have wonderful future.
FREE

Correlation indicator is a trading indicator that compares price correlations on up to 8 different instruments simultaneously. This indicator is designed to be very versatile. It can be used to trade many different strategies from scalping to hedging to simple trend-following based on an average trend direction of multiple currency pairs or it can signal only when all the pairs correlate on the same side of a particular moving average. The indicator automatically applies the same moving average

HiLo Trend Matrix is an advanced multi-timeframe trend indicator that scans and analyzes multiple timeframes to determine the overall trend direction, allowing you to effortlessly ride the trend waves as they emerge. By scanning the four higher timeframes, starting from your current timeframe or a selected one from the input parameters, you'll always have a comprehensive view of the market's movements. And when the trend aligns, the HiLo Trend Matrix delivers an alert, so you can seize the oppo

The indicator draws supply and demand zones. The zone timeframe can be set independently of the chart timeframe. For instance, it is possible to set M5 zones on an H4 chart. The importance of zones can be adjusted using the zone strength parameter. Demand zones are displayed if at least one candle in the range of the zone is entirely above the zone. Similarly, supply zones are displayed if at least one candle within the zone is entirely below the zone.

(Google 번역) 표준 Heikin Ashi 캔들 표현에는 지수 총 가격 의 이동 평균(EMA) 이며, EMA 의 알파 값은 고정되어 있습니다. 0.5에서( EMA 기간 3.0에 해당) 이 동적 버전에서 기간은 사용하려는 값으로 변경할 수 있으며 이를 통해 다음을 수행할 수도 있습니다. 대략적인 다중 시간 프레임 분석 또는 일종의 후행 손절매로 낮은 값 또는 높은 값을 사용합니다. 의 교차점 Heikin Ashi 시가에 대한 실제 종가 가격은 또한 추세 방향.
또한 표준 EMA 외에도 이 버전에는 거의 제로 지연 EMA 를 사용할 수 있는 옵션도 있습니다. 대신, 특히 더 긴 기간을 사용할 때 추세 방향의 변화를 더 빠르게 감지할 수 있습니다. 평균.
지표를 차트에 첨부할 때 차트를 차트로 자동 전환하는 옵션도 있습니다. 선 그래프 모드 와 선택적으로 선 그래프 에서 실제 종가 를 숨길 수 있습니다. 그렇지 않으면 실제 종가 가격과 Heikin Ashi 열린 가치. (Ori
FREE

나만의 촛대 패턴을 정의하면 이 패턴이 나타날 때 이 지표가 화면에 표시됩니다 Strategy Tester에서 무료로 테스트하고 선택한 자산에 캔들스틱 패턴이 몇 번 나타나는지 확인할 수 있습니다. 패턴의 양초를 모두 칠하거나 하나만 칠할 수도 있습니다 이 지표는 캔들스틱 분석에 유용하며, 가격 조치 및 적나라한 거래 전략에 사용할 수 있습니다. 선택한 움직임을 나타내는 지표입니다
naman-ui chosdae paeteon-eul jeong-uihamyeon i paeteon-i natanal ttae i jipyoga hwamyeon-e pyosidoebnida Strategy Testereseo mulyolo teseuteuhago seontaeghan jasan-e kaendeulseutig paeteon-i myeoch beon natananeunji hwag-inhal su issseubnida. paeteon-ui yangcholeul modu chilhageon

This Indicator is based on 4 Exponential Moving Averages ie. 3 EMA-32 (applied to prices close, high & low), and EMA-200 (indicating trend direction). The EMA32-200 produces quality buy and sell entries indicated by arrows and signal alert that appears whenever the price moves above the EMA-200 and returns below the EMA-32s and returns to break above the previous swing high triggering a high probability buy entry. The Sell conditions are the opposite of the buy conditions.
FREE

Optimized Trend Tracker OTT is an indicator that provides traders to find an existing trend or in another words to ser which side of the current trend we are on.
We are under the effect of the uptrend in cases where the prices are above OTT ,
under the influence of a downward trend, when prices are below OTT
it is possible to say that we are.
The first parameter in the OTT indicator set by the two parameters is the period/length.
OTT will be much sensitive to trend movements if i

MACD (short for Moving Average Convergence/Divergence) is one of the most famous and oldest indicators ever created and is widely used among beginners . However, there is a newer version of the MACD that is named Impulse MACD which have less false signals than the standard MACD. Classic MACD helps us to identify potential trends by displaying crossovers between two lines. If MACD line crosses above the Signal line it shows us that the market is potentially up trending and that
Unlike many other indicators including the moving average indicator, Pivot Point can be a leading indicator. In these systems, the price levels of the previous period are used to determine the critical points instead of relying on the current price performance. Such an approach provides a clear framework for traders to plan their trades in the best possible way.
You can use this method and its combination with the methods you want to build and use a powerful trading setup. MT4 version
Let us k

The 3 Candlestick Engulf indicator is a candlestick pattern indicator that considers the last 3 bearish candles for a Bullish Engulf candlestick pattern signal and last 3 bullish candlesticks followed by a Bearish Engulf candlestick pattern for a bearish signal. Engulfs are also presented in both trending and non-trending situations of the market though recommended to move with signals that are in line with the trend basing on the moving average. The indicator has multiple input features that yo
FREE

This is an indicator that shows total pips ,order counts and the total profit accumulated for the open orders of the pair attached. The colors change depending on if the total profit is positive , negative or zero. Contact:
If you have some questions or if you need help, kindly contact me via Private Message. Author: A.L.I, fintech software engineer and a passionate forex trader.
FREE

Automatically detect bullish or bearish order blocks to optimize your trade entries with our powerful indicator. Ideal for traders following ICT (The Inner Circle Trader). Works with any asset type, including cryptocurrencies, stocks, and forex. Displays order blocks on multiple timeframes, from M2 to W1. Alerts you when an order block is detected, migrated, or a higher timeframe order block is created/migrated. Perfect for both scalping and swing trading. Enhanced by strong VSA (Volume Spread A

Shows min and max of last M5 Candle. Can be used to trade breakouts of last M5 candle. The M5 Candle Breakout Strategy avoids to stay too long in a sindways phase. See documentation on @swisstrader3713, where you can follow my live trading. The only parameters are the color of the lines defining the M5 stretch. Best use the indicator in M1 timeframe. The M5 Breakout Strategy has helped me to reduce overtrading.
FREE
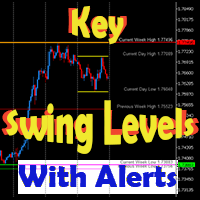
This dynamic indicator will draw the Key Swing High and Low Levels for any symbol on any timeframe!
User may Hide or Show any Level or Label and also Receive Alerts when price returns to that key level via Pop-Up, Push, Email or Sound.
Levels include Current Day High/Low, Previous Day High/Low, Current Week High/Low, Previous Week High/Low and Monthly High/Low.
The Levels are labeled with the Price Point Data Listed next to it for quick easy reference.
You can change the Style, Size an

The Intra Daily Range Projection indicator forecasts the current day’s price range on the basis of the previous day data. All calculations are based on the book “New Science of Technical Analysis” by Thomas R. DeMark.
When you're analyzing investments, the trading range is a valuable analytical tool. The average trading range is the average distance between the high and the low over a specified period of time. You can calculate the average high-low range on a piece of paper, a spreadsheet, o

Phase accumulation adaptive bandpass filter MT5 Indicator is a Metatrader 5 (MT5) indicator and the essence of this technical indicator is to transform the accumulated history data. Phase accumulation adaptive bandpass filter MT5 Indicator provides for an opportunity to detect various peculiarities and patterns in price dynamics which are invisible to the naked eye. Based on this information, traders can assume further price movement and adjust their strategy accordingly.
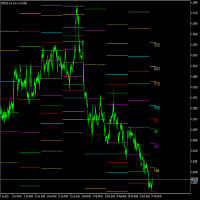
Fibonacci Pivots is a multi-timeframe indicator with custom alerts, designed to help traders easily identify key levels of support and resistance on any financial instrument. This advanced indicator uses the popular Fibonacci sequence to calculate pivot points based on the specified timeframe, depth, and backstep parameters. It also comes with customizable alerts. You can choose to be alerted when the price crosses any of the pivot points or when the price is within a specified frequency and pi
고급 Gartley 패턴 인식 표시기에 오신 것을 환영합니다. 이 지표는 가격 구조의 HH 및 LL과 피보나치 수준을 기반으로 가틀리 패턴을 감지하고 특정 fib 수준이 충족되면 지표가 차트에 패턴을 표시합니다. MT4 버전 : WH Advanced Gartley Pattern MT4 **이 표시기는 모든 패턴 인식을 포함하는 콤보 Ultimate Harmonic Patterns MT5 의 일부입니다.**
특징 : 높은 정확도 로 Gartley 패턴을 감지하는 고급 알고리즘. 매우 빠르고 리소스가 적습니다 (머신에 대한 요구가 적음). 지연 이나 다시 그리기가 없습니다. 사용자 정의 Fib 수준 조정(선호하는 설정에 따라 피보나치 수준을 변경할 수 있음) 약세 및 강세 패턴을 동시에 표시합니다(약세 또는 강세 설정에 대해 여러 패턴을 표시하는 기능 포함). 거래 수준 라인을 표시합니다(조정 가능한 중지 및 목표
FREE

The TrendChangeZone indicator displays global and local price highs and lows on the chart. The indicator also shows the global trend on the chart and corrective waves. This indicator is designed to determine the direction and change the trend. Most importantly, the indicator shows trend continuation or reversal zones. An indispensable assistant in trading. The indicator does not redraw. The indicator can work on all trading instruments.
Important !!! Top trend if 2 (two) or more b

(Google 번역) 이 지표는 Worden Brothers, Inc 에서 개발한 원본 " TSV(Time Segmented Volume) "를 기반으로 합니다. 그러나 여기에 몇 가지 기능을 추가했습니다. 원본에서 사용하는 기본 종가만 사용하는 대신 적용할 가격을 선택할 수 있습니다. 실제 범위를 기반으로 하는 가상 볼륨을 포함하거나 볼륨 가중치를 전혀 적용하지 않는 등 사용할 볼륨 가중치를 선택할 수도 있습니다. (Original text) This indicator is based on the original “ Time Segmented Volume (TSV) ” developed by Worden Brothers, Inc . However, I added an extra few features to this one. One can choose the price to be applied, instead of only having the default close price us
FREE

(Google 번역) 이 지표는 John Welles Wilder의 ATR(Average True Range) 에서 영감을 받았지만 몇 가지 추가 정보가 있습니다. 마찬가지로 실제 범위의 지수 이동 평균을 계산하지만 와일더 대신 표준 알파 가중치를 사용합니다. 또한 범위 평균의 평균 편차를 계산하여 오프셋으로 표시합니다. 이렇게 하면 변경 사항을 더 빠르게 식별할 수 있을 뿐만 아니라 그 영향도 파악할 수 있습니다. (Original text) This indicator was inspired by John Welles Wilder's average true range (ATR) , but with some extra information. Similarly, it calculates the exponential moving average of the true range, but using the standard alpha weight instead of Wilder's . It a
FREE

(Google 번역) 이 지표는 MetaTrader 설치와 함께 소스 코드 예제로 제공된 원본 지그재그 를 기반으로 합니다. "깊이" 채널과 해당 브레이크 아웃을 표시하기 위한 몇 가지 추가 기능으로 다시 작성했습니다. 또한 이전 지그재그 지점을 관찰할 수 있습니다. 선택적으로 탈주 발생 시 사용자에게 경고할 수 있습니다. 알림은 단순히 단말기에 있을 수도 있고 모바일 기기의 푸시 알림을 통해 나만의 맞춤 텍스트로 보낼 수도 있습니다. (Original text) This indicator is based on the original ZigZag provided as a source code example with MetaTrader installations. I rewrote it with some extra features for displaying the “depth” channel and the respective break-outs. It also allows one to

SUPERTREND; It is a trend following indicator based on the SuperTrend ATR created by Olivier Seban. It can be used to detect changes in trend direction and locate stops. When the price falls below the indicator curve, it turns red and indicates a downtrend. Conversely, when the price moves above the curve, the indicator turns green, indicating an uptrend. Like other indicators, it works well on SuperTrend when used in conjunction with other indicators such as MACD, parabolik SAR, Bollinger Band
FREE

FREE VERSION OF THE PRICE ACTION ADVANCED LEVELS free on demo account. full product: https://www.mql5.com/en/market/product/94338 Accurate horizontal support and resistance levels Accurate for price action analysis. All Markets: forex, stocks, indices, metals, commodities ,and crypto Available for meta trader 5 Adjustable parameters
inputs: For multiple timeframe analysis: adjust "analysis_timeframe" accordingly "depth_of_retrenchments" represents how big the peaks or troughs are. "lookba
FREE

The CCI Trend Dashboard is an advanced technical analysis tool available that provides a dashboard interface for traders to analyze multiple symbols and timeframes at once. It uses the Commodity Channel Index (CCI) in combination with currency strength and volumes to analyze market trends. The tool is user-friendly and suitable for both beginner and advanced traders. Note: The values are derived from the CCI values of the respective symbol and timeframe using the specified period from the sett

Perfect Sniper! is a triple indicator with support resistance detection, downtrend channel, uptrend channel Bands included! where he hunts the rebounds in the red lines for sale, in the green lines mark purchase, in the lower bands that are the breaks gives another second entry either buy or sell, perfect to take advantage of the double entrance, It is used in any temporality, It is used to scalp and long on h1 or h4 to D1. It works for Forex markets, All pairs. It is used for the synthetic inde
One of the basic needs of every trader is to have a checklist to enter every position. Of course, using pen and paper may not be convenient forever. With this indicator, you can have a small checklist next to the screen for each of your charts and use it for better use in your trades.
By pressing the r button, you can return everything to the original state.
MT4 Version
This indicator will have many updates and special settings will be added to it.
You can contact us via Instagram, Telegram
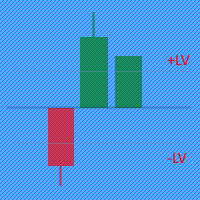
The Price Movement Strength indicator displays the direction and strength of the price change in the form of a candle on each price bar. If the indicator shows the closing level of the candle equal to zero on the current bar, then the price has not changed during bar. If the indicator shows a green candle, then the price of the trading instrument is growing, and vice versa, a red candle signals a price fall. Input parameters: The indicator has two parameters for setting buy/sell levels: BuyLevel

Máquina Trader Tendência Count on our trend tracker to carry out your operations on the Mini Index and the Mini Dollar!!! Operational Green is BUY and Pink is SELL!!! Enter the operation after closing the first color block!!! Developed and Tested on the 5 or 15 minute Chart for Mini Index and Mini Dollar!!! Can be used on any chart!!! Editable colors and period!!!

Trend Fibonacci is a unique indicator that combines a power of Fibonacci sequences and ranges. Channel Group: Click Here
How to read:
- There are three zones --> red, gold and green
- Red candlestick = downtrend
- Green candlestick = uptrend
- Gold candlestick = no established trend
Inputs: Per = number of bars used for calculations FirstRatio = first Fibonacci ratio (Or use any ratio you want) SecondRatio = second Fibonacci ratio (Or use any ratio you want)
!! IF YOU PURCHASE TH
FREE
This indicator will identify when Fast Moving Averages (EMA, SMA, or LW) cross Slow Moving Average lines on any timeframe and with any symbol.
When the moving averages cross and price close above or below the crossing, the User will receive an alert via pop-up, push, or email.
Choose any two Moving Averages to cross to receive an alert and the Indicator will also paint the Moving Average Lines and Arrows.
You can choose Exponential Moving Averages (EMA). Simple Moving Averages (SMA) or Lin

This is a rate of change chart from the baseline. features. comparison of max 5 symbols. free baseline with drag. free timeframes of the sub window. reverse chart selectable if you need.
i.e. set symbols "-US100" notes In the sub window, you can't believe datetime on the chart, because the numbers of bars are different. You can check the baseline if you click symbol name. The dragged baseline is temporary. You must set it to indicator's parameter if you need.
FREE
MetaTrader 마켓 - 거래자를 위한 로봇 및 기술 지표는 거래 터미널에서 바로 사용할 수 있습니다.
The MQL5.community 결제 시스템은 MQL5.com 사이트의 모든 등록된 사용자가 MetaTrader 서비스에서 트랜잭션을 수행할 수 있습니다. 여러분께서는 WebMoney, 페이팔, 또는 은행 카드를 통해 자금을 예치하거나 인출하실 수 있습니다.
트레이딩 기회를 놓치고 있어요:
- 무료 트레이딩 앱
- 복사용 8,000 이상의 시그널
- 금융 시장 개척을 위한 경제 뉴스
등록
로그인
계정이 없으시면, 가입하십시오
MQL5.com 웹사이트에 로그인을 하기 위해 쿠키를 허용하십시오.
브라우저에서 필요한 설정을 활성화하시지 않으면, 로그인할 수 없습니다.