MetaTrader 5용 무료 Expert Advisor 및 지표 - 28

Candle com coloração de Volume Price Analysis (VPA) segundo as definições da Anna Coulling, é possível configurar períodos de climax e rising, fator de extreme e fator de rising.
Pode-se usar volume real ou volume de ticks. O VPA considera a variação de preço por volume do período, indicando se um movimento está recebendo ignição, está em seu climax ou se já não existe mais interesse.
FREE
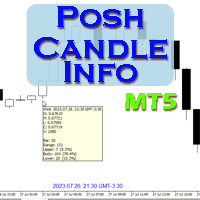
Show candle info with: Time in selected timezone Bar number Candle range points Upper wick points and percentage Body points and percentage Lower wick points and percentage Mark large/small candle body with customizable line. Settings group: Broker and local timezone. Lookback bars for candle marking. Large candle body Small candle body Date and time info with auto position or custom the x and y coordinate.
FREE

Indicador Maestro del Trader
Características Principales: Spread del Mercado en Tiempo Real : Visualiza el diferencial entre el precio de compra y venta directamente en tu gráfico. Cuenta Regresiva del Cierre de Vela : No más sorpresas al final de la vela. El indicador muestra un cronómetro que te informa cuánto tiempo queda antes de que se cierre la vela actual. ¡Actúa con precisión en los momentos cruciales! Ganancias o Pérdidas en Tiempo Real : ¿Estás en verde o en rojo? El Indicador Maes
FREE

Versión Beta El indicador técnico Non Lag MA MTF (Non-Lagged Moving Average Multi-Time Frame) es una versión avanzada del Non Lag MA que permite visualizar la media móvil en varios marcos temporales simultáneamente. Pros: - Visión integral: Proporciona una visión más completa al mostrar la media móvil en diferentes marcos temporales en un solo gráfico. - Anticipación de tendencias: Ayuda a anticipar cambios de tendencia al observar la convergencia o divergencia de las medias móviles en distint
FREE

This is my version of Currency Strength Meter.
One of the best indicators for spotting weak and strong currencies. Based on the information obtained, its very simple to decide which currency buy and which sell.
It is very simple to use, but extremely effective.
General rules are: - Buy currencies above level 0
- Sell currencies below level 0
You can also mix the main currencies together -->
EURUSD > 0 and USDJPY < 0 --> BUY on EURJPY
FREE

At first, I got my teeth into Phoenix Ultra Expert Advisor.
This Expert Advisor will support automatic close order if the direction is correct and perform recovery if the direction is wrong. If you enter an order: 1. The price goes in the right direction and hits the Min Profit Point , trailing stop 20% of the current profit. 2. The price goes in the opposite direction, the Expert Advisor will place the order with the volume is Recovery Volume Percent at the input, the distance t
FREE

RSI Scanner, Multiple Symbols and Timeframes, Graphical User Interface An indicator that scans multiple symbols added from the market watch and timeframes and displays result in a graphical panel. Features: Multi symbol Multi timeframe Alerts and Notifications Live Monitoring Sorting modes One click to change symbol and timeframe Inputs for RSI and scanner settings
FREE

This EA offers functions: Multifunctional chart panel, sell, buy, pending orders, reverse function, Partial sales (automatically by strategy), Tralling-Stop (automatically by strategy), Three trading strategies, Stoploss on the day (risk management), stoploss (risk management), take profit (money management), Tralingstop and Traling-Step (strategy), risk per order (risk management) and much more!
Customizable settings:
EA settings
1: Sound (ON/OFF) 2: deal sound (list) 3: RISK MANAGER (ON
FREE

This EA uses two moving averages one slow and one fast, when ever they cross it checks if the RSI value is greater or lesser than 50 depending on the signal given by the Moving averages. After that it checks if the Stochastics lines are going up or down and not in the Over Bought or Over sold zone. so in total it uses an RSI, 2 Moving Averages ,Stochastics and an ATR to try to evade stop hunting.Also has a trailing function to hold the profits if price moves X pips tested on a 5 min time frame
FREE

The most advanced news filter on MQL market This is the demo version of my Expert Advisor " Take a Break ". All EA operations are limited to 1 chart symbol only. Please check the " What's new " tab regularly for a complete and up-to-date list of all improvements + parameters. Take a Break has evolved from a once simple news filter to a full-fledged account protection tool. It pauses any other EA during potentially unfavorable market conditions and will continue trading when the noise is over. Ty
FREE

ADR ST Patterns Strategy is a modification of the classical ADR indicator. This simple indicator corresponds to the parameters specified in the ST Patterns Strategy ( https://stpatterns.com/ ) . Structural Target Patterns represents the market consistently divided into components. No trend lines, geometric proportions of the model itself, trading volume, or open market interest are needed for the formation of ST Patterns . They are easily recognized and built only on the basis of breaking
FREE
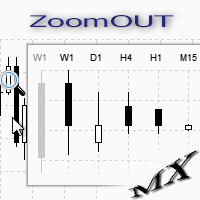
ZoomOUT allows you to have a quick look at a selected bar on a higher timeframe in a pop-up window. After the launch, the indicator works in the background mode occupying no place in the chart and consuming no resources. When activating the indicator by Shift + o (customizable), a pop-up window with a chart displaying bars of higher timeframes is created. To hide a pop-up window, left-click on any clear place on the chart. The indicator is simple and requires no settings.
FREE

Backtesting PRO: Make a review of the market based on the available history of your broker. Practice your strategies and verify them in seconds. Remember to maintain excellent risk management, check your days and hours of operation. R emember to start it in the shortest period to operate. Any questions or suggestions can be sent to this email: autoeducacion0110@gmail.com
FREE

Distance Price Moving Average
This is an indicator that calculates in real time the distance from the price to the moving average.
With it you can monitor the maximum deviation of the price from the moving average in a certain period of time chosen by you, for example, monitor the distance according to the maximum deviation of the last 30 days.
It is possible to choose the period and type of the moving average.
To make it even better, we have added the possibility of two alert levels
FREE

The Volume Heatmap indicator visually shows the INTENSITY of the volume taking into account the concept of standard deviation. Purpose of the Indicator: High volumes are common where there is a strong consensus that prices will increase. An increase in volume often occurs at the beginning of a new upward trend in the price of an asset. Some technical analysts do not rely on trend confirmations without a significant increase in volume. Low volumes usually occur when an asset is heading for a down
FREE

Description: Protect your live or evaluation accounts by not letting it hit the maximum daily draw down! This utility is best for prop firms such as FTMO and MFF(MyForexFunds) and etc. Guide: Apply to EURUSD 1m Chart.
Default Settings: Maximum Draw Down Balance: 4% Account Balance. Maximum Draw Down Equity: 4% Account Balance Target Profit Balance: 1% Account Balance. Target Profit Equity: 1% Account Balance. Time To Reset: 16:57 to 16:58 GMT
Behavior: Setting starting_balance to 0 will au
FREE

Idea I programmed this tool out of the necessity to be constantly informed about what is going on. Before I sometimes forgot to set a stopp loss, this is impossible with this tool. Further this tool allows you to make distributed entries, eg. with a first feeler with 0.1 contracts and when the direction is the right one you just put more contacts into the game. Money- and risk management is built in. If you use more then the predetermined number of contracts there is a warning. You are constantl
FREE
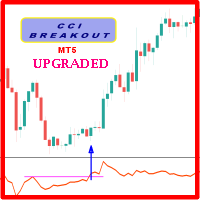
Probability emerges to record higher prices when CCi oscillator breaks out oscillator historical resistance level when exhibit overbought values. Since, oscillator breakout of support and resistance have similar effect as price breaks support and resistance levels, therefore, its highly advised to confirm price breakout with oscillator breakout; certainly, will have the same output in short trades. Concept is based on find swing levels which based on number of bars by each side of peak or troug
FREE

The SpreadTracer and TimeLeft indicator is a powerful yet straightforward tool designed for traders who want to keep a close eye on market conditions directly on their chart. This custom indicator provides essential real-time information about the spread and candle time, making it easier to make informed trading decisions. Key Features: Current Spread Monitoring : The indicator constantly displays the current spread of the trading pair, helping you assess the cost of entering or exiting a positi
FREE

입력 신호 평균 필터가 있는 추세 추적 표시기
이 지표는 이동 평균을 진입 신호로 사용하여 추세 추적기 및 필터 역할을 합니다. 이동 평균은 다양한 추세 범위를 결정하는 데 중요합니다.
- 표준 200일 1차 평균은 장기 추세를 나타냅니다. - 50일 2차 평균은 중기 추세를 나타냅니다. - 20일 3차 평균은 가장 짧은 추세를 나타냅니다. - 9개 기간 평균은 즉각적인 조치를 위한 진입 트리거 역할을 합니다.
이 지표는 시장 동향에 대한 정확하고 포괄적인 분석을 제공하고 신중하게 선택된 이동 평균을 기반으로 적시에 진입점을 식별하는 거래자에게 유용한 도구입니다.
진입 신호 평균 필터가 포함된 추세 추적 지표를 사용하여 거래 전략을 강화하고 더 많은 정보에 입각한 결정을 내리세요. 지금 다운로드하여 거래 결과를 높이세요!
FREE

Zigzag Indicator For RSI, To easily identify the highs and lows of the rsi signal. It is easier to observe divergent and convergent signals. Default setting: InpRsi =14 //Rsi Period InpDepth =12; // Depth InpDeviation =5; // Deviation InpBackstep =3; // Back Step
If you want open Exness account try this link : https://one.exness-track.com/a/teg5teg5 Dev buy taphu: Ha Van Tan - hatatrata - Trader's profile - MQL5 community Email: tan.ha@outlook.com
FREE

This Indicator works as a momentum oscillator however it is most used to surf the trends. Despite of being an oscillator, MACD (Moving Average Convergence/Divergence) doesn't work with over limit conditions (such as OverBought or OverSold). Graphically it's shown as two lines and an histogram with the diference of them. Standard metatrader has this indicator, however with only the two lines and without the histogram. This way it is much easier to read and uderstand it.
FREE

Bamboo expert is based on the custom indicator Bamboo . Entry points are determined using Bamboo values. Positions are closed when reaching specified profit and loss levels or when opposite signal appears if Stop Loss and Take Profit values are zero. Input Parameters Period - Period parameter of the indicator Bamboo; Mode - operation mode of the Expert Advisor (0-7); Stop Loss - loss fixing level in points; Take Profit - profit fixing levels in points; Lot - lot size. The screenshots demonstrate
FREE

Indicator of Stowell's Three-Bar Net Line. In this indicator, the number of bars used for determining the lines can be defined in the settings. With the default settings, the indicator draws arrows in the areas of the line breakout. The lines are not displayed on the chart by default. but can be enabled.
Parameters Alerts - enable alerts when arrows appear. Arrows appear on a forming bar and can disappear during bar formation. Therefore, it is recommended to wait for the bar with the arrow to
FREE

To get access to MT4 version please click here . This is the exact conversion from TradingView: "Candle body size" by "Syamay". This is a light-load processing indicator. This is a non-repaint indicator. Buffers are available for processing in EAs. All input fields are available. You can message in private chat for further changes you need. Thanks for downloading
FREE
GLEB 시리즈, 버전 1.0. 분 막대를 위한 쉬운 슬라이더 프로그램. 활성 거래 시간을 포함한 많은 설정. 베이 거래를 기반으로 판매 거래를 연결할 수 있습니다. 설명: 1. 전략 스위치: 키 "속도"(켜기/끄기) 2. 트렌드 컨트롤: 섀도우 컨트롤(켜기/끄기) 3. 막대의 추세 제어 깊이: Shdw cntrl에 대한 그림자 높음 4. 스프레드 제어: 스프레드 제어(on/off) 5. 스프레드 리미터: 볼륨 스프레드 제어(포인트) 6. 손절매 자동계산 : SL, TP 자동계산 (on/off) 7. 자동 정지 손실 범위 감소: 정지 손실 범위 감소(on/off) 8. 스톱로스 감소율 : 감소율 SL (1-max, 1.5, 2, ... low) 9. 택이익 감소율 : 감소율 TP (1-max, 1.5, 2, ... low) 10. 태익 자동추적 : AUTO 계속거래(on/off) 11. 손절매 발동 시 매도 개시: SL 손실 - 매도(온/오프)
거래 시스템이 개발 중입니다. 피드
FREE

Very often there are situations when you need to quickly close all open positions or close only under a certain condition...
The Positions Close script closes open positions according to the selected settings.
You can choose to close All positions , only Buy, only Sell
You can also choose by which symbols to close positions: by all symbols or only by the current one, on the chart of which the script was thrown
There is a filter for closing profitable or unprofitable positions, as well a
FREE
The Expert Advisor is recommended for USDCHF M15. It is based on the strategy of "waiting out", the market entry (and exit) points are determined on the basis of correlation of a number of indicators. The trading volume for opening a position depends on results of previous trades. It is possible to limit the amount of risk (the AutoMM parameter). It is also possible to set the maximum spread, above which the EA will automatically suspend trading (the MaxSpread parameter). It also has advanced fe
FREE

This indicator draws a vertical line repeatedly at the set time. The number of lines that can be set can be set arbitrarily. In addition, it is possible to set 4 types of lines. It is possible to change different times, colors, line types, etc. The time can be set to any time in minutes.
In the next version, we plan to display the high and low prices within the setting range.
FREE

Fractals ST Patterns Strategy is a modification of Bill Williams' Fractals indicator. It allows setting any number of bars to find a fractal. This simple indicator corresponds to the parameters specified in the ST Patterns Strategy ( https://stpatterns.com/ ) . Structural Target Patterns are essentially the market itself, which is consistently divided into components. To form ST Patterns , no trend lines, geometric proportions of the model itself, trading volume or open market interest are neede
FREE

hello. The indicator shows the levels of change in the spread per unit of time when its values are higher. Practice shows that the change in volumes is associated with the warning and advance of speculative activity, especially at key moments: Fed news, oil news, speeches by leaders of the IDR countries. We are very happy to present new developments. Thanks.
FREE

이 무료 도구가 마음에 드신다면 별 5개 등급을 남겨주세요! 매우 감사합니다 :) "위험 관리 보조원" 전문가 자문 컬렉션은 다양한 시장 상황에서 위험을 효과적으로 관리함으로써 거래 전략을 향상시키도록 설계된 포괄적인 도구 모음입니다. 이 컬렉션은 평균화, 전환 및 헤징 전문 자문의 세 가지 주요 구성 요소로 구성되며 각각은 다양한 거래 시나리오에 맞는 뚜렷한 이점을 제공합니다.
이 EA는 시장의 표준 위험 관리 전략을 개발한 것입니다.
https://www.mql5.com/en/blogs/post/756961
1. "평균화 도우미" EA: MT4 : https://www.mql5.com/en/market/product/115468 MT5 : https://www.mql5.com/en/market/product/115469 2. "스위칭 어시스턴트" EA : MT4 : https://www.mql5.com/en/market/product/115478 MT5 : https
FREE

Introducing the Server Time Indicator — an indispensable tool for traders seeking precision and efficiency in their MetaTrader 5 platform. Server Time Indicator updates dynamically based on market activity or on every tick to optimize memory and resource usage. In instances where the financial markets are inactive or closed, the indicator will refrain from providing real-time updates to ensure accurate representation of current market conditions. This approach safeguards against any misinterpret
FREE
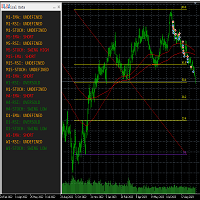
This tool helps to get a quick overview of a market. In one panel, indicators show trend, swing highs/lows and overbought/oversold information of various time frames (M1,M5,M15,H1,H4,D1,W1). Fibonacci can be used to identify different price levels. The input parameters of all indicators can be set by the user. The time frames can be changed as desired. The user can decide for himself which indicators he would like to see in the panel. Fibonacci appears on the chart at the next minute change at t
FREE

Recommended broker to use the indicator: https://tinyurl.com/5ftaha7c Indicator developed by Diogo Sawitzki Cansi to show possible trade points. Do not repaint. The results displayed in the past are exactly what happened. We also use it to hold trades longer and not get out on false reversal signals which are actually just a profit taking of trades and no one is trying to reverse the direction of the trend. Indicator Parameters: PERIOD: Period for analyzing the buying or selling force to fin
FREE

Sends price alerts conveniently to your Android/IOS device. Make sure push notifications are enabled in Metatrader settings and the PC/VPS is online 24/7. Price levels are updated automatically, but you can modify them in global variables, if needed. Suitable for any market instrument, but if notifications are too frequent, increase point value of the indicator parameter.
FREE

The indicator measures and displays the difference in the number of "Bid" and "Ask" prices changes in the form of digital, analog and graphic indicators. Designed for market research and for determine the moments of position closing during scalping trade with H1 or less timeframe. Use with bigger timeframe is not prohibited, but it is not informative because of a large number of accumulated values. Theory
"Bid" and "Ask" prices do not change simultaneously for most symbols. Often you can see h
FREE

The Average Cross System indicator is a versatile tool designed for traders using the MetaTrader 4 (MT4) platform. This indicator provides a straightforward yet effective way to identify potential buy and sell signals based on moving average crossovers, a widely used technical analysis strategy. Key Features: Moving Average Crossovers: The heart of the Average Cross System is the detection of moving average crossovers. It automatically identifies when a shorter-term moving average crosses above
FREE

Highly configurable Rate of Change (ROC) indicator. Features: Highly customizable alert functions (at levels, crosses, direction changes via email, push, sound, popup) Multi timeframe ability Color customization (at levels, crosses, direction changes) Linear interpolation and histogram mode options Works on strategy tester in multi timeframe mode (at weekend without ticks also) Adjustable Levels Parameters:
ROC Timeframe: You can set the current or a higher timeframes for ROC. ROC Bar Shift:
FREE

This EA is named Dinosaur Hunter(DH) because it can capture very large trend, such as 5000-10000 pips. DH trades infrequently as it patiently waits for the right market conditions. DH can load multiple currency pairs on a single chart to increase the number of trades. Live Signal
This is a demo version that only for fixed lot size of 0.01. To obtain the full version, please purchase Dinosaur Hunter Pro . This EA has been tested from 2015 to the present. The test used data from Dukascopy. If
FREE

This is a simple EA Can only open ONE trade EVER then MUST be reattached to the chart everytime you want to use it. Designed to help manual traders Has lot sizes and stops / targets in pips. For a buy trade the engulfing bar must close above the previous red bars high Includes Alarm and Phone notifications
Basically if you find a price zone you like and will take a trade if there is an engulfing bar . use this.
FREE
Please, if you like this AE, I would appreciate it if you could rate it with 5 stars ️ ️ ️ ️ ️ THANK YOU!!
Expert Advisor based on the signal generated by two MACDs (Moving Average Convergence Divergence), which can trade on different time frames (M1, M5, M15, H1, H4, etc.) The Expert has the following variables: >>>>>>>>>>>>>>>>>>> Magic number Slippage >>>>>>>>>>>>>>>>>>> Stop Loss (pips) Take Profit (pips) Trailing Stop (pips) Trailing Step (pips) Money management: Lot o
FREE

The indicator ColorCandlesDaily draw candles with different colors depending on the day of the week.
FREE

Price live on the Chart Description: The Real-Time Price Display is a powerful tool for MetaTrader 5 users that provides continuous updates of the current bid (SELL) and ask (BUY) prices directly on your trading chart. This script is ideal for traders who need to stay updated on market prices at a glance. Key Features: Live Price Updates : Displays the latest bid and ask prices for your selected trading symbol in real-time. Customizable Display : Adjust the horizontal and vertical position of th
FREE

Are you a trend surfer like us? Do you use Moving Averages too? Ever wanted the are between them to be painted? Yeah, we solved this problem with the Filled MAs indicator! It is very simple, just puts two fully customizable Moving Averages on chart and fill the space between them, changing the color as they intersect. Thanks to gmbraz for the version 1.1 idea. Any questions os suggestions please contact me! Enjoy!
This is a free indicator, but it took hours to develop. If you want to pay me a
FREE
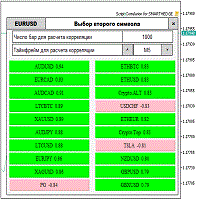
Script for quickly selecting a tool with high correlation. The script is placed on the tool to which you need to select the second correlating one. Then you can change the number of bars to calculate and the timeframe. The script iterates through all available symbols in the market overview and returns the 20 most correlated ones. You can use the selected pairs to trade with THE new SH expert Advisor
FREE

This Expert Advisor will change how you manage your risk forever.
The EA automatically calculates your position size by either looking at your balance or equity. You need simply type in how much risk you want to have on that particular trade, move your TP line and SL line and it does the rest. Click buy or sell and it enters the position and places your TP/SL for you. It does the same thing for pending buy limits or sell stops. Feel confident knowing your risk before entering your trade! Mo
FREE

Price and Spread Indicator
Version: 1.0 Developer: Creative Tech Solutions Website: https://www.creativetechsolutions.co.uk
Overview The Price and Spread Indicator is a great tool for MetaTrader 5 that displays the Ask and Bid prices along with the spread directly on the chart. This indicator provides real-time updates and allows traders to make informed decisions based on accurate price information.
Features - Real-time Price Updates: Continuously updates Ask and Bid prices. - Spread D
FREE

A simple and highly effective Strength and Weakness currency indicator that can be used to aid your fundamental and technical analysis for winning trade decisions.
The indicator is very easy to use and can be applied to all time frames.
FX Tiger uses an advanced algorithm to calculate a score table for all major currencies. Green indicates currency strength and red indicates currency weakness. Once you have identified the strong and weak currencies, pair strong versus weak currencies and co
FREE
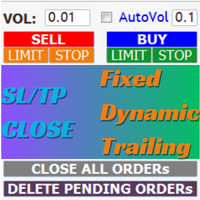
AIP – TradeManagement (Telegram Contact: @AutoInvestorPro) The main functions of Ea TradeManagement 1. General management: o Management based on Symbol, manually orders , orders from the EA, and orders from other EAs o User-friendly trade interface with the ability to drag and drop SL,TP,Entry o Support backtest
2. Stoploss management o Automatic placement of Stoploss based on fixed Pips number o Automatic placement of Stoploss at the highest and lowest price in x ca
FREE

John 14:6 Jesus saith unto him, I am the way , the truth , and the life : no man cometh unto the Father, but by me.
TICK VALUE : Multi-Currency Account Indicator Description: The TICK VALUE : Multi-Currency Account Indicator is a powerful and versatile tool designed for traders looking to streamline their portfolio management across multiple currency pairs. With its robust functionality, this indicator not only provides comprehensive historical profit calculations but also allows f
FREE

Hey guys.
This indicator will show you, in the volume histogram, if the candle was a Doji, a bullish candle, or a bearish candle.
The construction of this indicator was requested by a trader who uses other indicators from my catalog, and I decided to release it free to help traders who think that the indicator can contribute to their operations.
The parameters are:
Volume Type: Real Volume or Tick Volume. Color if the candle is bearish: select the color. Color if the candle is high:
FREE

Ladies and gentlemen, let me explain a simple tool that can help adjust stop-loss positions based on historical data and customized distance. Tool Name: Trailing Stop Pro Description: A trailing stop is a risk management tool commonly used in trading. It allows traders to set a dynamic stop-loss level that automatically adjusts as the price moves in their favor. Here’s how it works: Initial Stop-Loss: When you enter a trade, you set an initial stop-loss level. This is the price at which you’re
FREE

El indicador técnico propuesto es un sistema de medias móviles de múltiples marcos temporales diseñado para ayudar a los operadores del mercado financiero a seguir de cerca los movimientos tendenciales. Al combinar medias móviles de diferentes períodos, este indicador ofrece una visión más completa de la dirección de la tendencia, lo que permite a los traders identificar oportunidades de trading con mayor precisión. Al utilizar este indicador, los operadores pueden maximizar sus ganancias al tom
FREE

Simple indicator used in technical strategies to analyze tops, bottoms and reversal or continuation points. Developer information:
Line values and colors:
Buffer 0 : ZigZag line value;
Buffer 1 : ZigZag color value;
Buffer 2 : Median line value;
Buffer 3 : Median color value; Buffer to get the values of each top and bottom. Buffer 4 : Top value;
Buffer 5 : Bottoms value;
Buffer that returns the type of the last direction.
Buffer 9: 0 = Not updated, 1 = High, -1 = Low;
FREE

Swiss CandleTime What ist CandleTime for This indicaor just displays the remaining time for a candle to build. It is best used if you trade with timframes from 3 minutes. I use it in M3 to keep postions. If I have two following red candles i usually liquidate the position. Timeframes M1 to H1 Inputs Arrow displayed => Edit your arrow string Arrow for waiting conditions => Arrow if chart is offline Text Color => color of the text Tell if there is a trend change => tells you, if the two preciding
FREE

Introducing the "Cybercycle Trend" Forex Oscillator, a powerful technical indicator designed to enhance your trading experience in the foreign exchange market. This innovative tool utilizes advanced algorithms to identify and analyze market trends, providing you with valuable insights and helping you make informed trading decisions.
The Cybercycle Trend Forex Oscillator is specifically designed to detect and measure cyclical price movements in the forex market. By incorporating this oscillato
FREE

The indicator is getting the four most important trading sessions: New York London Sydney
Tokyo The indicator auto calculate the GMT time. The indicator has buffers that can be used to get the current session and the GMT.
You can use it as stand alone indicator and you can turn the draw off and call it from your EA. INPUTS Max Day: Max days back to get/draw. London Session On: Show/Hide London Session. New York Session On: Show/Hide New York Session. Sydney Session On: Show/Hide Sydney Sessi
FREE

차트 링크 보조 도구: 이 도구는 MetaTrader의 열린 차트와 메인 차트의 전문가 간의 인터페이스 역할을 합니다. 많은 다중 타임프레임 전문가들은 이 파일이 화면에 열린 차트와 통신하기 위해 필요합니다. 이 도구를 차트에서 실행하면 메인 차트의 전문가와 차트를 쉽게 연결할 수 있습니다. 이 파일의 주요 기능은 열린 차트에서 발생하는 모든 이벤트를 메인 차트의 전문가에게 보내는 것입니다. 예를 들어, 메인 차트에 가이드라인을 배치해도 이러한 가이드라인의 변경 사항이 메인 패널의 전문가 매개변수에 반영되지 않을 수 있습니다. 이 도구를 차트에 드래그 앤 드롭하거나 실행함으로써 차트를 연결하여 차트에서의 변경 사항이 메인 차트의 전문가에게 전달되도록 할 수 있습니다. 또한 이 도구에는 메인 차트 전문가의 디버거와 상태 확인 기능도 포함되어 있습니다. 메인 차트의 전문가와의 연결이 끊어지면 이 도구는 몇 가지 작업을 수행합니다: 먼저 MetaQuotes ID에 알림을 보내고, Tele
FREE

All in one Multipurpose Telegram Trade Management , Manage and Copy Trades on the go From Telegram Pro Version MT5: www.mql5.com/en/market/product/95742 Pro Version MT4: www.mql5.com/en/market/product/85691
Execute Trades on mobile with fast execution When away from desktop MT5, or scalping the market with mobile device, or needed to copy trades from telegram groups while away, or doing some other activities, Telegram EA Manager is an effective tool to perform any trade operation with swi
FREE

Trend Envelopes indicator is calculated based on a % of price change. That % is then used to determine if there is a new trend or trend remains the same.
This version is using Standard Deviation for the price change calculation instead and is adding prices smoothing prior to be used in calculations. The smoothing can be done using one of the 4 average types:
* Simple Moving Average
* Exponential Moving Average
* Smoothed Moving Average
* Linear Weighted Moving Average
Als
FREE

The Indicator indicator draws 2 clouds based on Bollinger Bands indicator values. The upper cloud is formed by the upper lines values and the lower cloud by the lowers lines values. The indicator allows to change the Bollinger Bands parameters and the clouds colors the period of the base line and the deviations of each Bollinger Bands instance. The indicator holds 5 buffer index as follow: [0] - Outer values of the upper cloud [1] - Inner values of the upper cloud [2] - Base/Center line values
FREE

The Equity Curve indicator is a simple and helpful tool that shows the development of the equity curve in real time. For precision measurement, it should be used in a separate window with a period of M1.
Main features The indicator shows the development of the equity curve in real time. High precision on the minute chart. High-speed calculation. Available for MT4 and MT5. Please visit the Equity Curve indicator product page for the input and output parameters settings.
FREE

Бинарный индикатор находит свечной паттерн "Поглощение" и рисует соответствующий сигнал для входа рынок. Имеет встроенные фильтры и панель для просчета количества успешных сделок. Демо версия является ознакомительной, в ней нет возможности изменять параметры. Полная версия . Особенности Работает для всех валютных пар и любых таймфреймов. Индикатор рассматривает комбинацию из 2-х или 3-х свечей в зависимости от настроек. Имеется возможность фильтровать сигналы путем настройки количества свеч
FREE

SSACD - Singular Spectrum Average Convergence/Divergence This is an analogue of the MACD indicator based on the Caterpillar-SSA ( Singular Spectrum Analysis ) method. Limited version of the SSACD Forecast indicator. Limitations include the set of parameters and their range.
Specificity of the method The Caterpillar-SSA is an effective method to handle non-stationary time series with unknown internal structure. The method allows to find the previously unknown periodicities of the series and mak
FREE

This is a customizable three moving averages indicator useful in crossover trading technique. Yo can set various parameters such as calculation methods (exponential, simple, etc.), period and price type for each MA separately from one input dialog.
Parameters: Period <1,2,3> - Period of a moving average Shift <1,2,3> - Shift of a moving average Method <1,2,3> - Method of calculation for each moving average set separately Applied Price <1,2,3> - Set price type for calculations for each movi
FREE
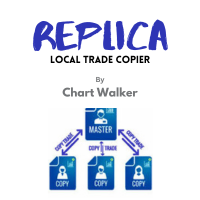
White label available. contact us for more info. dushshantharajkumar@gmail.com Replica Local Trade copier by Chart Walker
Replica, a MetaTrader 5 (MT5) local trade copier, is a powerful tool designed to streamline and automate trading processes for users within the MT5 platform. This innovative software allows traders to replicate trades from one account (master) to another (slave) in real-time, enabling efficient and synchronized trading across multiple accounts. With its user-friendly int
FREE

1. The Expert Adviser is built with a basic, simple and stable breakout trading strategy with a touch of Price Action pattern that is highly effective with over 80% accurate entry on Scalping and Trend following trading pattern. 2. The EA created a good money management system with a low draw down and options for Number of Trades, Auto SL and Auto trade trailing.... 3. The EA has option to select trade direction (BUY ONLY, SELL ONLY OR BUY & SELL). 4. The EA has option to set TP in Pips or Mone
FREE

Blended Candle Strength (BCS)
Any trading strategy, whether it is a continuation, trend reversal or breakout requires, in addition to analyzing the context of the price movement, confirmation signals for both trading entry and exit. And for that, it is necessary to analyze the formats of the candlesticks and fit them in known patterns to assist decision making. In addition to the context and format, two other important information to determine the strength of candlesticks are the size of the ba
FREE

Switch symbols and timeframe by arrow buttons 1. You can switch multiple symbols of one or all charts. 2. You can set list of symbols to switch between them or get them from Market Watch. 3. You can change timeframe of one or all charts. List of timeframes here [M1, M5, M15, M30, H1, H4, D1, W1, MN1]. Switch symbol of all charts: indicator check current symbol of the chart to get index of it in list and change for next or previous. Key functions: - Right arrow key: switch to next symbol. - Left
FREE
MetaTrader 플랫폼 어플리케이션 스토어에서 MetaTrader 마켓에서 트레이딩 로봇을 구매하는 방법에 대해 알아 보십시오.
MQL5.community 결제 시스템은 페이팔, 은행 카드 및 인기 결제 시스템을 통한 거래를 지원합니다. 더 나은 고객 경험을 위해 구입하시기 전에 거래 로봇을 테스트하시는 것을 권장합니다.
트레이딩 기회를 놓치고 있어요:
- 무료 트레이딩 앱
- 복사용 8,000 이상의 시그널
- 금융 시장 개척을 위한 경제 뉴스
등록
로그인
계정이 없으시면, 가입하십시오
MQL5.com 웹사이트에 로그인을 하기 위해 쿠키를 허용하십시오.
브라우저에서 필요한 설정을 활성화하시지 않으면, 로그인할 수 없습니다.