YouTube'dan Mağaza ile ilgili eğitici videoları izleyin
Bir ticaret robotu veya gösterge nasıl satın alınır?
Uzman Danışmanınızı
sanal sunucuda çalıştırın
sanal sunucuda çalıştırın
Satın almadan önce göstergeyi/ticaret robotunu test edin
Mağazada kazanç sağlamak ister misiniz?
Satış için bir ürün nasıl sunulur?
MetaTrader 5 için ücretsiz Uzman Danışmanlar ve göstergeler - 28

Investment Castle Volatility Index has the following features: 1. This indicator shows the volumes of the current symbol and the market volatility. 2. This indicator is built-in in the Investment Castle EA which works as volatility index for the EA dynamic distance and opposite start. 3. Parameters available for optimization for each pairs. 4. Works with any chart.
FREE

Are you having trouble with too many events in the economic calendar? This reduces to the minimum number you need. You can filter by country code importance any key words and you can receive alerts before the set time of the event. ++++++++++++++ If country code is blank, display available code on the expert tab. You need to turn off the automatic calendar update setting in MT5. Any sound file of .wav format in Sounds directory. The length of keyword characters is limited by MT5.
FREE

Product Description: Adaptive Y-Axis Scaling is a powerful MT5 indicator designed to enhance your trading experience by providing precise control over the Y-axis (price) scaling of your charts. This innovative tool allows you to customize the price scaling by specifying the number of pips from the visible chart's highs and lows. The calculated price range from this input is then used to set the maximum and minimum prices for the open chart, ensuring an optimized and comprehensive view of market
FREE

The key to success is always good optimisation.
The system has a number of variables and in this case its simplicity is the key to its success. The system looks for the different "Gaps" as market entry failures and then debugs them through a stochastic analysis, i.e. the analysis of two moving averages to see if the price is overvalued or undervalued, and once this is done, the expert advisor will decide whether to perform an action or refrain from performing it. It is a very simple but power
FREE

1. Bu belgeler sistemi yerel bir belgeler sistemidir, yani gönderici ve alıcı aynı bilgisayarda çalışmalı. Çünkü MT4 / 5 hesabı birçok bilgisayarlar üzerinde aynı and a girebilir, sadece okuyulan hesap parolanı müşteriye göndermelisiniz. Yerel ticaret çok hızlı ve stabil, çünkü bu ağı dahil etmez.
2. Şimdilik alıcı sonu. Çizelgeyi yüklerken, giriş parametrosinde "senderaaccount" değiştirmeniz gerekiyor, başlangıç sonun MT4 / MT5 hesabına normalde çalışmak için. Ayrıca, yayınlama sonunu yüklem
FREE

Seviye Asistan ı, destek ve direnç seviyelerini manuel olarak ayarlamak için uzman bir yardımcıdır.
Tüccarlar genellikle kendi seviyelerini oluştururlar. Farklı dönemlere ait birçok çizelge varsa, seviye tüm çizelgelerle çarpılacaktır.
Bir grafiğe yatay bir çizgi yerleştirirken, Asistan bu çizgiyi bir seviyeye dönüştürmeyi önerir. Aynı zamanda, enstrümanın süresine ve fiyata göre nerede olduğuna bağlı olarak çizginin rengini ve kalınlığını kendisi belirleyecektir. Seviyeyi bir yazıtla işare
FREE

Media Móvel Grátis para uso em conjunto ao Diamond Indicator Atenção. Essa é a mm para conjugar ao indicador. Esse não é o indicador. Comprem o indicador que está tendo ótimos resultados. A seguir informações sobre o indicador: Indicador Para Opções Binarias. Usa dois gales. Instalar em mt5 Esse indicador é para ser usado no tempo de vela de 5 minutos e em M5. Este também funciona em M1, porém é mais eficiente em M5. Só descompactar e copiar os arquivos na pasta de dados do seu MT5. Arquivos
FREE

Overview: The "ATRBBOpener" is a trading robot designed to operate on the GBP/USD currency pair. Tailored for an H1 (one-hour) trading timeframe, this robot is ideal for traders seeking a balanced approach between short-term and medium-term trading strategies.
Technical Indicators Used: Average True Range (ATR): The robot incorporates ATR to measure market volatility and determine stop loss and take profit levels. This indicator helps identify periods of high and low volatility. Bollinger Band
FREE

After purchasing, you can request and receive any two of my products for free!
После покупки вы можете запросить и получить два любых моих продукта бесплатно! The utility is designed for manual placement of pending orders at the high and low of yesterday. The program has a built-in trailing stop, virtual take profit and stop loss. Unworked orders are deleted at the end of the day or manually. You may be interested in my other products: https://www.mql5.com/ru/users/vypchela/seller
Settings
FREE
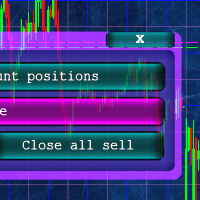
Кнопочная панель для одновременного закрывания большого числа позиций. Всего четыре варианта закрывания: Закрыть все позиции на счёте ( Close all account positions ). Закрыть все позиции по символу графика, на котором находится панель ( Close all positions ). Закрыть все Buy позиции по символу графика, на котором находится панель ( Close all Buy positions ). Закрыть все Sell позиции по символу графика, на котором находится панель ( Close all Sell positions ).
FREE

Smart Lot-Size Calculator And Trade Assistant for Mobile Trading Overview: This is the tool every trader in the market must have no matter if you are scalper, swing traders, day trader, or long term trader. This On-The-Go trading tool will help you stay disciplined and also stay free from daily trade management chores, Most traders face common problems like 1. Calculation of proper lot-size of a position to take controlled risk 2. Managing every trade and trailing stop-loss if trades goes in
FREE

This is a simple EA Can only open ONE trade EVER then MUST be reattached to the chart everytime you want to use it. Designed to help manual traders Has lot sizes and stops / targets in pips. For a buy trade the engulfing bar must close above the previous red bars high Includes Alarm and Phone notifications
Basically if you find a price zone you like and will take a trade if there is an engulfing bar . use this.
FREE
Use Day Trading Tracker to keep a record of your earnings across accounts. This indicator will show a dashboard in the Meta Trader chart to show for the profit or loss money in your account. It’s easy to see just how much money you’re making matched betting with the Forex Trading Profit Tracker. Key features: Track your profit over time Check out your stats. Track expected profits against actual profits. Export account history to Excel. MT4 version: https://www.mql5.com/en/market/product/39113
FREE
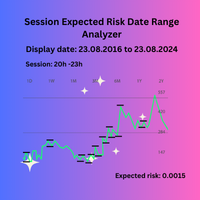
Session Expected Risk Date Range Analyzer: Analyzes price data across specified date ranges to provide detailed insights into financial risk and volatility, using each bar's price metrics for accurate risk assessment.
The Session Expected Risk Date Range Analyzer is a sophisticated tool designed to offer traders and analysts detailed insights into the expected financial risk across specific date ranges. Unlike traditional session-based analysis, this indicator focuses on calculating risk met
FREE

This project did not reach the basic funding number, so I am abandoning it momentarily. The system is now free for other traders to continue the idea. You can follow my new project through my signals.
A tool for institutional investor, now avaliable for Home users. We equip you like banks equip their analysts!
How it works
Focused on the Forex market, it takes advantage of the need of nations to control the value of their currency and the world exchange variations to analyze, through the
FREE

Hyper DM, Moving Distance from Moving Averages is an indicator that allows you to define the distance in points of the upper and lower bands in relation to the moving average in the middle.
Its operation is simple, it has configuration parameters of the moving average of the middle and based on it and the defined distance parameters of the upper and lower bands, it is plotted in the graph.
FREE

A Simple clock that on the left side "Time" shows r espectively the TimeCurrent, followed beneath by the TimeLocal. On the right hand side we have the remaining minutes and seconds of the current candle. TimeLocal is synced every 500 miliseconds however, the TimeCurrent and the time left on the candle are synced every tick, so this can lead to inconsistencies on the readings so keep that in mind.
This indicator have no plots or buffers so it cannot be used in any time based EA.
FREE

This indicator will show the the change of volumes via 2 lines of SMA: . Fast line (default is 5 candles) . Slow line (default is 13 candles) We can use the crossing point of fast line and slow line to know investors are interesting in current price or not. Pay attention: The crossing point is not signal for entry. Absolutely that we must use in combination with other indicators for sure. Parameters: . Fast line periods: the periods (candles) to calculate SMA of fast line . Slow line periods: th
FREE

SI Connect is a utility that establishes the connection to our servers to use FX Volume or the SIEA trading systems.
Technical instructions to prepare your terminal for the usage of SI Connect Allow web requests and insert https://stein.investments to the list of allowed URLs in your Terminal Options -> Subcategory Expert Advisors . You need only one running EA instance per terminal, but it has to run constantly in the background to grab the latest data from our data centre.
In case of quest
FREE

Based on the trend-following principle of CCI, it has been improved to become an indicator that can identify the reversal of the trend and its development direction, that is, it can identify the top and bottom attenuation of the oscillating trend in the trend market. feature The red and green columns represent the trend of bullish or bearish development under the current cycle. The blue line shows the position and attenuation of the current price trend in the current cycle. The upper and lower
FREE

MetaCOT 2 is a set of indicators and specialized utilities for the analysis of the U.S. Commodity Futures Trading Commission reports. Thanks to the reports issued by the Commission, it is possible to analyze the size and direction of the positions of the major market participants, which brings the long-term price prediction accuracy to a new higher-quality level, inaccessible to most traders. These indicators, related to the fundamental analysis, can also be used as an effective long-term filter
FREE

The MWC COX indicator shows the extreme zones of net short/long positions of the Commitments of Traders Report released by the CFTC once a week for four periods of time. Default settings are periods of 12, 26, 52 and 156 weeks.
Additional Features Displays the sum of all 4 periods in one line MA, MOM and RSI indicators are integrated ( not in the MQL5 Version 1.0 ) Please make sure that you download the MWC_Demo.zip file and unpack it into [...]/MQL5/Files folder. -> www.myweeklycot.com/
FREE

Highly configurable Volume indicator.
Features: Highly customizable alert functions (at levels, crosses, direction changes via email, push, sound, popup) Multi timeframe ability Color customization (at levels, crosses, direction changes) Linear interpolation and histogram mode options Works on strategy tester in multi timeframe mode (at weekend without ticks also) Parameters:
Volume Timeframe: You can set the lower/higher timeframes for Volume. Volume Bar Shift: you can set the offset of th
FREE

FRB Sell Agression - Indicator shows the Sell Agression Balance of the TIMEFRAMES chosen by the user through a histogram in a new window. - This indicator can only be used if the broker provides data on Volumes. Forex market brokers do not report this data. - B3 (Bovespa - Brazil) informs the data and with that it is possible to use it in Brazilian brokerages.
Settings Color - Define the color that will be shown in the histogram. Use Historical Data - Defines whether the indicator will calc
FREE
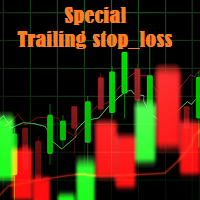
Special Trailing Sl is a automatic trailing stop_loss. first It will try to free risk your trade then save the profits. first step is to move the SL 50 points below current price for long trades , and 50 points above current price for short trades.First step will happen when the trade get to minimum profit per point. second step : SL will follow the current price with a dynamic distance. This trailing stoploss has been used in my products.
FREE

The UJ_H1_170100007_S_OD_CF_SQX is an algorithmic trading strategy for MetaTrader, tested on USDJPY using the H1 timeframe from April 1, 2004, to April 24, 2024. There is no need to set up parameters, all settings are already optimized and fine-tuned.
Recommended broker RoboForex because of EET timezone.
You can find the strategy source code for StrategyQuant at the link: http://quantmonitor.net/listing/usdjpy-osma-impulse/
Key details are:
Parameters
MagicNumber: 170100007
Main
FREE

Hey guys.
This indicator will show you, in the volume histogram, if the candle was a Doji, a bullish candle, or a bearish candle.
The construction of this indicator was requested by a trader who uses other indicators from my catalog, and I decided to release it free to help traders who think that the indicator can contribute to their operations.
The parameters are:
Volume Type: Real Volume or Tick Volume. Color if the candle is bearish: select the color. Color if the candle is high:
FREE

Live Monitoring: https://www.mql5.com/en/signals/2252642 Quant ML JP225 is a bot tailored for instruments related to the Tokyo / Nikkei index, operating on the H1 timeframe. This bot is created and validated using machine learning algorithms, with a focus on maintaining strategy stability. It: Utilizes only market entries with fixed ATR-based SL and TP levels. Does not employ trailing stops, breakevens, martingale, grid, or adding additional positions when the initial position is in the red
FREE

Bill Williams'ın angülasyonla tersine çevrilmiş sapkın barı. Yeşil çizgi ile çubuğun üstü / alt kısmı arasındaki açı, temelde Justin Williams'ın güncellenmiş yönergelerine uygun olarak köşe olarak kullanılır. Timsah Dudak çizgisinin kesiştiği andan itibaren 85 ve 21 bar açısının varsayılan ayarları oldukça iyi çalışıyor. Bu göstergeyi gerçek ticarette kullanırsanız - gün içinde ticaret yapmanızı şiddetle tavsiye etmiyorum, günlük grafikleri kullanın.
Sinyal EURUSD, US500, BTCUSD ve DE40'DA te
FREE

This is a demo version of a non-trading expert , which utilizes so called the custom symbols feature ( available in MQL as well ) to build renko charts based on historical quotes of selected standard symbol and to refresh renko in real-time according to new ticks. Also it translates real ticks to the renko charts, which allows other EAs and indicators to trade and analyze renko. Place the EA on a chart of a working instrument. The lesser timeframe of the source chart is, the more precise resulti
FREE

Have you ever wanted to back-test a strategy but never wanted to risk real money? And the thought of using a demo account is exhausting as real time markets develop your skills slowly. This utility will help you develop your strategy faster and will help determine if the strategy works long-term by simulating real trading through back-tests. This will save you time as you can back-test strategies from previous price data. With the new update you can now change your lot-size add take-profit and
FREE

backtester buttons for testing strategies in the MT5 strategy tester.
load up strategy tester then click on visual test and once visual tester opened apply any chart template you'd like. To update the chart pause the visual tester and apply templates, colors and such like the normal chart. On the settings you can choose lot size and take profit and stop loss.
Enjoy
FREE

This is an ordinary MACD indicator displayed in the main window according to the selected chart style, i.e. Bars, Candlesticks or Line. When you switch the chart type, the indicator display also changes. Unfortunately I could not improve the chart type switching speed. After switching, there are delays before the arrival of a new tick.
The indicator parameters Fast EMA period Slow EMA period Signal SMA period Applied price
FREE

ADR ST Patterns Strategy is a modification of the classical ADR indicator. This simple indicator corresponds to the parameters specified in the ST Patterns Strategy ( https://stpatterns.com/ ) . Structural Target Patterns represents the market consistently divided into components. No trend lines, geometric proportions of the model itself, trading volume, or open market interest are needed for the formation of ST Patterns . They are easily recognized and built only on the basis of breaking
FREE

The Complex Chaos EA is an automated system that uses a pair of exponential moving averages to detect the market direction and opens trades on candle open. If the market moves against a trade it will at a set distance open another trade in the same direction to move the take profit of the group of open positions closer to the current price and make the group of trades winners overall once the price reverses. If a change in direction is detected then all trades are closed and it starts trading in
FREE

FRB Trader - Our mission is to provide the best support for our clients through content and tools, so they can achieve their expected result. - If you have any questions or suggestions, please contact us. Your feedback is very important to us.
FRB Buy Agression
The indicator displays the Buy Aggression Balance of the selected TIMEFRAME through a histogram in a new window. This indicator can only be used if the broker provides data on volumes. In the forex market, most brokers do not provide
FREE

Real Time Binance Futures Ticks Data ve Real Time Binance Spot Ticks Data çalışması için yardımcı programdır. Daha hızlı data çekmek ve Binance Future sınırlarında kalmak için tasarlandı. Çalışma mantığı: Binance Check Server Time'dan aldığı zaman bilgisini Global Variables kaydeder. Diğer programlarda Bu zaman bilgisini kulalanarak daha hızlı ve performanslı işlerini yaparlar.
Araçlar menüsü >> Seçenekler >> Uzman Danışmanlardan WebRequest'e izin vermeli ve URL'yi eklemelisiniz: https://fap
FREE
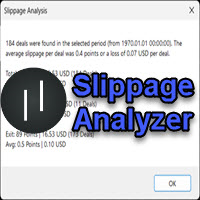
If you are using scalping strategies (or any strategy that uses stop orders for position opening or closing) you need to know your slippage. Slippage is the difference between your pending order price and the price that your brokers uses to execute your order. This can be really different and depends on the broker as well as on the market conditions (news, trading hours, etc..) With this small script you can calculate the slippage you "paid" in points and also in your account currency. You also
FREE

XFChart simplifies trading strategies with customizable options for informed decision-making across various styles, from scalping to position trading.
1. Risk Management: - XFChart offers automatic breakeven and trailing stop features to protect profits and reduce emotional decisions. - Auto Breakeven is disabled by default and can be enabled through the indicator properties window. - The "Auto Trailing Stop Loss" adjusts the stop loss based on market movement, facilitating profit loc
FREE

You can use this tool to create as many pending orders (limit order) as you want in one button press. All inputs must be in points. You can use this useful tool when such as FED speech times. User Inputs:
MagicNumber = Magic number DeviationPoint = Deviation point number for limit orders Level = You can choise how many level do you want to create pending orders. BuyOrder = true/false SellOrder = true/false StartDistance = Distance between each level. StepDistance = Distance to be added incremen
FREE

Trend Market Catcher MT5 is a powerful tool developed to assist traders in identifying and capturing profitable market movements. This expert advisor leverages advanced algorithms and sophisticated indicators to analyze price patterns, detect trends, and generate precise trading signals. With Trend Market Catcher, you can say goodbye to guesswork and emotional decision-making. It employs a systematic approach, meticulously scanning the market to identify favorable trading opportunities. By focus
FREE

El indicador técnico Non Lag MA (Non-Lagged Moving Average) es una variante de la media móvil que busca reducir el retraso inherente a las medias móviles tradicionales.
Pros: - Menos retraso: Al estar diseñado para reducir el retraso, el Non Lag MA puede proporcionar señales más rápidas que las medias móviles tradicionales. - Tendencias claras: Las líneas del Non Lag MA muestran claramente las tendencias alcistas y bajistas, lo que facilita la interpretación de la dirección del mercado. - Per
FREE

Ladies and gentlemen, let me explain a simple tool that can help adjust stop-loss positions based on historical data and customized distance. Tool Name: Trailing Stop Pro Description: A trailing stop is a risk management tool commonly used in trading. It allows traders to set a dynamic stop-loss level that automatically adjusts as the price moves in their favor. Here’s how it works: Initial Stop-Loss: When you enter a trade, you set an initial stop-loss level. This is the price at which you’re
FREE

This indicator solves the problem of chart scaling where the bar becomes too thin and it becomes difficult to determine the bar's open and close prices.
Thick Bar indicator - allows you to change the thickness of the lines and the color of the stroke, due to which you can get a thicker bar on the chart. The default indicator has a bar thickness of 2 and preset colors that can be changed in the settings
FREE

Simple candle countdown - never again miss how much time is left to open a new bar!
This indicator doesn't plot any line on the chart - it uses only objects and calculates the time left to open a new bar.
You can set custom colors for the panel background and border and for the text color. Simple as that, the indicator is ready to use.
If you find any bugs, feel free to contact me.
FREE

O Indicador foi desenvolvido para a bolsa Brasileira, identificando a relação do Índice com a soma dos principais ativos do IBOV, também funciona para qualquer mercado do mund o, possui um oscilador WPR com a soma dos principais ativos escolhidos, indicando a antecipação do movimento em relação ao Índice. Características WPR com a soma dos papéis escolhidos - branco WPR do papel atual - vermelho Canal de Tendência O indicador pode indicar movimento de entradas, sendo: cruzamento das linhas cruz
FREE

Blended Candle Strength (BCS)
Any trading strategy, whether it is a continuation, trend reversal or breakout requires, in addition to analyzing the context of the price movement, confirmation signals for both trading entry and exit. And for that, it is necessary to analyze the formats of the candlesticks and fit them in known patterns to assist decision making. In addition to the context and format, two other important information to determine the strength of candlesticks are the size of the ba
FREE
TradeFlow Dashboard MT5, Meta Trader 5 platformunda risk yönetimi stratejilerinizi geliştirmek ve karar almayı kolaylaştırmak için tasarlanmış sağlam ve çok yönlü bir çözüm sunarak ticaret yönetiminde bir paradigma değişimini temsil eder. Şık ve kullanıcı dostu arayüzü ile bu araç, özellikle performanslarını artırmak isteyen manüel yatırımcılara hitap ederek, geleneksel ticaret deneyimini aşmaktadır.
Her özelliğin kusursuz ve güçlendirilmiş bir ticaret deneyimine nasıl katkıda bulunduğunu keş
FREE

This Expert Advisor will change how you manage your risk forever.
The EA automatically calculates your position size by either looking at your balance or equity. You need simply type in how much risk you want to have on that particular trade, move your TP line and SL line and it does the rest. Click buy or sell and it enters the position and places your TP/SL for you. It does the same thing for pending buy limits or sell stops. Feel confident knowing your risk before entering your trade! Mo
FREE

Session Average Date Range: Analyze and average the low - high of specific trading sessions within custom date ranges, offering insights into price movements and market behavior over selected periods. The "Session Average Date Range" tool is an advanced analytical utility designed to empower traders and analysts by allowing them to dissect and evaluate the high and low range of specific trading sessions within a user-defined date range. This tool provides a flexible and precise approach to analy
FREE

The purpose of the remaining time indicator on the K-line is to assist traders in gaining a deeper understanding of market dynamics and making more precise trading decisions, particularly in the realm of forex and binary short-term trading. The significance of this indicator and its application to various trading strategies will be thoroughly examined below: Enhancement of Trading Timing Accuracy - Precision: By displaying the remaining time of the current K-line cycle, traders can achieve great
FREE

Описание стратегии:
Набор торгуемых валютных пар: GBPUSD, GBPAUD, GBPCAD, GBPJPY, EURUSD, EURGBP, EURAUD, EURCAD, EURJPY, AUDUSD, AUDNZD, AUDCAD, AUDJPY, NZDUSD, NZDCAD, USDCAD, USDJPY
В момент открытия рынка после выходных, определяется на каких парах из списка цена прошла от открытия до закрытия недельной свечи более 2000 пунктов и открываем позицию в противоход недельному движению с целью забрать откат в 500 пунктов. Стоп не ставится.
Если цена пошла против позиции, то через кажды
FREE

Are you tired of erasing the objects on chart and then having to put them back in? What if you had a tool that would allow you to hide and show all objects any time? Cool, huh? That is why I developed this tool as an indicator. With it you hide all objects using a shortcut button on chart or the keyboard (customizable). If you have any suggestions or find a bug, please, contact us. Enjoy!
FREE

This system is a semi- automatic trend following system that operates during the days of highest probable market volatility aiming to capitalize on major retracements and reversals that occur midweek. It can operate on full autopilot, act as just a signal generator, or any customized user preference based on the needs of the user and the functionality of the program. It is capable of risk management with an inbuilt lot size calculator with adjustable risk pecentage to suit the user's unique apet
FREE

Transaction Data Analysis Assistant: This is a statistical analysis tool for transaction data, and there are many data charts for analysis and reference. language: Support language selection switch (currently supports Chinese and English active recognition without manual selection) The main window shows: Balance display Total profit and loss display Now the position profit and loss amount is displayed Now the position profit and loss ratio is displayed The total order volume, total lot size, and
FREE
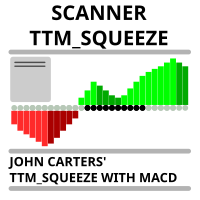
Market scanner based on the indicator published here Download the 'John Carters TTM Squeeze with MACD' Technical Indicator for MetaTrader 5 in MetaTrader Market (mql5.com) . Only the instruments that are in the Market Watch window are scanned. Maximum number of scanning tools up to 5000. The scan timeframe is selected from the timeframe panel of the terminal. To use it, open any chart and attach the Expert Advisor to the chart, the 'Search' button will appear in the upper left corner. When you
FREE

The SSD With Histogram is a custom forex indicator for Metatrader 5 that shows a slow stochastic line, a signal line, and a histogram that reflects the difference between the slow line and the signal line. The indicator and its elements are displayed in a separate window just below your main trading chart.
parameters: k period; 5 D period; 3 time frame: m1 m5 m15 m30 h1 d1
FREE

This indicator is based on the MACD indicator
Also, some candlestick patterns are used in it to identify better signals
Can be used in all symbols
Can be used in all time frames
Easy to use method
Adequate settings
Settings: period: The number of candles used to calculate signals. pFast: Like the MACD indicator settings pSlow: Like the MACD indicator settings
alarmShow: If you want to receive an alert in Metatrader after receiving the signal, enable this setting alarmShowNoti: If you
FREE

Great dashboard for market analytics. Help you to analyze the values of the Moving Average indicator and prices.
Using this dashboard you can: find signals from the Moving Average from all timeframes; find signals from the Moving Average from all symbols; check - how far the Moving Average is from the price; check - the Moving Average value has changed; 2 types of signal.
Modes of operation (switched by a button on the graph): current value of Moving Average; the difference between the cu
FREE
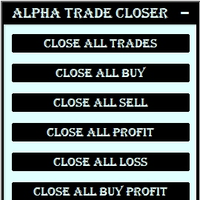
This Utility is created to close Open Trades on the go by filters.
If you want any custom feature or want to remove something from this product for your personal use. Please send me a personal message, I'll be happy to do so for you.
Buttons & their Tasks :
CLOSE ALL TRADES : Close all open trades CLOSE ALL BUY : Close all Buy trades CLOSE ALL SELL : Close all Sell trades CLOSE ALL PROFIT : Close all trades that in Profit CLOSE ALL LOSS
FREE

The Market Thermometer can be used to help traders identify sleepy or turbulent periods.
It helps beginners to check when is the ideal time to enter operations, that is, when the value of the thermometer is below its average for several periods, identifying a peaceful market. When the market is heated, that is, the thermometer is above three times its average, it is time to make profits. The Thermometer measures the extent to which the end of a period, maximum or minimum price, projects outsi
FREE
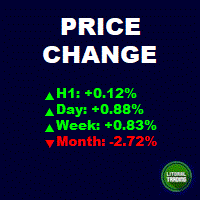
This is an informant indicator, very simple. It shows how much the price has chanded in percentage in certain period (month, week, day and actual period). It is discreet and small, does not visually posslute the chart. If your MT is not on portuguese idiom the indicator will automatically change to english. Check out our most complete tool for the market, the Trade Panel: https://www.mql5.com/en/market/product/42658 If you have any suggestion or find any bug, please, contact us. Enjoy!
This i
FREE

BinaWin NoTouch is an indicator that sends an alert signal when the trade is in the right position to wait for the breakdown of a side market.
It is specially designed to trade under the “No Touch” strategy of the Binary.Com platform with synthetic indexes N.10, N.25, N.50, N.75 and N.100
Similarly, trading can be done with the conventional CALL and PUT strategy of any Binary Options platform.
Requirements to use the indicator:
1. Have an account at Binary.Com
2. Configure the Binary.
FREE
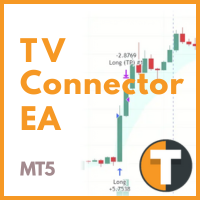
The Tickerly TV Connector allows seamless integration between TradingView strategies and your MT5 terminal. With this tool, you can automate trade execution by linking TradingView’s powerful scripting environment to your MetaTrader Terminal.
Features include fast trade execution via Tickerly’s engine and easy setup using webhooks. This EA is perfect for traders who want to deploy custom TradingView strategies on MT5, keeping their terminals in sync with real-time market conditions.
Requires mi
FREE

La **Media Móvil de Tercera Generación (TGMMA)** es una versión avanzada del indicador estándar de **Media Móvil (MA)**. Fue descrita por primera vez por Manfred G. Dürschner en su artículo "Gleitende Durchschnitte 3.0" (en alemán). Aquí están las características clave de la TGMMA:
1. **Reducción del Retraso**: - A diferencia de las MAs tradicionales, la TGMMA reduce significativamente el retraso. Se adapta más rápidamente a los cambios de precios, lo que la hace ideal para traders que bus
FREE

What is this indicator? This indicator is the Stochastic Oscillator supporting Virtual Trading mode of Knots Compositor . When the mode is turned on, the indicator will be recalculated based on the displayed candlesticks. When the mode is turned off, the indicator will be recalculated based on the original chart candlesticks.
KC-Indicators - KC-MA (Moving Average) - KC-ENV (Envelopes) - KC-BB (Bollinger Bands) - KC-ADX (Average Directional Movement Index) - KC-MACD (Mo
FREE

Signal Anywhere is an advanced version of Panel Anywhere , featuring an additional panel called Signal panel. This panel allows you to copy trades from a Signal Anywhere Provider to a Signal Anywhere Subscriber seamlessly. With Signal Anywhere , you can view market symbols and copy signals simultaneously without the need to switch between Expert Advisors (EAs). Features of the Signal panel: Local and internet-based trade copying Searchable, request, and acceptance functionalities Support for mu
FREE

The indicator based on Bollinger Bands parameters determines the bar's position and displays the value in the indicator window.
When a bar closes below the lower Bollinger Bands line, the indicator value becomes negative.
In such a case, one can expect an imminent market reversal and an upward movement.
When a bar closes above the upper Bollinger Bands line, the indicator value becomes greater than 1.
In such a case, one can expect an imminent market reversal and a downward movement.
It
FREE

candlestick time it a useful indicator ,it help to keep you alert with the candlestick time ,how far to be completed at the chosen period , it help to keep you patience which is a biggest thing that holds trades down ,try it to improve you way of trading. it work on any broker any time frame and any symbol. you can customize the color on input. it can work on multiple timeframe. Thank you !
FREE

Sentiment Liner This is a steroidised Daily-Weakly-Monthly high-low and open, must have indicator. With this stuff user can determine the average of (daily-weakly-montly) open levels. 4 example: if you in day mode switch the average to 5, you get the 5 day sentiment. In weakly mode turn the average to 4, than you get the 4 weak sentiment,...so on. Naturally one can us as a simple day-week-month high and low indikator. S1: high S2: low Pivot: open, Average: averager
FREE
MetaTrader Mağazanın neden ticaret stratejileri ve teknik göstergeler satmak için en iyi platform olduğunu biliyor musunuz? Reklam veya yazılım korumasına gerek yok, ödeme sorunları yok. Her şey MetaTrader Mağazada sağlanmaktadır.
Ticaret fırsatlarını kaçırıyorsunuz:
- Ücretsiz ticaret uygulamaları
- İşlem kopyalama için 8.000'den fazla sinyal
- Finansal piyasaları keşfetmek için ekonomik haberler
Kayıt
Giriş yap
Gizlilik ve Veri Koruma Politikasını ve MQL5.com Kullanım Şartlarını kabul edersiniz
Hesabınız yoksa, lütfen kaydolun
MQL5.com web sitesine giriş yapmak için çerezlerin kullanımına izin vermelisiniz.
Lütfen tarayıcınızda gerekli ayarı etkinleştirin, aksi takdirde giriş yapamazsınız.