MetaTrader 4용 Expert Advisor 및 지표 - 75
This indicator displays in the form of an oscillator the difference between the maximum/minimum prices for the current period of time and the maximum/minimum price for a longer period. An increase in indicator values above zero indicates that the maximum price for the current period is greater than the maximum price for the period selected as an indicator parameter. This situation in most cases indicates an increase in the value of the asset. A drop in indicator values below zero indicates t
FREE

CloseProfit is a utility created to automate the process of setting a stop-loss and closing orders when a certain percentage of profit is reached.
The utility also has two Buy and Sell buttons on the chart for opening orders.
The utility can be used to close orders opened by other advisors, with a stop-loss or a percentage of the increase in the deposit. To do this, you need to set in the settings a magic number that matches the one that is installed in the advisor when opening a transactio
FREE

This indicator shows in a subwindow the trend in M1, M5, H1, D1 timeframes based on MA, MACD, Stochastic This way you could see in once in different timeframes what happening. This is my first free indicator. Please follow I will put here some more. Thank you for you attention. . . . . .
lfknglkslksnlgslgnsflgjrpoesv ,msv lkrjpfjésmdg sd.npo4wsmdglknsp4jwpkeégmfs.lkmp Thank you
FREE
"Visual Range - Spread Indicator". This Indicator is an Essential Tool for Manual trading. it helps to avoid "off price" and "bad" entries caused by abnormally High spreads. ...................................................................................................................... At the Market Opening and News Reports - the Size of the Spread can go temporarily widely High. The Indicator shows the current Size of the Spread visually on the chart and its distance from the current pr
FREE
This tool helps you to analyze the market more easily without spending much time and with the help of this tool, by collecting the best technical analysis indicators and simple design and signal extraction tools from the available indicators. Necessary indicators are added to the tool and at the appropriate time, it issues a buy and sell signal to the trader.
FREE

Utility for order reversal. Closes orders on the chart on which it is launched and opens orders with the opposite direction instead of them. Has a simple and intuitive graphical interface. It is also possible to automatically reverse newly opened orders. MT5 version of the utility - https://www.mql5.com/en/market/product/74770 If you like this utility, take a look at my other products - https://www.mql5.com/en/users/nina_yermolenko/seller
FREE

AR Canada Standard is a fully automated Expert Advisor optimized for trading USDCAD H1. The Expert Advisor DOES NOT use hedging, martingale, grid strategies, arbitrage, etc. It uses a trading algorithm based on the intersection of two moving averages for analyzing the market conditions. The Take Profit and Stop Loss values are fixed and have a ratio of 1 to 3,6. The EA closes positions when Take Profit or Stop Loss are reached. Risk management is a key concept in Forex trading. This EA allows se
FREE

The Netsrac Correlation Trade Indicator (NCTI) was created to trade correlations between different assets. NCTI offers five different strategies to do this. Five different correlation trading strategies with two or three assets Fast access your assets with one click via asset buttons Your profit/loss at a glance Configurable alerts via screen or mobile You can use the indicator with every timeframe. Higher timeframes give fewer but better signals. If you have some questions or suggestions - plea
FREE
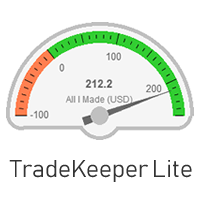
The utility TradeKeeper Lite can show your profits for different periods and bip a sound when you reach a profit target value. Click the tachometer to quickly switch to the next profit period. There are 5 of them: This Day, This Week, This Month, Last 90 Days and All I Made. With the utility TradeKeeper Pro , available at this link , you can also open trades with a magic number and volume of your choice, trail any orders with a simple trail or iSAR-based trail, as well as close any open trades a
FREE

The Night Lottery EA is a fully automated Expert Advisor that trades at night and relies on price reversion. The EA trades using market orders and uses time averaging to improve performance. This EA works best on EURUSD, AUDNZD and USDCHF using the M5 timeframe, defaults are for EURUSD. A VPS is advisable when trading this system. Check the comments for back test results and optimized settings. Any questions message me - https://www.mql5.com/en/users/robots4forex View More Products - https://www
FREE
"All in One" Expert Advisor. The EA collects information from different signals (listed below) on the selected timeframes. Each signal has its own weight. The weight of all signals is summed. If the total weight of signals for a timeframe is greater than the minimum weight, a deal is opened. Operation on each selected timeframe is performed independently. After that, the deal is managed according to the Money Management conditions.
It can work simultaneously on: up to 6 periods; up to 31 popul
FREE

Financial freedom with realistic mindset
New product by COSMOS4U
ADXPivot NZDUSD
The needs of the average investor for financial freedom by using reliable and realistic products are greater than eve
FREE
The utility is designed to detect positive swaps. Description If you are Swing Trader and your positions are open a few days to a few weeks, would be very helpful to know which Currency Swaps are positive. Even if you are a Scalping strategy supporter, would be very helpful to know a day of the week to charge 3 days swap rollover. The SwapDetector will help you to decide to hold or close a position to earn some extra income.
SwapDetector performs the draw objects function, please do not use it
FREE

Stairs Storm EA works on the principle of increasing the trading volume in a trend movement. The Expert Advisor must set SL and TP. Every day we try to improve the work of our advisor, therefore, over time, it will only get better.
Stairs Storm shows excellent results in the tester for 5 years, not a single month in the red. Average profit from 10 to 50% per month.
Recommendations
We recommend placing the EA on ECN accounts, 5 digits.
Currency pair EURUSD
Time frame M5, H1 Min.
FREE
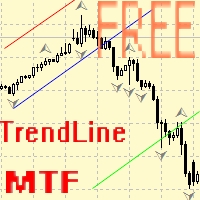
Советник для ручного построения трендовых линий и сопутствующих им стоплоссам и тейкпрофитам. После построения, советник запоминает уровни, направление и лот. При касании текущей цены с расчетной ценой, открывается ордер с заранее выбранными параметрами. Возможно построение и запоминание до 10 разнонаправленных уровней с разных таймфреймов. Можно использовать на любом торговом инструменте. Корректно работает с 4 и 5-значными ценами.
FREE
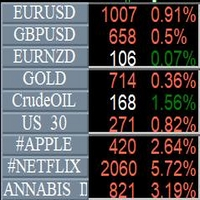
Info Symbol is an indicator that will allow you to monitor up to 9 different markets. Just enter the name of the symbols and the number of decimal places. With a single click you can switch from one market to another, it will take two clicks for a chart with an expert attached to it. With this indicator, you will know how many points or pips that the monitored markets have gained or lost since the beginning of the day and you will also have the percentage.
FREE

Sends price alerts conveniently to your Android/IOS device. Make sure push notifications are enabled in Metatrader settings and the PC/VPS is online 24/7. Price levels are updated automatically, but you can modify them in global variables, if needed. Suitable for any market instrument, but if notifications are too frequent, increase point value of the indicator parameter.
FREE

This reliable, professional trade copier system is without a doubt one of the best on the market, it is able to copy trades at very fast speeds from one master account (sender) to one or multiple slave accounts (receivers). The system works very fast and mimics the master account a full 100%. So changing stop losses, take profits, pending orders on the master account is executed on the slave accounts too, like each other action. It is a 100% full copy (unlike many other copiers who only copy mar
FREE
PERIOD SEPARATOR ------------------------------------------------------------------------------------ Simple and unobtrusive utility for displaying weeks, days and hours Options to control the display of separator lines and labels allow you to customize them to your own taste Display of the separator lines either only in the main chart, or across any indicator windows Automatically reduce intensity of less relevant separator lines and labels for the chart‘s current magnification
Feedback and
FREE

WONNFX create arrow tester. Сonstructor/Tester. Tester for buffer indicators. Converting a buffer indicator into an arrow signal on the chart. Combining two buffer indicators into one arrow signal. Filter by candle color. You can move the arrow signal several bars forward (useful in cases where the indicator gives signals 2-3 bars late
"WONNFX create arrow tester" is a tool designed specifically for traders who use buffer indicators in their trading strategies. This tester converts the buffer
FREE
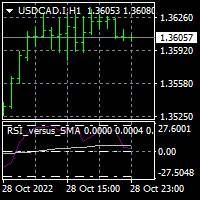
To download MT5 version please click here . This is the exact conversion from TradingView: "RSI versus SMA" By "JayRogers". This indicator lets you read the buffers for all Lines on chart. Note: This is an indicator, Not an expert. Meaning It does not take trades. If you want the EA please contact via message. You can easily use the indicator to understand the logic behind trades that the TradingView strategy takes. The strategy is profitable if this indicator is applied to the right symbol at
FREE

This is an implementation of the market cycle indicator described by Raghee Horner in the book "Forex Trading for Maximum Profit" . The current state of the market can be determined by analyzing the inclination angle of the exponential moving average (EMA) running on a period of 34 bars. If the EMA inclination is defined as the direction of the hour hand on the dial from 12 to 2 hours, then an uptrend is considered to be present; from 2 to 4 hours, the market consolidates; from 4 to 6 hours, a d
FREE

APriceChannel is a modification of the standard Price_Channel indicator. The EA draws 2 levels - the upper level shows the price High for the specified period of time, the lower level shows the price Low for the same period. In addition to the period, you can set vertical offset in points to widen the channel up and down. This prevents false breakouts of current support/resistance levels.
Inputs Period - time period in bars - the number of bars to calculate the price High/Low. Offset up and do
FREE

This indicator shows the value of returns in the selected time frame .
They are calculated as logarithm of returns , rather than price or raw returns. For small returns, arithmetic and logarithmic returns will be similar. The benefit of using returns, versus prices, is normalization. It is possible measures all variables in a comparable metric despite originating from price series of unequal values.
Inputs You can display data both as a Histogram or a Line It's also possible to display
FREE

EA BUMAN may not have a high frequency of entries, but it can provide stable profits. The entry logic is quite simple. It only uses one moving average line.
It enters trades when the candlestick crosses the Exponential Moving Average (EMA) line. If the closing price of the candlestick is above the moving average line, a BUY entry is executed. If it is below the moving average line, a SELL entry is executed.
To increase the profit-taking win rate, it is important to effectively use the Brea
FREE

This is a free version of the Dmytriyx Impulse Expert Advisor. The Expert Advisor analyzes the current price dynamics when it deviates from the average value. Uses pending orders in the impulse direction, at a fixed distance, then moves the pending order in the direction of correction. You can configure the number of pending orders to be placed in the signal direction - the distance between the pending orders is LevelDist , the lot value of each new order is equal to a half of the previous one (
FREE
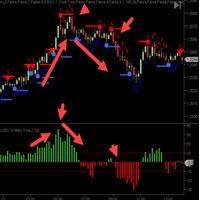
The C ycleTraderPro Close Strength Value Indicator measures the distance from the OPEN of a new bar to the CLOSE of that bar. Input - length = 10 default We add these values together going back the the length setting. If the 1st bar was plus 10 ticks and then the next bar was minus 7 ticks, then this would register +3
There are 2 ways to trade Close Strength Value: 1. Trading in the direction of lower highs and lower lows and vice versa for buys, higher highs, and higher lows. 2. Trade when th
FREE

iCC in iMA is indicator to change color in iMA if iCCI crosses level up (up trend) or crosses level down (down trend). It is a useful tool to track when the upside and the downside iCCI on iMA.
You can to get source code from here .
Parameters MA_Periods —Period for iMA. MA_Method — Method for iMA. CCI_Periods —Period for iCCI. CCI_ApliedPrice — Price used for iCCI. CCI_LevelsUp — Level iCCI for up trend. CCI_LevelsDN — Level iCCI for down trend. BarsCount — How many bars will show the line.
FREE
EA is based on Parabolic SAR and MACD indicator. if there are loss EA try to recover loss and fix position by placing another bigger order. Please test in strategy tester and let me know your feedback Suitable for Beginners No complex settings Just use EURUSD M5 time frame YOU CAN CONTACT ME FOR OPTIMIZATION Please leave the comment your like or dislike I will be happy to answer all kind of query related to this product... Please check in strategy tester and comment like or d
FREE

Trades Viewer Free supports EURUSD only. Trades Viewer is a trading helper app for a serious trader. It offers several important data like day range, 22 days average range and predefined PL. It draws trades history and current open positions on a chart. It has a detail panel for viewing a particular trade with just a click on that trade. All these make it very convenient and straightforward to view your entry/exit positions and thus improve your trading system. Features Profit/loss of the curren
FREE
The presented indicator colors the chart candles in accordance with the data of the Hull Momentum AM indicator. Coloring of candlesticks depends not only on the location of the oscillator histogram above or below zero. The location of the histogram relative to the signal line is also important. The indicator is part of a series of indicators - Hull Line AM, Hull Momentum AM, Hull Candles AM, Hull Signal AM . For a better understanding of the operation of each of the indicators, it is recommended
FREE

The current Rise and Fall is judged from the Commodity Channel Index (CCI) of the three cycles and displayed in a panel by color coding.
The second and third of the three cycles are changed according to the correction factor multiplied by the first cycle (minimum cycle).
In addition, each CCI is displayed with ATR (Average True Range) corrected for variation.
When two of the three CCI are complete, Trend_1 is displayed. When all three are complete, Trend_2 is displayed.
// ---
Sq

This indicator softens the value of the RSI (Relative Strength Index) and reduces its volatility. You can use this indicator in your expert advisors, indicators and strategies. With this indicator, you don't need to have two indicators on the chart at the same time. For example, an RSI indicator and a Moving Average indicator If you have any questions or concerns, contact me.
FREE

EZT Bollinger Trendline
Indicator based on multiple settings of Bollinger Band. In the menu you can choose the similar settings than bollinger band indicator. Trend period and trend deviations. Also paint and arrow on chart when direction change. Three different kind of alert , such as pop up, e-mail and push notification. Try different settings on different timeframes.
Please help my work and rate and comment my products!
FREE
Добрый День, Всем. Решил выложить свой индикатор, предложить на просмотр. Я трейдер, Вадим Сергеевич Лепехо. Индикатор не стандартный, сделан не по канонам. Индикатор рисует маржинальные зоны на графике, пока полет нормальный. Но строит зоны по индикатору AO(Awesom) конкретней по фрактальным зонам индикатора AO. Зоны стандартные 1/4, 1/4, и НКЗ. Пример привожу по EURUSD + в картинках. На данный момент 14.10.23 - нкз=1920 пипсов(192 пункта) предлагаю преобразить до 192пипсов(19.8пунктов). Поясняю
FREE

This Indicator is based on Mr. Dan Valcu ideas.
Bodies of candles(open-close) are the main component used to indicate and assess trend direction, strength, and reversals.
The indicator measures difference between Heikin Ashi close and open.
Measuring the height of candle bodies leads to extreme values that point to trend slowdowns. Thus quantifies Heikin Ashi to get earlier signals.
I used this indicator on Heiken Ashi charts but, it's possible to choose to calculate Body size based on
FREE
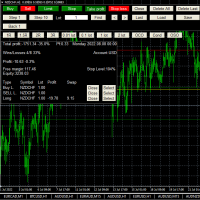
This is a simplified version of Advanced Trade Simulator for trying it out. You can trade NZDCHF. With the full version, you can trade anything and no time limit. You can find it here: https://www.mql5.com/en/market/product/61670 Description... It is an indicator you can attach to any chart and then buy and sell the given symbol virtually. No actual trading takes place. You can attach it to multiple charts. Then you can buy/sell multiple symbols. Features:
- buy and sell immediately on the giv
FREE
Switch symbols and timeframe by arrow buttons 1. You can switch multiple symbols of one or all charts. 2. You can set list of symbols to switch between them or get them from Market Watch. 3. You can change timeframe of one or all charts. List of timeframes here [M1, M5, M15, M30, H1, H4, D1, W1, MN1]. Switch symbol of all charts: indicator check current symbol of the chart to get index of it in list and change for next or previous. Key functions: - Right arrow key: switch to next symbol. - Left
FREE
This indicator displays RVI indicator signals on the chart. The main point of Relative Vigor Index Technical Indicator (RVI) is that on the bull market the closing price is, as a rule, higher, than the opening price. It is the other way round on the bear market. So the idea behind Relative Vigor Index is that the vigor, or energy, of the move is thus established by where the prices end up at the close. To normalize the index to the daily trading range, divide the change of price by the maximum r
FREE

EasyTrend AM is an indicator that allows you to open a position at the very beginning of a significant price movement. The second most important quality of the indicator is the ability to follow the trend as long as possible in order to obtain all potential profits while minimizing potential losses. This indicator does not repaint or not recalculate. A version of this indicator with advanced settings and signal notifications is EasyTrend 3 AM .
Signal of the indicator: red arrow appearing abov
FREE
As we know, МТ4 and МТ5 do not store tick history, which may be necessary to develop trading strategies and market analysis. I have developed a method allowing you to receive tick history very easily. The indicator gathers tick history in real time and writes it to XXXXXX2.hst file, where XXXXXX is a symbol name. This file can be used to create an offline chart or something else. If you use a trading robot, then launch the indicator and control your broker by examining the spread and quotes. All
FREE
This indicator displays signals on the price chart when the closing price crosses the standard moving average line, as well as when the moving average changes its direction. The indicator does not redraw. Signals are shown on fully formed candles. The indicator can send notifications of its signals to the terminal and email. Custom Parameters: MA_Period - moving average period; MA_Shift - moving average shift relative to the price chart; MA_Price - price for which the moving average is calculat
FREE
Download your broker's detailed spread data into a simple CSV file When choosing a broker, it is important to choose one that offers the right spreads for you. Ideally, we choose a broker with the lowest spreads. However, a broker will only advertise either the lowest spread they offer, or the average spread. The reality of spread is that it can vary massively and depends on the currency pair, the time of day or the volatility of the market at a given point in time. Some EAs are more sensitive
FREE
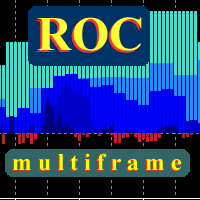
This is a true Price Rate-of-Change multi-timeframe indicator. It shows the charts of various timeframes in a single window converting them to the time scale used to perform trades. You are able to select both higher and lower timeframes, as well as change the main trading timeframe. You will always see all the lines of the indicator on the right scale. Two color scheme variants are available: with color change when crossing zero, and without. You can also define the data display style (lines or

Introduction
This indicator alerts you when certain price levels are reached. The alert can be on an intrabar basis or on a closing price basis. It will also send alerts when one forms, including via e-mail or push notification to your phone . It's ideal for when you want to be notified of a price level being reached but don't want to have to sit in front of your chart all day.
Input Parameters
DoAlert: if set to true a desktop pop-up alert will appear from your MetaTrader terminal whe

At the very least, this indicator is able to entertain you. It builds a moving line based on interpolation by a polynomial of 1-4 powers and/or a function consisting of a sum of 1-5 sine curves. Various combinations are possible, for example, a sum of three sine curves about a second order parabola. The resulting line can be extrapolated by any of the specified functions and for various distances both as a single point at each indicator step (unchangeable line), and as a specified (re-painted) f

The Expert Advisor follows Puria trading method. RSI is used for sorting out signals. Also, the EA implements the averaging function.
Trading strategy Three Moving Average (МА) indicators combined with Moving Averages Convergence/Divergence (MACD) provide market entry signals . Sell as soon as First MA crosses Second MA and Third MA below and confirmation from MACD arrives (one bar has closed below the zero level). The Relative Strength Index (RSI) indicator is used as the signal filter . If R

Professional Trend Indicator Ti indicator is based on its own oscillator and shows you trend changes .
Indicator includes adjustable Polynomial and MAs channels , Trend lines and Oscillator filter with whom you can adjust the spread of indicator.
You can run many instances, for all time frames at once, is very fast and has a built-in " slider history testing " technology and “ Error control ”.
Program operates in 2 automatic modes:
1. Slider mode
Turns on when attaching the indicator to th

Fractals Trailing Stop is a tool that implements trailing of the stop loss order after the price based on the Fractals by Bill Williams. The utility provides all the necessary parameters for customization, which allows to select the optimal configuration for any user. The EA allows to choose the trailing line depending on the type of the trade. For example, buy trades can be trailed based on the downward fractals, and sell trades can be trailed based on the upwards fractals. The Magic parameter
RSTL dpl AM - (Referense slow trend line - detrended price line) indicator built on the principle of searching for discrepancies between the current real price and the calculated trend value. RSTL - a digital filter that calculates the reference line, the overcoming of which by the current price is considered a change in the long-term trend. Indicator signals: Small red dot - the price continues to fall; Small blue dot - the price continues to rise; Big red dot - the price starts to fall; Big bl
FREE

The Choppy Market Index (CMI) is an indicator of market volatility. The smaller the value of the indicator, the more unstable the market. It calculates the difference between the closing of the last bar and a bar n periods ago and then divides that value by the difference between the highest high and lowest low of these bars.
Features Easily separate trends from the market noise The indicator is non-repainting. Returns CMI values through buffer. (see below)
Inputs Period: The number of perio
FREE

This simple EA closes old losing trades at the expense of a portion of your profits. This helps to slowly work away drawdown and accelerate the closure of martingale grids
*** New Features *** Added - Option to close oldest or furthest from current price trades Added - Calculation of profits that will be sacrificed.
Anyone who has traded with martingale knows that you can get trapped in grids and be hoping for a quicker recovery. This led me to create this EA with the goal of helping t
FREE
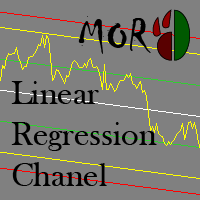
This indicator is designed for plotting the linear regression channel. For convenience, it has multiple operation modes and drawing of data from the selected timeframe.
Input parameters Price - the price to be used for calculation and plotting the upper and lower boundaries of the channel PriceHighLow - the value of bar's High and Low PriceOpenClose - the value of bar's Open and Close Mode - indicator operation mode Static - the linear regression channel is always plotted starting from BarStar
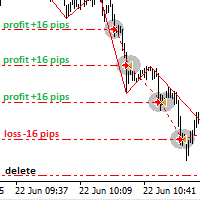
Hunter on the channel breakout Bot
The Expert Advisor places the necessary amount of BuyStop and SellStop pending orders with predefined StopLoss and TakeProfit levels at the specified time daily. The EA calculates the channel width using the ZigZag indicator and sets a grid of BuyStop and SellStop pending orders according to the specified settings. The first pair of BuyStop and SellStop pending orders is placed at a predetermined distance from the channel borders. The distance is set in the pe

Общие сведения Для начала торговли достаточно небольшого депозита. Подходит для разгона депозита. Подходит для мульти-валютной торговли. Не зависим от качества соединения и торговых условий.
Принцип работы
Эксперт открывает ордера по встроенному индикатору. Если прибыль ордера плюсовая. Данный ордер закрывается и открывается новый в противоположном направлении объёмом Lot . Если прибыль ордера минусовая. Данный ордер закрывается и открывается новый в этом же направлении и объёмом в Marting
FREE

The difference between the arithmetic and geometric means at the specified range. Since the greater is the difference between the values, the greater the resulting figure is, actually the indicator shows volatility fluctuations. The arithmetic mean of a certain number of values is the sum of the values divided by their number. The geometric mean is the root of the power of the number of values extracted from the product of these values. If all values are equal, the arithmetic mean and th
FREE
This script permits to delete the pending orders or close the market positions on platform. Very simple to use. Upload the script on the chart and the script will done the work for you following the input values.
An utility to manage very quickly your trading.
Input Values TypeOrders Only BUY (delete or close only BUY) Only SELL (delete or close only SELL) BUY and SELL (delete or close ALL) Type Positions (close only market orders) Only STOP (delete STOP pending orders) Only LIMIT (delete LI
FREE

A new interpretation of the classical indicator in the form of an oscillator for a more accurate representation of the situation on the market. Less lagging than the standard Alligator. All settings are fully accessible, such as the type and prices for which it is built. Thanks to the additional parameters, it became possible to fine tune.
Distinctive features Does not redraw. Additional parameters for fine tuning. Works on all timeframes and symbols. Suitable for manual trading and developm
FREE
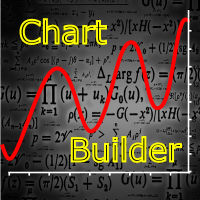
The indicator is designed for easy construction of synthetic charts based on data of various financial instruments. It will be useful both arbitrage and pair trading, as well as for analysis purposes. Its main advantage is simplicity and clarity. Each chart is given as a common mathematical formula. For example, if you want to plot the spread (difference) between EURUSD and GBPUSD with coefficients 4 and 3, then set the following formula: EURUSD * 4 - GBPUSD * 3 The resulting chart is shown in t

Indicator with the function of catching trees should pinbar of all time frames 1. PinBar identification indicator for multi timeframe. 2. Function backtest of PinBar candlestick patterns 3. Announcements on MT4 / MT5 and on mobile phones Please watch my movie on youtube for instructions. S ubscribe my channel for free indicator. https://youtu.be/gIONGgBMqW8
#KIDsEA #indicator #Pinbar #priceaction #mt4 #mt5
FREE
BOSSTESTER (Binary Option Super System Tester) indicator is a simple tester for BOSS binary options trading system. Its objective is constructing a balance line on history data during CALL and PUT transactions performed by BOSS trading system. The tester requires at least 50 bars in history.
Inputs Initial Balance - initial balance. Investment Rate - investment rate. Losses Cover Ratio - loss coverage ratio. Payout - payout in %. Loss - loss in %. Trading Style - trading style: Super_Conservat
FREE

A scrolling Market Ticker that displays price changes from all symbols in the Market Watch list. Provides an easy snapshot of symbol prices, and keeps scrolling automatically while you trade and analyse the chart.
Options include: - MTF, eg choose to show price changes of the daily chart, or the hourly - use the live candle or the recently completed - font and background coloring
FREE

PL Graph Visualizer는 계정의 손익을 실시간 그래프로 표시하는 유틸리티입니다.
그래프는 통화쌍별, 매직넘버별로 별도로 볼 수 있어 각 포지션의 손익 변화를 한눈에 볼 수 있습니다. 이 도구는 여기에서 찾을 수 있는 통합 결제 도구와 함께 사용하여 기능을 더욱 향상시킬 수 있습니다.
https://www.mql5.com/en/market/product/116884
실시간 그래프는 계좌의 총 손익뿐만 아니라 여러 통화쌍의 손익 상태도 표시하여 거래자가 세부 변경 사항을 즉시 파악하고 의사 결정을 돕고 거래를 보다 효과적으로 만들 수 있습니다.
실시간 손익 가시성을 통해 거래 전략을 강화하세요.
이 도구는 실시간으로 차트를 생성하므로 차트를 닫거나 기간을 변경하거나 MT4를 다시 시작하면 최신 데이터에서 차트가 다시 생성됩니다.
더 자세한 정보:
https://www.mql5.com/en/blogs/post/757410
FREE

Price Difference 표시기는 시가와 종가의 차이를 보여줍니다. 별도의 창에 표시되는 표시는 현재 막대의 시가와 이전 막대의 종가 간의 차이입니다. 왼쪽 상단의 보드는 현재 막대의 시가와 종가의 차이입니다.
설정 Count_Bars - 표시기 데이터를 표시할 막대 수, 0에서는 사용 가능한 모든 막대에 표시됩니다. 표시 - 디지털 값 표시를 활성화합니다. _fontsize - 별도의 창에 있는 표시기의 글꼴 크기. color_up - 별도의 창에 있는 표시기에 대한 양수 값의 색상. color_dn - 별도의 창에 있는 표시기에 대한 음수 값의 색상. color_txt - 스코어보드의 마침표 이름 색상. _angle - 별도의 창에서 표시기에 대한 텍스트의 경사 각도. 0 - 별도의 창에서 표시기에 대한 텍스트의 자동 증가.
FREE

The indicator shows when every market session starts and finishes in colored frame box. It includes the Stop Hunt Boxes which shows pockets of liquidity, found at places where traders put their stop losses on existing positions. Contains EMA crossover alert on 50 EMA , 200 EMA and 800 EMA . It can be used in many Forex strategies and for easier observe of the chart.
Indicator parameters NumberOfDays - period of drawing the frames, default is 50 days; Draw_asian_box - draw the box of Asian ses
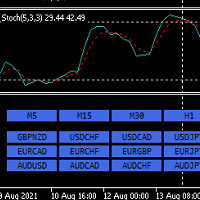
안녕하세요. 12point입니다.
인디케이터가 손쉽게 원하는 통화차트로 변경해줍니다. 굳이 듀얼모니터 사용하실 필요없습니다. 창 두개 띄어놓고도 변경가능합니다.
이건 무료 버전이고, 무료 버전에는 메이져 통화들만 적용됩니다. ( AUDUSD,EURUSD,GBPUSD,USDCHF,USDCAD,USDJPY,NZDUSD)
유료 버전에는 원하시는 통화,지수 및 금 처럼 추가하셔서 목록을 만드실수있습니다.
풀버전:
https://www.mql5.com/en/market/product/71176?source=Site+Market+MT4+Indicator+New+Rating005
원하시는 타임프레임도 변경가능합니다.
통화는 무조건 Market Watch 목록에 활성화가 되어있어야합니다. 그래야 정상작동이 되요.
파라미터 값:
ratio - 사이즈 조절 LineNumber - 각 라인당 몇개의 통화버튼을 지정할것인가 입니다.
감사합니
FREE

Are you an intraday trader or do you want to close your open positions at a certain time each day? Problems with the time zone? use our tools and after specifying the time we will close the order for you.
How to use it:
1) Just insert our tools into your chart.
2) Enable auto trading
3) Expert Options enter TIMECLOSE (time to close operations)
If you need more information, do not hesitate to contact us privately.
FREE

ClosureMaster Utility closes all orders and offers 7 additional modes. If you have dozens or even hundreds of orders and need to close them all or some of them selectively by comment, magic number, buy only, sell only, if Stop Loss is not set, only profitable or losing trades, then ClosureMaster Utility can take care of this task.
External parameters:
Close all Losing trades Close all Profitable trades Close all orders without Stop Loss Close Buy orders only Close Sell orders only Close by Mag
FREE
This indicator is to be used in bot connectors for automation of Pct Multi indicator entries.
How to use: Configure the bot connector with the following information: Indicator name: pctmultibot Call buffer: 0 Put buffer: 1
Do not add this indicator to the chart, just configure it in the bot connector!
Pct Multi indicator:
https://www.mql5.com/en/market/product/73054
FREE
Всем привет. И снова, я, Вадим Сергеевич Лепехо, трейдер(частный) опыт 20 лет около. Forex в основном. Предлагаю Вам оценить, протестировать, опробовать индикатор. И дать свою оценку, заключение, РЕЗЮМЕ....)))). Итак, как он работает. Очень прост в понимании. Алгоритм такой. Индикатор на графике(chart) рисует кружки снизу сверху, разных цветов. Ждем когда появится на фоне одних красных кружков 1, 2, ну на крайняк 3 кружка зеленого цвета и + обязательно должен появится следом опять кружок красног
FREE
MetaTrader 마켓은 MetaTrader 플랫폼용 애플리케이션을 구입할 수 있는 편리하고 안전한 환경을 제공합니다. Strategy Tester의 테스트를 위해 터미널에서 Expert Advisor 및 인디케이터의 무료 데모 버전을 다운로드하십시오.
MQL5.community 결제 시스템을 이용해 성능을 모니터링하고 원하는 제품에 대해 결제할 수 있도록 다양한 모드로 애플리케이션을 테스트할 수 있습니다.
트레이딩 기회를 놓치고 있어요:
- 무료 트레이딩 앱
- 복사용 8,000 이상의 시그널
- 금융 시장 개척을 위한 경제 뉴스
등록
로그인
계정이 없으시면, 가입하십시오
MQL5.com 웹사이트에 로그인을 하기 위해 쿠키를 허용하십시오.
브라우저에서 필요한 설정을 활성화하시지 않으면, 로그인할 수 없습니다.