MetaTrader 4용 Expert Advisor 및 지표 - 71

Summary This indicator is based on the MA applied to the Momentum indicator. It draws arrows at the confirmed crosses of the MA over the Momentum line. When the MA crosses upwards, then a buy arrow is displayed and vice versa. The arrows do not repaint since the indicator only uses confirmed values and waits for the candle to close before painting an arrow. The indicator is also able to alert when arrows appear. There are 3 types of alerts - Popup, Email and Mobile Push Notifications.
Inputs Al
FREE

Why do you need this script? If you place lots of orders and re-calculate your risk for every order you placed, you definitely need such a script. This script places one or (optional) two different orders with the following script inputs.
Utility parameters Operation Type - "Buy","Sell","Buylimit","Selllimit","Buystop","Sellstop" Price - Entry price of the order(s). Stop Loss - Stop Loss of the order(s). Take Profit 1 - Take Profit of the first order. Take Profit 2 - Take Profit of the second o
FREE

It is a very simple and useful micro indicator. Shows the current ask price, and the maximum relative ask price up to the current moment, on the chart, in the first N candles. It facilitates quick decision making by offering a visual reference. Likewise, when we position ourselves with the cursor over it, it shows us the maximum spread since the indicator is applied, until the current moment. It is perfect for scalping . By default, the parameter N has the value 4.
Especially recommended indi
FREE

Indicator Description This is a one-of-a-kind indicator. It predicts future bars using the theory of cyclical behavior of prices and certain market stationarity. This indicator will help you predict 1 or more future bars, thus providing a picture of the possible development of the market situation. It is based on 5 prediction methods. The first method is the Fourier transform, while the other ones are represented by different variations of linear prediction methods. You can select which method w
FREE

Megatrends Indicator Time Frame: Suitable for any time frame. Purpose: Trend Prediction. Blue and red color indicate the buy and sell call respectively. Buy: When the blue line is originating it is opened buy call. Sell: When the Red line is origination it is opened sell call Happy trade!! this indicator is suitable for all time frame, but our recommended time frame to use 1hour and 4 hours, suitable for any chart.
FREE

Indicator for fast navigation through financial instruments. When you click on the button, you go to the chart of the financial instrument, the name of which was written on the button. In other words, the indicator opens or unfolds an existing chart window. For each chart, you can customize the name of the financial instrument, text color and background color; in total, you can customize symbols buttons that you trade often. The indicator can be installed on any charts for which you need to swit
FREE

Th3Eng Bird Scalper is simple scalper, Many expert traders recommend using it with big accounts with a low lot size. It opens positions based on Analyses.
next new version:: Add news filter Add more filters
Requirements::
Account Balance: 5000$ minimum Spread: Not more than 30 points (3.0 pips). Account type: any account (standard, micro and cent). Platform Digits: Pentagonal platform (five digits symbol price and three on yen symbols X.XXXXX on EURUSD NOT X.XXXX).
Best Setups: EURUSD, 15M E
FREE

Who needs this tool? 1-If you are a Martingale Trader, You need to look at this tool
2-If you are a Trend price channel Trader, you need to look at this tool Smarty Semi Automated EA This tool is a great help for scalpers who use grid or martingale. It is a next-generation smart trading tool. You adjust its trading parameter then you push a button to do all trading for you. However, it is a semi-automated EA so It does not start orders by its own. How it is working? The tool was designed to
FREE

Free Scalping is a comprehensive manual system developed for the most efficient trading at any market conditions and time scale.
The system is based on two main blocks:
1. The block of trend determination that calculates dynamic support and resistance. The function of auto-optimization is available for this block.
2. The block of price deviation from its median based on the big set of regressions to get the statistically-valid result. Entry rules For buys:
1. The trend goes up
2. The price i
FREE

EUR INDEX
The Currency Index Project is ONE part of a thorough Forex study. Many people do not know the theoretical basis that drives currency exchange rates to move on the market. With this set of tools you will be able to have a more complete view of the entire market by analyzing not only the single currency of an exchange, but all the exchange rates that make up that currency by looking at a single window!
The indicator faithfully represents the real index of a single currency present in a
FREE

What is The Waiter ?
It is an automated system to always be ready to catch the big movements of the market
How does it work?
Set the mode (stop or limit) Set the pending orders distance Set Take Profit / Stop Loss Wait for the big candle
settings:
entry : 0.OFF (the expert advisor won't operate. only for chart info purposes.) 1.New candle, new STOP orders (each new candle two stop orders are placed. If they are not activated by the end of the candle, they will be cancelled) 2.New candle, ne
FREE

Price Difference 표시기는 시가와 종가의 차이를 보여줍니다. 별도의 창에 표시되는 표시는 현재 막대의 시가와 이전 막대의 종가 간의 차이입니다. 왼쪽 상단의 보드는 현재 막대의 시가와 종가의 차이입니다.
설정 Count_Bars - 표시기 데이터를 표시할 막대 수, 0에서는 사용 가능한 모든 막대에 표시됩니다. 표시 - 디지털 값 표시를 활성화합니다. _fontsize - 별도의 창에 있는 표시기의 글꼴 크기. color_up - 별도의 창에 있는 표시기에 대한 양수 값의 색상. color_dn - 별도의 창에 있는 표시기에 대한 음수 값의 색상. color_txt - 스코어보드의 마침표 이름 색상. _angle - 별도의 창에서 표시기에 대한 텍스트의 경사 각도. 0 - 별도의 창에서 표시기에 대한 텍스트의 자동 증가.
FREE

Price Action Breakout is one of the most popular trading strategy. This Price Action Breakout indicator is designed using several indicators combined to be one strategy. It is very useful for traders that trade based on the breakout strategy. It will make it easier to identify the support and resistance levels. This Price action indicator will draw the support and resistance levels on the chart, so it will make it easier to identify the support and resistance levels. It will inform about the sup

This is a Demo version of PipsFactoryInd it is works only NZD/USD but full version is works on all currency pair.
This indicator is a collection of three indicators, it is 3 in 1: PipsFactoryDaily Click Here PipsFactoryWeekly Click Here PipsFactoryMonthly Click Here
This indicator depends on High and Low price of currency in the (Last day / Last week / Last Month) depends on user input, and then I made some secret equations to draw 10 lines.
Features:
You will know what exactly price you shoul
FREE

https://www.mql5.com/zh/signals/717987
EA transaction presentation:VPS IP:106.75.245.71 ACC:Taolishen Pass:qq2356692354 About author
I think there are huge risks in transactions without EA. Because fear or greed will make us lose our best trading position. However, if the EA does not have the ability to judge, this EA may put us at greater risk.
About EA EA is aimed at two different currency pairs, such as USDJPY and EURJPY, according to the different speed of their rise and fall, they are t
FREE

MerkaStudent is a basic version of an expert advisor that allows us to understand part of the behavior of a chart in historical time.
It uses some basic parameters in trading, which allows us to understand mathematically how a chart moves and thus know what is our mathematical expectation in the historical period analyzed. Starting from a mathematical logic, we can create a strategy to evaluate its results.
FREE

Timezone Filter EA: Precision Trading with Session Control The Timezone Filter EA is an essential tool for traders looking to refine their trading strategy by restricting trade execution to specific trading sessions. Designed for precision and discipline, this EA allows traders to filter which trading sessions they want to engage in—such as Asian, London, or New York sessions —while ensuring that no trades occur outside the defined time periods. Key Features: Customizable Trading
FREE
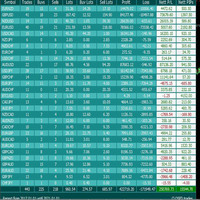
For more info, questions and problems join to discord.gg/reitakfx
Very informative and detailed tool for your account. - pairs, number of trades, lot size, profit, lose, nett p/l, net pips - profit growth chart
Instalation : - open chart and delete every other indicator on it - put this report on chart
Setting : - magic number - filters (comment, symbols, currencies) - date (today, week, month custom) - Start / End date (this is for custom date) - report type (open - only active trades wi
FREE

The trading panel (EA) is intended for the fast and convenient closing of orders in the MetaTrader 4 terminal. It is a trader's assistant allowing to automate routine actions. The "Close" button closes all orders on the symbol of the chart, on which the EA is running. The "Close all" button closes all orders (on all symbols) which are open in the terminal. The EA does not work with pending orders. If closing fails, the EA displays the full error information on the screen. Also the EA shows the t

Script for quickly determining the time offset of your broker's server relative to GMT. For correct operation in the strategy tester, many Expert Advisors require GMT time to be entered in the settings for the terminal where testing is being performed. Developers are forced to enter the GMT offset for testing separately, as such functions are not provided in the tester. This script can help quickly determine the time offset in your terminal relative to GMT.
Parameters Day light saving time for
FREE

https://www.mql5.com/en/users/earobotkk/seller#products FIBO ARROW This indicator draws a Fibonacci Retracement based on daily time frame. It draws arrows, sends pop-up alert and phone notification whenever price crosses Fibonacci levels. This tool is useful for users who trade with Fibonacci. INPUT ON Alert: set to true will pop-up alert whenever arrow appears. ON Push: set to true will send phone notification whenever arrow appears. ===== FIBO(High & Low)===== Time Frame: Fibonacci is drawn f
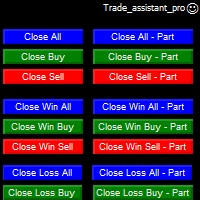
Trade Assistant helps in order management. Just run EA, set up your settings and open a store. EA automatically set = Target Profit, Stop Loss, Trailing Stop / Break Even, Close Trade after + "X" pips (Volume Size "X"%), Delete Pending Orders After "X" Seconds. See the buttons on the chart. He works to close trade, close partialli trade and delete orders
parameters: Set button - close partially (close all part) Volume Size "X"% More settings Enable / Disable Target Profit Target profit Enable

Smart and simple Indicator based on wolves waves reversal pattern also near to falling and rising wedge and butterfly patterns with Stoploss and entry signal preferred time frame M30 : with parameters bars count used for calculation = 200 and moving average for accuracy = 100; you can try it for other higher or lower parameters and try your own set of inputs higher timeframe = lower input !!! important note ::: Indicator don't back draw when first installed on Chart
once installed wait for new

Crazy Dancing moving RES/SUP Levels Automatic redrawing of moving Supports and resistances levels to indicate price breaking supports (signal SELL) or breaking resistance levels (signal BUY) Very simple appearing indicator but very clever and smart too !!!! Main Inputs: # of bars for the support and resistances levels + the initial shift from start + moving average for filter signaling Smaller values for bars /shift inputs when using Higher Time frames (D1-H4) and the reverse higher values for
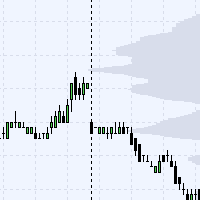
This indicator is showing level's density prices on background's graph.
Theses levels are showing the prices that are the most traded by the market. This means that these levels can be used in order to place stoploss or takeprofit for swing orders, or for scalping manually in short time periods. This gives a statistical advantage as these levels are more likelely to be reached or pullbacked by the market. It is also usefull on VIX for example to determine when to enter local low volatility.
T

I decided to list it for free. Combined Informer of DeMarker with RSI MTF. Each parameter can be change values in menu. it is good for scalping or for weekly trading and looks as universal fx-toy. Now I use it for BTC, ETH, BNB. In menu you can turn on daily percentage gain info, weekly and monthly gains also included as informers. Short ATR helps to determine when price was slow/stopped and entry for pulse pump/dump. The filter of numbers of RSI can be tuned for overbought/oversold values w
FREE

The combination of manual trades and EA trades maximize the profit as well as conserve the capital in this product. Position sizing is always considered seriously in all trades. The drawdown maybe relatively high in initial phase as the starting capital is kept low for beginners to copy comfortably. Give yourself a trial on this product and you will appreciate and set your mind at ease.
FREE

Trend easy простой трендовый индикатор в виде гистограмы. окно индикатора разделено на две части верхняя гистограма движение в бай, нижняя гистограма движениие в сел. Кроме гистограмы, сигнал индикатора дублируется на графике стрелками. В меню индикатора имеется количество баров в истории индикатора
значения периода для определения тренда разрешение рисования стрелок на графике код и цвета стрелок алерты и отступ стрелок
FREE
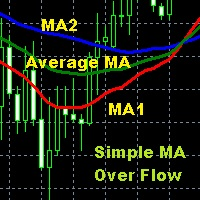
Moving Average is one of the indicators that is widely used in technical analysis which can help to smooth price movements by eliminating some price fluctuations that are less relevant based on past price calculations, so that an average line of price movements is formed within a certain time period. Simple Moving Average Over Flow is an indicator writen by MQL$ language that is given a special additional moving average line based on certain calculations so as to make this moving average better
FREE

This free tool is more reliable and user friendly to use Please give five star if you feel the tool is helpful Lot size positioning is the important risk management rule The larger the lot, the more risk you're exposed to. Smaller lot sizes are often favored by traders who want to manage risk more conservatively.
A general rule of thumb is to risk no more than 1-2% of their account on each trade. Traders need to determine their risk tolerance for each trade. This will help them decide how muc
FREE

This indicator displays the historical bid and ask prices on the chart. This is an extremely useful tool for watching the spread rise and fall, as well as watching to see whether or not the bid and ask prices are converging or diverging. This tool will allow you to enter the market at just the right time. This indicator will help you stay out of the market when the spread begins to rise and help you get into the market as the spread begins to fall again.
ON SALE FOR FREE, GET IT FREE FOR A LIMI
FREE
Индикатор RSI magic kjuta.
Пользовательский Индикатор ( RSI magic kjuta ) на основе стандартного Индикатора Силы ( Relative Strength Index, RSI ) с дополнительными настройками и функциями. К стандартной линии RSI добавлены линии максимального и минимального значения RSI на графике. Теперь можно визуально наблюдать прошедшие максимумы и минимумы RSI , а не только значения по закрытию баров, что позволяет избежать путаницы при анализе торгов. Например, советник открыл или закрыл ордер, но на

MARTINGALE & HEDGING https://www.mql5.com/en/users/earobotkk/seller#products
MARTINGALE & HEDGING is a fully automated EA that uses martingale and hedging strategy. This expert is designed to make quick profit as fast as possible. INPUTS Trade Comment: user comment Magic No: unique EA Number Time Frame: default is H1 Lot: lot size. Take Profit: value in pips. Max Spread: EA will not open new order if spread is more than maximum spread allowed. Multiplier: lot multiplier. Pip Step: distance in

This is a multi-timeframe (MTF) indicator displaying support and resistance lines. Support and Resistance lines are calculating automatically from three higher timeframes (TF). Traders may use Support and Resistance to enter positions and update a Stop Loss value.
Input Parameters bPeriod - use this parameter to optimize indicators for each timeframe; VisibleBars - for how many Bars (from the current one) the indicator's lines will be visible. Any changes are possible.
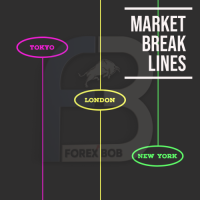
Market Break Lines is an utility tool to create a partition line at market openings/closings of Tokyo/London/NewYork sessions. This will help you to compare the market movements, volatility variations between the different markets.
Inputs: Inputs are simple to feed the time of Tokyo/London/NewYork sessions as per your broker server time Change Color and width of partition lines You can enable or disable any line (Hide/Show).
Please don't forget to support by giving handsome reviews/rating MT5
FREE

Emini Trade Panel
Price - Launch Promotion: FREE - Normal Price: $50
Symbol Recommended - S&P 500 Index
Timeframe - 5 minutes
Main features - Click Button on Chart. - Auto StopLoss Mode: Previous Bar Setting - Trailing Stop ON/OFF - Active Time To Highlight Setting - Color Scheme Selection - Show Profit/Loss Label
EA Ideas - A Successful Professional Trader scalping 1 Point and use Price Action Stops. - Trade very small. The smallest you possibly can trade. - Take a look for Swing trades a
FREE

At the very least, this indicator is able to entertain you. It builds a moving line based on interpolation by a polynomial of 1-4 powers and/or a function consisting of a sum of 1-5 sine curves. Various combinations are possible, for example, a sum of three sine curves about a second order parabola. The resulting line can be extrapolated by any of the specified functions and for various distances both as a single point at each indicator step (unchangeable line), and as a specified (re-painted) f

The indicator searches for matches in history for a specified range of the latest known oscillated Moving Average data.
Found matches are indicated on the graph as colored fields. Analysis of historical data (the behavior of quotes in history) will help make decisions in trading.
The matches found are updated when a new bar is opened (i.e., the calculation is performed upon opening prices).
The value of the increase accuracy (Accuracy) must be changed with a decrease in the timeframe, and de
FREE

Индикатор реализован для определения классического канала движения цены, который используется на крупных биржевых площадках. Не перерисовывается Синий уровень - это уровень поддержки Красный уровень - это уровень сопротивления Белый уровень - является Pivot-уровнем Настройки Period_SEC - ввод значения периода . Примечание: Индикатор определяет уровни только на пятизначных котировках! Метод торговли: Открытие позиций осуществляется от уровней , именно на их значениях происходит отскок цены
FREE

This EA will open reversal order if the price hit the red line. eg: Buy ticket opened, if price hit below red line, buy ticket will be close and sell ticket will be open (lot size based on EA parameter setting)
Parameters Setting Monitor order with StopLoss set: if set to TRUE , order on same symbol with stoploss level will be closed if the stoploss line is hit if set to FALSE , order on same symbol with stoploss level will be ignored LotSize: Lot size for trade by EA new StopLoss position rang

Spread Based pair trading tool It is a very useful tool for commodities traders . Specially those traders who trade crude oil and brent oil. This is also a good strategy for any two pairs which have very high correlation.
This panel consists of Two drop downs to select two symbols. One should chose two mutually correlated symbols. Fields to enter a spread value and trade lot size.
How a trade in this panel is placed? When you click on the place order button, it starts tracking the market and s
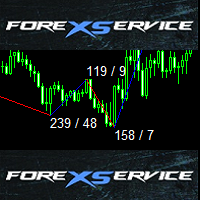
This is standard ZigZag indicator with some cool additional features - colored range, amount of pips between highs and lows and also amount of candles between indicator range.
Default ZigZag indicator variables depthZigZag deviationZigZag backstepZigZag
Bullish market variables lineUpColor - line color lineUpStyle - line style lineUpWidth - line thickness textUpColor - color of text with amount of pips and candles textUpFont - font of text with amount of pips and candles textUpSize - size of t

This is a trend following indicator that identifies optimal entry points in the direction of a trend with an objective stop loss to manage the trade. The indicator allows you to catch trend early and ride it. The Indicator draws resistance line as it detects an Uptrend and draws support line when it detects a Downtrend on the chart. When those levels are broken, that allows you to identify the Trend Direction and Momentum in the direction of prevailing trend which offers optimal entry points in
FREE

NZD INDEX
The Currency Index Project is ONE part of a thorough Forex study. Many people do not know the theoretical basis that drives currency exchange rates to move on the market. With this set of tools you will be able to have a more complete view of the entire market by analyzing not only the single currency of an exchange, but all the exchange rates that make up that currency by looking at a single window!
The indicator faithfully represents the real index of a single currency present in a
FREE

This is Demo Version of PipsFactoryMonthly This indicator depends on High and Low price of Currency in last Month and then i made some secret equations to draw 10 lines.
Features You will know what exactly price you should enter the market. You will know when to be out of market. You will know you what should you do in market: Buy Sell Take profit and there are 3 levels to take your profit Support Resistance Risk to buy Risk to Sell
Signal Types and Timeframe Used You can use this indicator ju
FREE

SMOOTH STRENGTH METER INDICATOR (SMOOTH LINE) it draws Currencies TREND Volatility Power / Strength lines : - Detects the 2 highly TRENDED Volatile pairs ( will be the Bold Lines ) - A very Helpful Indicator - It draws smooth lines for up to 20 currencies pairs representing Volatility strength and power - First it indicates the most powerful trended direction pairs : Strongest / Weaker - MAIN FUNCTION :it gives indication of the UP trend most Volatile Line and the DOWN

Non-proprietary study of Joe Dinapoli used for trend analysis. The indicator gives trend signals when the fast line penetrates the slow line. These signals remain intact until another penetration occurs. The signal is confirmed at the close of the period. It is applicable for all timeframes. Parameters Fast EMA: period of the fast moving average. Slow EMA: period of the slow moving average. Signal EMA: period of the signal line. ************************************
FREE

---> Check all the other products <---
The Candle Bias is a coloring indicator that doesn't take account of the close price of the bars.
It will color the candle in the bearish color (of your choice) if the downard range is greater than the upward range. Conversely, it will color the candle in the bullish color of your choice if the upward range is greater than the downward range.
This is a major helper for Multi Time Frame analysis, it works on every security and every Time Frame. You ca
FREE

The WTR Dynamic Range Indicator is a powerful and deeply customizable range indicator that takes in account the average upward and downward movement of the price in the past trading days. This fully customizable indicator can be setted for a lot of uses and cases:
• Trend trading on level breakouts
• Spotting high probability targets for Take Profits
• Setting a multiple targets for position scaling out The WTR Dynamic Range Indicator calculates the average movements in the long side, then p
FREE

Works on the current TF. Considers MA 2, 14, 30, 120 and 480. The growth rate of the fall, the difference between 2-14, 14-30, 30-120 and 120-480.
In this EA implemented the calculation of the maximum profit, and closing depending on the price, if the maximum profit to 200 points, then do not consider anything, if from 200 to 300, then close if the price is lower by 1.1 times than the maximum profit (the price falls by 10% ), if from 300 to 1500 then close if the price falls below 1.5 times t
FREE

My notes is a simple indicator that will help you put any notes on your price chart. W ith one click you get as many notes as you choose from the menu. All blanks for your entries are lined up in one column. You only need to move the records to the right place on the graph and click on the record. The menu consists of four items: My_sum_Note number of entries , default 5 ; MyMessage Font font name, default "Arial"; MyMessage FontSize font size, default 10; MyMessageColor is the font color, Black
FREE
Become a constantly profitable 5-star forex trader!
We offer a few indicators to support you understand and analyse the market! With our strategies you will improve your trading system and bacome an expert...
We have indicators for trend direction, market direction and others.. for multi-time frames and that covers all majors or your favorite trading symbols! Some of them offer a customizable calculation parameters... or Graph features!
See how powerful they are! The are also easy-to-use tr
FREE
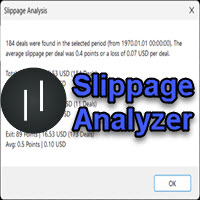
If you are using scalping strategies (or any strategy that uses stop loss orders for position closing) you need to know your slippage. Slippage is the difference between your order price and the price that your brokers uses to execute your order. This can be really different and depends on the broker as well as on the market conditions (news, trading hours, etc..) With this small script you can calculate the slippage you "paid" in points and also in your account currency. You also get average va
FREE

-------------------------------------------------------------------------------------------------------------------------------------------------- New version of this product is here : https://www.mql5.com/en/market/product/59924?source=Site+Profile+Seller -------------------------------------------------------------------------------------------------------------------------------------------------- TOTAL TAKE PROFIT & TOTAL TRAILING STOP. Average Take Profit & Average Trailing Stop. Setup TO
FREE

Probability and risk management based trading algorithm EA. This EA works on any timeframe, in fact it does not take the timeframe in account. Please backtest and generate the optimized values for your MT4 broker. Please use the optimized input parameters only for the given currency pair and don't modify TP or SL once the trade is placed. As per the probability of coin flip the buy and sell orders will be equal in some time, the EA remains profitable because of the optimized parameters.
FREE

With this app you can find the stop out level live or without opening a transaction.
The application consists of 3 boxes, you can enter the amount of money in your Balance box account or it will automatically calculate the current account amount. SELL lot size and BUY lot size can be entered, or trades that are currently open will be calculated automatically. Hedge transactions are calculated automatically.
If you press the S key of the keyboard, you can access the boxes with the values entere
FREE
Displays current spread in the main window of the chart. Indicator Setting: BigDisplay =true or false to switch on and off.
DisplaySize = 20 is default
DisplayColor = Blue
Display_y = 550 position: staring position Y of background panel
Display_x = 1200 position: staring position X of background panel
Author: Happy Forex (Expert Advisor - your algorithm-driven profit, without stress or work)
FREE

The purpose of this new version of the MT4 standard indicator provided in your platform is to display in a sub-window multiple timeframes of the same indicator. See the example shown in the picture below. But the display isn’t like a simple MTF indicator. This is the real display of the indicator on its timeframe. Here's the options available in the FFx indicator: Select the timeframes to be displayed (M1 to Monthly) Define the width (number of bars) for each timeframe box Alert pop up/sound/ema
FREE
It is widely known that colors affect the emotional state of a human, especially if this human is a trader. Psychologists recommend that you follow your instincts and select the color of your environment that is most comfortable to you. In order to reduce emotional stress, impact of colors on a person should be considered. The optimal range of the most beneficial colors includes green, yellow-green and green-blue ones. This indicator allows you to manage your emotional state and health. Choose a
FREE

This indicator is based on the MACD indicator
Also, some candlestick patterns are used in it to identify better signals
Can be used in all symbols
Can be used in all time frames
Easy to use method
Adequate settings
Settings: period: The number of candles used to calculate signals. pFast: Like the MACD indicator settings pSlow: Like the MACD indicator settings
alarmShow: If you want to receive an alert in Metatrader after receiving the signal, enable this setting alarmShowNoti: If you want to
FREE

This expert is a utility to help any trader to find the right lot size according to the risk he wants to take. It calculates the lot size based on account equity and added stop loss.
The utility can't to open or close position.
Attach the expert in the same symbol as the one you want to open position.
PARAMETERS LossPips - Stop loss in pips for your position. RiskPercent - Risk of equity you want to get.
FREE
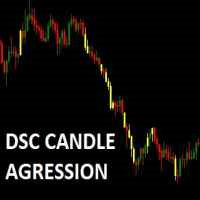
Corretora recomendada para usar esse indicador: https://tinyurl.com/5ftaha7c Indicador que pinta o candle de amarelo em pontos de muita agressão no mercado. Sempre que o mercado for se movimentar o candle irá ficar amarelo. Valido para todos ativos e todos timeframes. SEE OUR RESULTS ON INSTAGRAM: https://www.instagram.com/diogo.cansi/ TELEGRAM GROUP = https://t.me/robosdsc More information by email dscinvestimentos@gmail.com or by Whatsapp 55-991372299
FREE

AUD INDEX
The Currency Index Project is ONE part of a thorough Forex study. Many people do not know the theoretical basis that drives currency exchange rates to move on the market. With this set of tools you will be able to have a more complete view of the entire market by analyzing not only the single currency of an exchange, but all the exchange rates that make up that currency by looking at a single window!
The indicator faithfully represents the real index of a single currency present in a
FREE
Enhance your trading strategy with this indicator from tr1cky.com . When the indicator turns red - Hold off When the indicator turns green - Proceed with the trade in the direction indicated by the indicator This indicator provides insights into the market’s momentum and the optimal trading direction. Derived from its successful Expert Advisor counterpart, the RSIMFI100 go indicator is now available to all. Happy trading!
FREE

This is an efficient and yet simple Expert Advisor not using indicators, which can determine the following: the future direction of movement of quotes, their strength, trade levels for the current and next trading day. The Expert Advisor runs on the "here and now" principle, which means that the EA tracks a lot of parameters of the price behavior in real time. Based on this Expert Advisor, a certain trading strategy was developed and tested in real time. The ELEMENTARY strategy consists of three
FREE

This is a free trial version of ScalTradeAssist Pro ( https://www.mql5.com/en/market/product/25920 ) You can use all functions of the tool without any restriction except the lot size. (fixed as 0.01)
I hope you'd like it and decide to purchase the professional version :)
Below is the explanation of the ScalTradeAssist Pro.
*If you see that the orders are not being placed, please check your spread setting, this tool watches it and never place orders if the spread is not matching.
ScalTradeAssis
FREE

Introductory Pricing for one month
Brute force trader is specially designed to find the best entry point and exit point with the regular tested and proven indicators. The EA will automatically analyse the market and will follow trends with the right entry exit points. Since the timeframe it is using is 30 minutes, the chances that you are stuck into a long trade is very low. Thought it does not use stoploss but it has the
FREE

This is an Expert Adviser use for manual trading as a background EA or combine with external EA to open orders. Loss Recovery Trading is one of your options to handle the lose positions instead of using stop loss by setting a zone recovery area and target to exit the turn rounds sequence.
How It Work? If the market goes against your first positions direction at the specific of losing points, the EA will open an opposite direction position with calculated larger lot size and also keep the first
FREE

The Retracement indicator shows the current and historical high, low and mid values. Optionally, it can also display major retracement levels. All these levels together form the significant levels of support and resistance. Therefore, it is essential to know them for every kind of trader.
Levels High Low Midpoint 76,4 % 61,8 % 38,2 % 23,6 %
Main features The indicator shows the actual levels of High, Low, Mid and selected retracements. Four optional retracement levels. Alert notifications
FREE

Dexter EA is a 100% automatic robot that executes random orders of simultaneous buys and sells. For each losing operation, a management with an increase in the lot will begin, better known as “martingale” that will cause the price to fall back to the area where it was established. the profit the robot closes in profit or breakeven, depends on its configuration. I catalog it as a utility even though it works totally automatic because EVERY TRADER'S WORK IS NEEDED to be able to make it work corre
FREE
MetaTrader 마켓은 개발자들이 거래 애플리케이션을 판매할 수 있는 간단하고 편리한 사이트이다.
제품을 게시하고 마켓용 제품 설명을 어떻게 준비하는가를 설명하는 데 도움이 됩니다. 마켓의 모든 애플리케이션은 암호화로 보호되며 구매자의 컴퓨터에서만 실행할 수 있습니다. 불법 복제는 불가능합니다.
트레이딩 기회를 놓치고 있어요:
- 무료 트레이딩 앱
- 복사용 8,000 이상의 시그널
- 금융 시장 개척을 위한 경제 뉴스
등록
로그인
계정이 없으시면, 가입하십시오
MQL5.com 웹사이트에 로그인을 하기 위해 쿠키를 허용하십시오.
브라우저에서 필요한 설정을 활성화하시지 않으면, 로그인할 수 없습니다.