MetaTrader 4용 유료 기술 지표 - 75
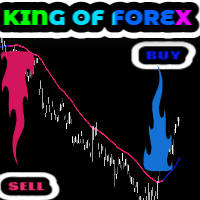
King of Forex trend indicator is a trend following indicator based on moving averages. This indicator doesn't repaint. The major function of this indicator is to show the major direction of the trend, the beginning and the end of the current trend. A bullish trend is when the indicator turns blue A bearish trend is when the indicator turns pink. This indicator is great for swing trading and day trading It works best on H1, H4, D and Weekly time-frames. It works on all pairs but it works best on

This indicator is good for small time frames like 1 and 5 minutes and made for day trading. The indicator never repaints or recalculates. The indicator works is for trading swing points in day trading, following bulls or bears. Its a simple to use, non cluttered indicator with a high success rate. This indicator works well to capture ranges. All indicators come with limitations and no indicator or system is always accurate. Use money management for long term trading success. Place in backte

This indicator is designed based on Mr. WD Gann's square of nine methods.
Using this indicator, we can enter the desired pivot price and, based on the coefficient we assign to it, extract 8 support and resistance numbers with 8 angles of 45, 90, 135, 180, 225, 270, 315, and 360.
Calculates 8 support and resistance points and draws support and resistance lines.
The coefficient is to triple the number of executions.
To select pivot points in which a price is a large nu

The new update makes this indicator a complete tool for studying, analyzing and operating probabilistic patterns. It includes: On-chart Multi-asset percentage monitor. Configurable martingales. Twenty-one pre-configured patterns , including Mhi patterns and C3. An advanced pattern editor to store up to 5 custom patterns. Backtest mode to test results with loss reports. Trend filter. Hit operational filter. Martingale Cycles option. Various types of strategies and alerts. Confluence between patte
a tool for working with binary options well identifies the trend and possible market reversals
can be used for forex scalping
it works very well on binary options if used with oblique levels or wave analysis, it will be a good assistant in determining the entry point
recommended expiration time from 1-15 depending on the selected timeframe
the next update will add the ability to customize the tool.

This is a multi-timeframe multi-currency Fibo (Fibonacci levels) and Pivots scanner which also shows Missed Pivot count and Fibo Golden Ratio Zones. Features
Select separate Pivot Timeframes for each Dashboard Timeframe Check when price is near a Pivot point Check for Price Crossing Pivot Point Use Mid Pivots (Optional) Show Missed Pivots (Optional) Show High Volume Bar Use Fibo (Optional) Use Fibo Golden Ratio (Optional) Set your preferred Timeframe for Fibo or Pivots Detailed blog post:
https:

Moving Wizard indicator will guide you to work with Trend and give pure Entry point depending on crossing on the chart it work on all currency and all Timeframe you can use it daily or scalping or swing its good with all and This indicator you can make it your strategy i work on it on H1 Timframe and make a good money you can take alook on it and you see a great resault on chart .Gold moving is to Know the Trend of price other moving below it mean we looking to sell orders . if above it we loo
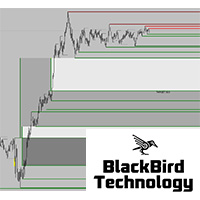
New market liquidity indicator, more accurate with two levels, will really unhide the "hidden agenda" of the price action in any timeframe. For more information about market liquidity, a manual on how to use this indicator please send me a message.
A lot of information can be found on the net. (search liquidity trading/ inner circle trader)
https://www.youtube.com/watch?v=yUpDZCbNBRI
https://www.youtube.com/watch?v=2LIad2etmY8& ;t=2054s
https://www.youtube.com/watch?v=wGsUoTCSitY& ;t=112

This is the DayTradeKing for gold on a 1 minute time frame. It is a different calculation for the range. Use a 200 period moving average as a filter. Always use stops and avoid news, wait for more conformation. This looks to capture intraday ranges. Put it in the back tester on 1 minute to see the price action and how it works. Trade with trend Use filter Use stops Alerts are added for pop ups and sound.

RSI Scanner Plus Indicator scans RSI values in multiple symbols and timeframes. Plus trend line buffer on the chart. Features:
-Trend Line : We add trend line on the chart in the hope it help you to see current trend on the chart while following oversold and overbought from RSI. This is additional feature in the indicator. We consider that following the trend is very important in trading. -Changeable Panel Display : Change the value of Max.Symbols/Panel and the indicator will adjust the da
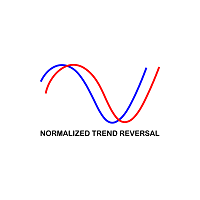
정규화된 추세 반전 다중 시간 프레임 표시기 정규화된 추세 반전 다중 시간 프레임 표시기는 매우 안정적인 추세 반전 표시기로 개발되었습니다. 정규화된 추세 반전 다중 시간 프레임 표시기는 모든 외환 통화 쌍 및 금속에 적합하며 모든 종류의 시간 프레임 차트와 일치할 수 있습니다. 정규화된 추세 반전 다중 시간 프레임 표시기는 별도의 창에서 두 개의 수정된 이동 평균 시스템의 교차를 사용하여 신호를 생성합니다. 이러한 평균 수준을 정규화된 추세 반전 다중 시간 프레임 표시기라고 합니다. 파란색 평균 수준을 빠른 정규화 추세 반전 다중 시간 프레임 표시기라고 하고 느린 정규화 추세 반전 다중 시간 프레임 표시기를 빨간색 평균 수준으로 표시합니다. 빠른 파란색 정상화 추세 반전 다중 시간 프레임 표시기가 느린 빨간색 정상화 추세 반전 다중 시간 프레임 표시기를 교차할 때마다 시장에 매수 진입을 알리는 강세 크로스오버로 간주됩니다. 반면에 느린 빨간색 정규화 추세 반전 다중 시간 프레


Breakout strategies are very popular among traders. They consist of buying an asset when it breaks above some level or selling it when the price breaks below some level. This level can be a t rend line, a previous high, a m oving average, or another indication. In the case of a box breakout, the indicator draws a box containing the highs and lows of the previous candles. LONDON BREAKOUT BOX indicator gives u alert when there is a box break out ONLY IN LONDON session when price breaks previo
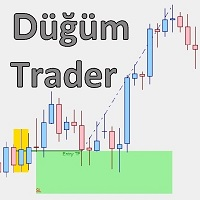
Düğüm Trader는 R&D 팀의 점진적 가격 조치 방법을 기반으로 개발되고 개발된 진입 구역 감지기 및 거래 제안 지표입니다. 이 도구는 거래자가 잠재적인 지원 및 저항 구역으로 범위 영역을 더 깊이 볼 수 있도록 도와줍니다.
표시기에는 고밀도 보류 주문 영역을 진입 구역으로 찾고 가격 조치 규칙을 통해 필터링하는 특수 계산이 있습니다. 새로운 Entry Zone 생성 후 "Entry" 태그가 있는 녹색 라인으로 확인을 기다립니다. 이 확인 후 영역 분할 측면(위에서 또는 아래로) 표시기를 기반으로 주문 유형을 결정합니다. 가격이 진입 가격으로 돌아오면 주문은 시장 거래로 간주되며 거래 수명을 명확하게 표시하기 위해 SL 직사각형이 그려집니다. 가격이 거래를 대신하여 움직이면 SL 직사각형의 색상이 녹색이 되고 그 반대의 경우 빨간색이 됩니다.
이익 포인트가 SL 포인트와 같거나 클 때 거래는 수익성 있는 주문이 될 것입니다. 즉, 지표는 RR이 최소 1:1일 때 거래

METATRADER 5에 대한 경고 위아래
이 표시기는 가격이 UP과 DOWN 라인 사이의 영역을 벗어날 때 경고를 생성합니다.
다음과 같은 다양한 유형의 경고를 생성할 수 있습니다.
> 사운드
> 메시지 상자
> 전문가 상자의 메시지
> 메일(이전 구성)
> PUSH 알림(이전 구성)
선은 선 속성이 아니라 표시기 속성에서 구성해야 합니다. 선 속성에서 구성하면 피노나치가 영향을 받을 수 있기 때문입니다.
설정 중 색상, 선 스타일 및 너비를 변경할 수 있습니다. 선은 선 속성이 아니라 표시기 속성에서 구성해야 합니다. 선 속성에서 구성하면 피노나치가 영향을 받을 수 있기 때문입니다.
설정 중 색상, 선 스타일 및 너비를 변경할 수 있습니다. 선은 선 속성이 아니라 표시기 속성에서 구성해야 합니다. 선 속성에서 구성하면 피노나치가 영향을 받을 수 있기 때문입니다.
설정 중 색상, 선 스타일 및 너비를 변경할 수 있습니다.
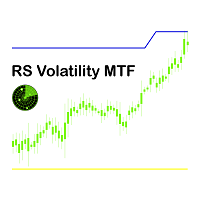
레이더 신호 변동성 다중 시간 프레임 표시기메타 트레이더 4 레이더 신호 변동성 다중 시간 프레임 표시기 매우 신뢰할 수 있는 추세 지표로 개발되었습니다. 레이더 신호 변동성 다중 시간 프레임 모든 외환 통화 쌍에 적합하며 모든 종류의 시간대 차트와 일치할 수 있습니다. 레이더 신호 변동성 다중 시간 프레임 표시기 이동 평균 시스템과 가격의 교차를 기반으로 추세 신호를 생성합니다. 평균 실제 범위를 고려하면, 이제 정확한 진입점이 정의됩니다. 노란색 선은 이 가능한 진입점을 나타냅니다. 가격이 노란색 선을 넘으면 거래를 시작할 수 있습니다. 파란색 선은 가능성을 나타냅니다. 이익을 취하십시오. 가격이 파란색 선을 넘으면 거래를 종료할 수 있습니다. 두 개의 녹색 선은 종가가 녹색 선을 점으로 깨면 추세가 변경되는 영역을 보여줍니다. 점이 있는 이 녹색 선은 가능한 SL, 가능한 손익분기점 또는 가능한 후행 정지점으로 사용할 수 있습니다. 점이 없는 녹색선은 가격이 이 녹색에 닿
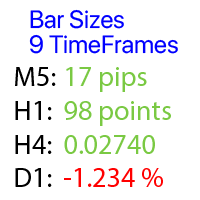
선택한 바 이동량으로 각 시간 프레임에서 가격 변동을 계산
다기능 유틸리티 : 66+ 기능 포함, 이 도구 포함 | 질문이 있으면 저에게 연락하세요 | MT5 버전 계산할 바의 이동량 을 선택할 수 있습니다: 부동 (현재) 바; 마지막 닫힌 (이전) 바; 가격 값 유형 은 상단 행의 파란색 스위치로 선택할 수 있습니다: 핍 (Pips); 시장 포인트; 백분율 값 (%); 가격 값; 바 크기를 계산하는 방법 은 파란색 버튼으로 선택할 수 있습니다: 바디 : (시가 - 종가) 가격; 섀도우 : (고가 - 저가) 가격; 유틸리티는 차트의 별도 창 에 표시됩니다: 창은 차트의 아무 곳으로 이동 가능: 어디서나 드래그; 인터페이스는 "[^]" 버튼으로 최소화 가능; 지표 설정에서 다음을 구성할 수 있습니다: 다크 / 라이트 인터페이스 테마; 인터페이스 크기 배율; 폰트 크기와 스타일; 프로그램 파일은 " 지표 " 디렉토리에 배치해야 합니다.

with JR Trend you will able to enter and exit every trade with just a signals appear no need for any strategy just flow the indicator it work on all pairs and all Timeframe i usually take a look on higher timeframe and return to the lowest timeframe and make an order with indicator signals you can see the amazing result so you can depend only on it intraday or swing as you wish

Please read the comment section for more introduction about indicator. ( i cant put all lines in here their is limit ) Entry conditions ---------------- Scalping - Long = Green over Red, Short = Red over Green Active - Long = Green over Red & Yellow lines Short = Red over Green & Yellow lines Moderate - Long = Green over Red, Yellow, & 50 lines

Powerful Trading Tool for Your Desired Results This tool can help you achieve the trading results you want. It's a 2-in-1 solution, suitable for both Binary Options and Forex trading. Key Features: Versatility: It serves as a versatile tool for trading both Binary Options and Forex markets. Consistent Performance: The indicator demonstrates excellent performance on both Binary Options and Forex markets. Continuous Improvement: The tool will continue to be enhanced to meet evolving trading

TrendScanner XTra scans market trends from Multi Symbols and Multi Timeframes with extra additional Entry Point Signals arrow on the current chart. Features:
-Entry Point SIgnals : This is additional feature in the indicator. No repaint arrows. The Trading system in the single indicator. MTF Trend informations and Entry Signals. In order to make it easier for trader to get trading moments from a single chart and deciding entry time. -Changeable Panel Display : Change the value of Max.Symbol

As you know, the main invariable indicator of all traders is the moving average; it is used in some way in most strategies. It is also obvious that this indicator is capable of showing good entries in every local area. For which it usually needs to be optimized or just visually adjusted. This development is intended for automatic optimization of the indicator. Once placed on the chart, the indicator will automatically re-optimize itself with the specified period ( PeriodReOptimization ) and dis
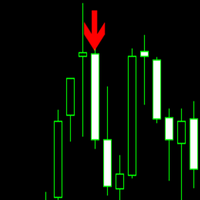
Trade trends with the Super Scalper Use on all time frames and assets it is designed for scalping trends. Works good on small time frames for day trading. The arrows are easy to follow. This is a simple no repaint/no recalculate arrow indicator to follow trends with. Use in conjunction with your own system or use moving averages. Always use stops just below or above the last swing point or your own money management system The indicator comes with push notifications, sound alerts and email

The Salinui trend indicator works using a special algorithm. It finds the current trend based on many factors. Indicator entry points should be used as potential market reversal points. Simple and convenient indicator. The user can easily see the trends. The default indicator settings are quite effective most of the time. Thus, all entry points will be optimal points at which movement changes. You can customize the indicator based on your needs.
You can use this indicator alone or in combinati

The King of Forex Trend Cloud Indicator is a trend following indicator based on moving averages. The Indicator is meant to Capture both the beginning and the end of a trend. This indicator can be used to predict both short and long terms market trends. The king of Forex Trend Cloud if paired together with the King of Forex Trend Indicator can give a broad picture in market analysis and forecasts. I have attached images for both the The king of Forex Trend Cloud on its own and The king of Fore
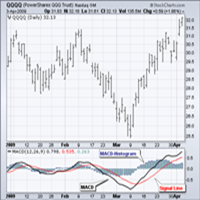
Standard MACD is the 12-day Exponential Moving Average (EMA) less the 26-day EMA. Closing prices are used to form the MACD's moving averages. A 9-day EMA of MACD is plotted along side to act as a signal line to identify turns in the indicator. The MACD-Histogram represents the difference between MACD and its 9-day EMA, the signal line. The histogram is positive when MACD is above its 9-day EMA and negative when MACD is below its 9-day EMA. Peak-Trough Divergence The MACD-Histogram anticipate

The Extremum Average signal indicator works on all timeframes and any markets. Analyzes the smoothed data of extremums and gives signals to sell or buy.
The indicator has only two settings: Number of Bars - the number of last bars to search for an extremum Period Average - Period (number of last bars) for data smoothing For each timeframe and market, you need to select its own values. Additionally, in the indicator settings, you can set your own style of signal display: Size Arrow Code Arrow B

The QRSI indicator is one of the most important and well-known indicators used by traders around the world. All signals are generated at the opening of the bar. Any closing price or zero bar prices are replaced with the corresponding price of the previous bar in order to avoid false results. This indicator is suitable for those who are interested in the classic calculation method but with improved functionality. There is a version for both MT4 and MT5.
By its nature, the QRSI indicator is

The Goodfellas indicator analyzes the price behavior and if there is a temporary weakness in the trend, you can notice it from the indicator readings, as in the case of a pronounced trend change. It is not difficult to enter the market, but it is much more difficult to stay in it. With the Goodfellas indicator it will be much easier to stay in trend! This indicator allows you to analyze historical data and, based on them, display instructions for further actions on the trader's screen.
Every r

The Dictator indicator is based on the process of detecting the rate of change in price growth and allows you to find points of entry and exit from the market. a fundamental technical indicator that allows you to assess the current market situation in order to enter the market of the selected currency pair in a trend and with minimal risk. It was created on the basis of the original indicators of the search for extremes, the indicator is well suited for detecting a reversal or a large sharp jer

골드 ZigZag - 실제로는 다시 칠하지 않고 LAG도 없는 지그재그인 화살표 표시기로 양초가 열릴 때 신호를 제공합니다! 이 표시기는 XAUUSD 쌍(골드)을 위해 특별히 설계되었습니다. 다른 쌍에도 표시기를 사용할 수 있지만 원래 표시기는 금에만 사용하도록 되어 있었습니다. 이 지표는 모든 기간에 사용할 수 있지만 H4 및 D1과 같은 더 높은 기간을 권장합니다. 이 지표는 사용하기 쉽고 상인의 특별한 기술이나 지식이 필요하지 않습니다. 표시기에는 길이와 감도라는 두 가지 공개 매개변수만 있습니다. 이 두 매개변수를 사용하여 개인 거래 선호도에 따라 신호를 조정할 수 있습니다. PUSH 알림을 이용해 이동 중에도 거래가 가능합니다. 거래 팁과 큰 보너스를 얻으려면 구매 후 저에게 연락하십시오! 행복하고 수익성 있는 거래를 기원합니다!

Idea: RSI ( Relative Strength Index) and CCI ( Commodity Channel Index ) are powerfull to solved the market. This indicator has Smoothed Algorithmic signal of RSI and CCI. So that, it separates the market into buy and sell zones, these areas are marked with arrows, red for downtrend, green for uptrend. This algorithm has the effect of predicting the next trend based on the historical trend, so users need to be cautious when the trend has gone many candles. Please visit screenshots

The breakout algorithm is a technique based on price, price features, to shape a breakout strategy. The strategy in this indicator will not be redrawn (none-repaint indicator), it is suitable for short or long term traders In the screenshot is the EURUSD pair, these currency pairs, commodities or stocks, it have similar strength *Non-Repainting (not redrawn) *For Metatrader4 Only *Great For Scalping *Great For Swing Trading *Arrow Entry, Green is Long, Red is Short *Works On Any Timeframe *Work

Artificial intelligence is a trend of the times and its power in decoding the market has been demonstrated in this indicator. Using a neural network to train the indicator to recognize trends and remove noise areas caused by price fluctuations, this indicator has obtained a reasonable smoothness for analyzing price trends. This indicator is none repaint. Suitable for day traders or longer traders *Non-Repainting (not redrawn) *For Metatrader4 Only *Great For Swing Trading *Histogram Up is Long,

Market Profile
Shows where the price has spent more time, highlighting important levels that can be used in trading.
It is a powerful tool which is designed to take the fundamental components which comprise every market; price/volume/time, and visually display their relationship in real-time as the market develops for a pre-determined time period. Very powerful tool!

The resistance and support lines are the position where the price will have a change, be it a breakout to follow the trend or reverse. The price rule will go from support to resistance and Long's resistance can be Short's support and the opposite is true. Accurately identifying support and resistance lines is the key to being able to trade well and profitably. This indicator is based on the Fractals indicator, the indicator will be redrawn by 2 candles. *Great For Swing Trading *Blue is Support

VWAP Bands Metatrader 4 Forex Indicator
The VWAP Bands Metatrader 4 Forex indicator is a quite similar to the Bollinger bands, but it deploys volume weighted average as the core value of the bands. There is an option of using the tick volume or real volume for calculation when using the VWAP Bands Metatrader 5 custom forex indicator, especially when the forex broker displays symbol alongside real volume. Similarly, you can decide to have deviations calculated with the sample correction or not.
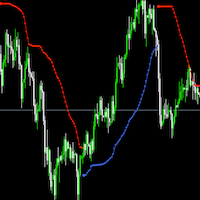
Bbandtrend 一款趋势指标,可以用来判断外汇、黄金等商品的趋势,用于辅助交易,提高交易的胜率。每个人都可以调整参数,适应不同的货币。 指标多空颜色可以自定义。 extern int Length=60; // Bollinger Bands Period extern int Deviation=1; // Deviation was 2 extern double MoneyRisk=1.00; // Offset Factor extern int Signal=1; // Display signals mode: 1-Signals & Stops; 0-only Stops; 2-only Signals; extern int Line=1; // Display line mode: 0-no,1-yes extern int Nbars=1000;
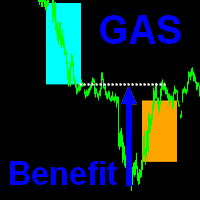
The indicator is based on the principle of closing the Gap of the American trading Session ( GAS ).
How is the Intersession Gap formed? A time interval is formed between the closing of a trading session and the opening of a new one (the next day) about 15 hours, during this time the price may deviate from the closing price in any direction. It is noticed that such deviations in 95% of cases are temporary and the price returns to the closing point of thesession. What does the indicator do? The

Price breakouts, Levels, Multi-time frame Inside bars checks for price failure to break from the previous high/low and on breakout draws a breakout box on the chart. The choice of breakout price is given to the user i.e. close or high/low of bar. Alerts can be received on breakouts. Features:- Multi-time frame Alerts, notifications & emails Usage:- Breakout signals Check how price action is evolving with the help of boxes Get multi-time frame bias
MyArrow 지표 Nr:1 이 지표는 High Low 시리즈를 조사하여 생성된 이동 평균과 그래프에서 이러한 이동 평균에서 파생된 밴드 값을 초과하여 수신된 신호에 의해 생성됩니다. 쉽게 이해할 수 있듯이 아래쪽 화살표는 유망한 매도 신호를 나타내고 위쪽 화살표는 가능한 매수 신호를 나타냅니다. 많은 이득... MyArrow 지표 Nr:1 이 지표는 High Low 시리즈를 조사하여 생성된 이동 평균과 그래프에서 이러한 이동 평균에서 파생된 밴드 값을 초과하여 수신된 신호에 의해 생성됩니다. 쉽게 이해할 수 있듯이 아래쪽 화살표는 유망한 매도 신호를 나타내고 위쪽 화살표는 가능한 매수 신호를 나타냅니다. 많은 이득... MyArrow 지표 Nr:1 이 지표는 High Low 시리즈를 조사하여 생성된 이동 평균과 그래프에서 이러한 이동 평균에서 파생된 밴드 값을 초과하여 수신된 신호에 의해 생성됩니다. 쉽게 이해할 수 있듯이 아래쪽 화살표는 유망한 매도 신호를 나타내고 위쪽 화살표
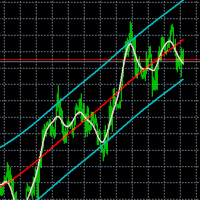
Flex channel - indicator plots channel using Hodrick-Prescott filter. Hodrick-Prescott filter is the method of avreaging time series to remove its cycling componets and shows trend. Settings HP Fast Period - number of bars to calculate fast moving average
HP Slow Period - number of bars to calculate slow moving average
Additional information in the indicator Channel width - channel width in pips at first bar MA position - fast moving average position in the channel in persentage
Close position -
The sample on the right corner of the chart uses Font Size 20. The characters/numbers will start from the right side/corner of the chart, so that when increase the font size, the text will expand out to the left/top and won't goes to the right/bottom and get hidden. Able to change these Inputs. a. Other Symbol. Current chart symbol will always be displayed. b. Fonts. c. Font size. d. Text color (All the text label, local time, bid, ask, spread, lots, number of trades, Margin, Free Margin, Mar
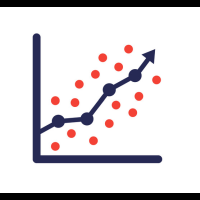
Ferox Least Squares Regression is an algorithm that uses regression and is design by Ferox Quants-Labs to use method like typical quantitative algorithm, using statistics and use past data to predict the future. * None Repaint indicator * Quantitative algorithm *Great For Swing Trading * Histogram Up is Long, Down is Short *Works On ALL Timeframe *Works On Any MT4 Pair
지표 Simple ATR 시장 변동성을 더 명확하게 추적하기 위한 간소화된 도구로, 데이 트레이딩 및 스윙 트레이딩에 이상적입니다. 거래를 시작하거나 초보자에게 가장 적합한 지표입니다.
시각적 지표 색상: ATR Daily - 파란색 시각적 지표 색상: ATR Weekly - 빨간색 시각적 지표 색상: ATR Monthly - 노란색
Volatility Vision 지표와 결합하여 분석을 강화하십시오. 시장 상황의 변동을 정확하게 측정하여 데이 트레이딩 및 스윙 트레이딩 결정에 필수적입니다. 14일(구성 가능) 간단한 이동 평균을 사용하여 정확성을 보장합니다. 거래 시스템에서 거래 시작 또는 종료 전략을 구현하는. ATR 지표가 다른 지표보다 더 나은 이유: 사용의 용이성: ATR 지표는 초보자도 설정하고 이해하기 쉽습니다. 다용도: 데이 트레이딩 및 스윙 트레이딩에 적합하여 다양한 거래 전략에 유연성을 제공합니다. 신뢰성: ATR은 정확한 시장 변동성 데이터를 제공하여 트
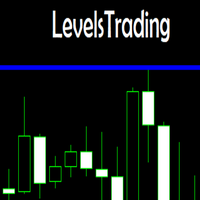
This indicator is a simple stripped down version of any advanced support and resistance indicator. All the support and resistance indicators work from a number of bars that have developed over time. Get rid of clutter and confusing levels. Find levels according to a number of bars. Look at days, session, numbers of hours, periods of consolidation. Watch levels develop and use as breakout points, or areas of buyers and sellers. Features and things to consider This indicator is for a frame of
volume MTF is the way to give you the Volume of currency and you will Know the trend and reflection when happen it used on scalping and entraday trading strategy with (M1....H4) Timeframe i always going take a look on higher timeframe then back to small timeframe and wait an indicator signals the setting of indicator i usually used the default just remove the arrows from setting this indicator recommended for scalping

Scalping Arrow Notification Phone is a unique scalping trading indicator. The indicator draws arrows on the chart when you need to open an order, shows in which direction you need to open orders, and also sends you a notification about a signal to your mobile phone. At any time, even when you are not at the computer, you will receive signals, be able to control the market and trade. The indicator shows with an arrow when to open an order, as well as the direction of the arrow shows in which dir
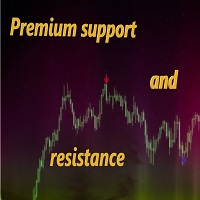
Premium support and resistance - the best combination of different indicators allowed us to create the best product on the market!
And that's Premium support and resistance!
A convenient and flexible tool that will help you in trading!
Shows where the price will go from the support and resistance levels!
The arrows Blue buy Red sell will help you with this!
Alert is already built into the indicator for your convenience!
Alert in order not to miss the "Own" signal!
It is already configure

v. 1.0 This indicator can show with maximum accuracy up to 1 bar the presence of a Maximum/minimum on the chart, regardless of the timeframe. It has a flexible configuration. You can use either one value on all TF, or you can use your own value on each TF individually.
This indicator is already being improved and those who purchase it receive all updates for free.
Next, it is planned to display an indication of the strength of the pivot point at each extremum (in % or in color drawing). It wi

Dear traders, here is my other tool called the "Market Makers Trend Index". The Market Makers Trend Index is created for the purpose of helping majority of traders to analyse the market direction in an easy way. This indicator is for serious traders who are eager to add edging tools to their trading arsenal. What are you waiting for just grab your copy today and amake a difference. WHY THIS TOOL This indicator help traders analyse the trend direction and trading signals with precision and eff

Contact me after payment to send you the User-Manual PDF File. Divergence detection indicator with a special algorithm. Using divergences is very common in trading strategies. But finding opportunities for trading with the eyes is very difficult and sometimes we lose those opportunities. The indicator finds all the regular and hidden divergences. (RD & HD) It uses an advanced method to specify divergence. This indicator is very functional and can greatly improve the outcome of your trading. Thi
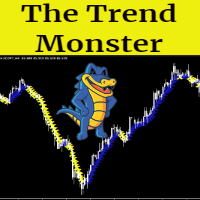
The Trend Monster is a trend following non repainting indicator based on moving averages. As traders we want to be careful not to trade against the trend. Therefore when you look at the chart as a trader you will have to ask yourself these kind of questions Is this market trending? Is this market ranging/trading sideways? Is this market bullish or bearish? What should I look for before I take a trade? Those are some critical questions that every trader should ask him/herself before taking any tr

M1 Scalper System is a unique scalping manual trading system. This trading system automatically analyzes the market, determines price reversal points, shows the trader when to open and close orders. This system shows all the information a trader needs visually on the chart.
M1 Scalper System - sends a trader to the phone and email signals! Therefore, you do not need to sit at the PC all the time, waiting for a signal. When a good signal appears on the market to open a trade, the indicator will

Pianist - arrow indicator without redrawing shows potential market entry points in the form of arrows of the corresponding color. The tool reduces the number of missed entries, which is very important for an intraday strategy, where the mathematical expectation is quite low and the spread costs are high. Arrows will help a beginner trader to better understand the mechanism of formation of signals of a trading system during step-by-step testing. The icons with the entry direction that appear wil

The QRSI indicator is one of the most important and well-known indicators used by traders around the world. It is also obvious that this indicator is capable of showing good entries in every local area. For which it usually needs to be optimized or just visually adjusted. This development is intended for automatic optimization of the indicator. Once placed on the chart, the indicator will automatically re-optimize itself with the specified period (PeriodReOptimization) and display the chart wit

Indicator Forex Indiana allows you to analyze historical data, and based on them, display instructions for the trader for further actions. Indiana implements indicator technical analysis and allows you to determine the state of the market in the current period and make a decision on a deal based on certain signals. This is the result of mathematical calculations based on data on prices and trading volumes. An attempt is made to describe the current state of affairs in the market, to understand

Elephant is a trend indicator, a technical analysis tool that helps to determine the exact direction of the trend: either the upward or downward movement of the price of a trading currency pair. Although these indicators are a little late, they are still the most reliable signal that a trader can safely rely on. Determining the market trend is an important task for traders.
Using the algorithm of this forex indicator, you can quickly understand what kind of trend is currently developing in the

The Fracture indicator uses many moving averages that are with a given Length step. As a result of the work, the resulting lines are formed, which are displayed on the price chart as blue and red lines. The simplest use case for the indicator is to open a trade in the direction of an existing trend. The best result is obtained by combining the indicator with fundamental news; it can act as a news filter, that is, show how the market reacts to this or that news. The indicator lines can also be in

응용 프로그램은 한 시트에 수십 쌍의 데이터를 표시합니다. 이를 통해 거래를 위한 유망한 쌍을 빠르게 식별할 수 있습니다. 수십 개의 차트를 열어 분석할 필요가 없습니다. 3-4-5개의 차트와 정확히 분석해야 하는 차트만 열면 됩니다. "댓글" 전체 크기 사진을 참조하십시오. 메뉴는 1~30개의 기호로 설정할 수 있습니다. 이것이 충분하지 않으면 그래픽 인터페이스를 통해 무제한으로 추가할 수 있습니다. 거기에서 불필요한 쌍을 삭제할 수도 있습니다. GUI를 통해 내장 표시기의 추세 설정을 변경할 수도 있습니다. 표시기는 일, 주, 월, 연도의 최대값과 최소값을 찾습니다. 표는 최대/최소 값을 표시합니다. "최대-최소" 진폭은 각 기간에 대한 도구 설명에 표시됩니다. 가격이 최대 또는 최소값에 도달하면 해당 셀의 색상이 변경됩니다. 최대값이 Lime이면 최소값이 주황색입니다. 고가/저가도 현재 가격과 비교할 수 있으며, 이는 표에도 표시됩니다. 애플리케이션에는 MA-Cr

"Trend Guide" is an indicator showing the trend direction based on a fast and slow moving average. Everything is simple and most importantly convenient.
Indicator Parameters :
"_fast_moving_average_period" - The period of the fast moving average;
"_ Slow_Moving_Average_Period" - The period of the slow moving average; ;
"_MA_SHIFT " - Moving average shift;
"_MA_METHOD " - Averaging method;
"_APPLIED_PRICE " - Type of price calculation;
"_line_width " -

Export Positions and Orders to JSON file On every tick the software checks if something is changed from the last export, and it rewrite the file only when necessary, optimizing CPU and disk writes You can choose: - to export only the current Symbol or all Symbols
- to export only positions, only orders or both
- the file name to export to The file will be saved on MQL4\Files folder with .json extension You can use the file how you want, to copy for example your MT4 positions on other platofms

Scalping trader full - full version of the scalping indicator for intraday trading. This indicator analyzes the state of the market and shows the trader with arrows when to open orders and in which direction. When the arrow appears, open an order in the direction of the arrow. We set take profit at the minimum distance (about 10 pips + spread). Stoploss is an indicator signal in the opposite direction.
Indicator advantages: shows signals on the chart when to open orders. shows in which directi

Scalping trader light is a simplified version of the scalping indicator for intraday trading. This indicator analyzes the state of the market and shows the trader with arrows when to open orders and in which direction. When the arrow appears, open an order in the direction of the arrow. We set take profit at the minimum distance (about 10 pips + spread). Stoploss is an indicator signal in the opposite direction.
The simplified version of the indicator works the same on all pairs and timeframes

NOTE-After the first 10 people to rent this product for 1 month then I will remove the 1 month renting option and leave the unlimited price only. Therefore don't rent it too late. Thanks for those who have rented yet. Don't miss out this offer! Few people remaining. Special offer from 2500usd to 200usd 24 hours offer! Introduction
Super bands Trend Indicator is an indicator designed to reveal the direction of the market Trend. The Indicator is based on moving averages, ichimoku, alligators, a

Индикатор отображает динамические разворотные уровни по шкале Фибоначи. Основан на индикаторе ЗИГ-ЗАГ, который управляется периодом и минимальной глубиной для переключения тренда. Если указать глубину переключения равной 0, то она не будет участвовать в расчетах индикатора. Используется неперерисовывающий сформированные вершины индикатор - возможны несоответствия экстремумов со стандартным индикатором ЗИГ-ЗАГ. Расчитывается на закрытом баре, действие зоны отображается для текущего бара. Основные

Reversals typically refer to large price changes, where the trend changes direction. Small counter-moves against the trend are called pullbacks or consolidations.When it starts to occur, a reversal isn't distinguishable from a pullback. A reversal keeps going and forms a new trend, while a pullback ends and then the price starts moving back in the trending direction. Difference Between a Reversal and a Pullback A reversal is a trend change in the price of an asset. A pullback is a counter-move w

Dear Onis,
This Indicator is used for GBPUSD, US30 and GOLD on 1-Min Chart . For US30 , Depending on your broker, Minimum Lot Size will differ from 0.01 to 1.0 lots. My Current Account is trading at 1.0 lots at $1 per point .
Please check with your Broker what's the Margin Required for your Minimum lot sizes before you trade on your Real account.
I have Forward Tested the indicator for around 6 months before releasing it to the public. ( No Demo is available for the Indicator, Strategy Teste

The Forex Scalpers Index (FSI) is a trend following Indicator based on moving averages. The purpose of this indicator is to be used for scalping all kinds of markets without limitations. The indicator can be used for any kind of currency pair. For those Scalpers who are looking for the indicator that can make their trading activities easy we recommend using this indicator because it provides many entry and exit opportunities. This indicator can be used on all timeframes.
How it works. Colored
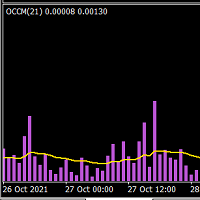
This indicator is suited for who is looking to grasp the present and past market volatility. You can apply this indicator to any instrument, you will be able to understand when the market is moving sideways and when it's pickinp up momentum. The embedded moving average allows you to filter bad trade signals. You can tweak the moving average to reach its maximum potential.
As I have highlighted in the screenshot when the moving average is above the histogram the price tends to move sideways crea
MetaTrader 마켓 - 거래자를 위한 로봇 및 기술 지표는 거래 터미널에서 바로 사용할 수 있습니다.
The MQL5.community 결제 시스템은 MQL5.com 사이트의 모든 등록된 사용자가 MetaTrader 서비스에서 트랜잭션을 수행할 수 있습니다. 여러분께서는 WebMoney, 페이팔, 또는 은행 카드를 통해 자금을 예치하거나 인출하실 수 있습니다.
트레이딩 기회를 놓치고 있어요:
- 무료 트레이딩 앱
- 복사용 8,000 이상의 시그널
- 금융 시장 개척을 위한 경제 뉴스
등록
로그인
계정이 없으시면, 가입하십시오
MQL5.com 웹사이트에 로그인을 하기 위해 쿠키를 허용하십시오.
브라우저에서 필요한 설정을 활성화하시지 않으면, 로그인할 수 없습니다.