MetaTrader 4용 기술 지표 - 53
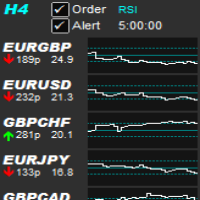
Allows symbols/currency pairs to be ordered based on a configured indicator, with the best performing symbols shown at the top. This helps you to select the symbol with better prospects from a given list of symbols. Can optionally alert when a symbol moves into the top two (configurable). Also shown is the number of pips that the symbol has moved in its current direction, allowing you to tell if you've 'missed the boat'. Further, a graph is shown, per symbol, of the indicator value over time all

The indicator MilkyWay is calculating and draws a blue or red ribbon as a trend and as a filter. In case the price is moving inside the ribbon you should not enter the market. In case you see a blue trend and the current price is above the blue ribbon than this is a good time to go Long. In case you see a red trend and the current price is below the red ribbon than this is a good time to go Short. Only 1 input parameter: nBars = 500; - number of Bars where the ribbon will appears.

This is a simple technical indicator that plots a line in a zigzag fashion using the Bill Williams Fractals indicator as reference. The mechanics in this indicator is as simple as this: from the latest available fractal in the chart it will trace a line to the next fractal in the opposite side of the price candles and so on until the older possible fractal in the chart is covered. This technical indicator does not have any input to configure.
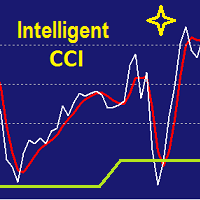
It is CCI indicator with very smooth and noiseless movement that calculates four levels of buy, sell, overbought and oversold dynamically. Professional traders know well that level of 100, 200 or -100 and -200 are not always right and need fine adjustments. This indicator calculates those levels dynamically by using mathematics and statistic methods in addition to shows divergence between indicator and price. Like original CCI, for best result you have better to set proper value for CCI period b

Advanced Bollinger Bands (BB) indicator. The standard Bands.mq4 indicator was complemented with a range of upper/lower band and signal of possible reverses.
Parameters: BandsPeriod - indicator period. BandsRange - period of determining a range. BandsDeviations - number of standard deviations. Averaging Fast Period - fast period of averaging. Averaging Slow Period - slow period of averaging.
Buffer indexes: 0 - Middle line, 1 - Upper line, 2 - Lower line, 3 - Upper range, 4 - Lower range, 5
This indicator creates more stable Aqua histogram, which crosses the zero line up and down indicating UP and DOWN trend for long and short positions. The indicator generates a pulse red signal, which crosses the zero line up and down more frequently than the histogram. You may use only the histogram for entering the market in the point where the histogram crosses the zero line. You may use only the red line for entering the market in the point where the red line crosses the zero line. You may us
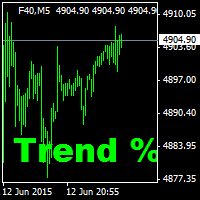
These indicators are suitable for scalper tradition. At least 5-10 pips of income should be targeted. The stop should be at least 11 pips. It is suitable to be used in brokers with not much spread. This indicator is used to determine the trend percentage. Trend direction is made in color. It has the indicator warning system: beep, e-mail and has three types of alerts, including messages to mobile phone. The position can be in 4 different corners of the screen. When trend value reaches the value
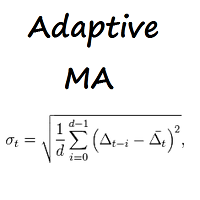
Adaptive MA 이동 평균. 계산 방법은 막대 정의에 사용된 모든 가격의 평균입니다.
표시기의 외부 설정에 대한 설명: MA_period - 지표 계산을 위한 평균 기간입니다. 권장 값: 5, 13, 21, 34. ma_method - 평균화 방법. 이동 평균 방법 값 중 하나일 수 있습니다. 0 - (SMA) 단순 이동 평균. 1 - (EMA) 지수 이동 평균. SMMA 2 - (SMMA) 평활 이동 평균. LWMA 3 - (LWMA) 선형 가중 이동 평균. 이동 평균. 계산 방법은 막대 정의에 사용된 모든 가격의 평균입니다.
표시기의 외부 설정에 대한 설명: MA_period - 지표 계산을 위한 평균 기간입니다. 권장 값: 5, 13, 21, 34. ma_method - 평균화 방법. 이동 평균 방법 값 중 하나일 수 있습니다. 0 - (SMA) 단순 이동 평균. 1 - (EMA) 지수 이동 평균. SMMA 2 - (SMMA) 평활 이동 평균.

Cardiogram Market 설정 설명: MA_period_fast - 빠른 이동 평균을 계산하기 위한 평균화 기간입니다. MA_period_slow - 느린 이동 평균을 계산하기 위한 평균화 기간입니다. price - 사용할 가격입니다. 가격 상수 중 하나일 수 있습니다. 0 - (CLOSE) 종가. 1 - (OPEN) 시가. 2 - (높음) 높은 가격. 3 - (낮음) 최저 가격. 4 - (MEDIAN) 평균 가격, (고가 + 저가) / 2. 5 - (일반) 일반적인 가격, (고가 + 저가 + 종가) / 3. 6 - (가중치) 가중 종가, (고가 + 저가 + 종가 + 종가) / 4. 방법 - 평균화 방법. 이동 평균 방법 값 중 하나일 수 있습니다. 0 - (SMA) 단순 이동 평균. 1 - (EMA) 지수 이동 평균. SMMA 2 - (SMMA) 평활 이동 평균. LWMA 3 - (LWMA) 선형 가중 이동 평균.
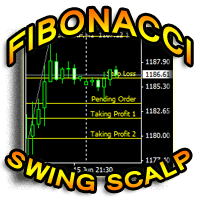
Fibonacci Swing Scalp (Fibonacci-SS) This indicator automatically places Fibonacci retracement lines from the last highest and lowest visible bars on the chart with an auto Pending Order (Buy/Sell), Stop Loss, Taking Profit 1, Taking Profit 2 and the best risk and reward ratio. This is a very simple and powerful indicator. This indicator's ratios are math proportions established in many destinations and structures in nature, along with many human produced creations. Finding out this particular a
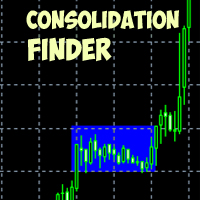
The indicator allows to find consolidations. It is meant for channel breakthrough. Easy to use, it has only three parameters: Minimum number of bars to analyze Consolidation tunnel Indicator color It works on all timeframes . Approximate settings are adjusted for H1 by default. Works on all currency pairs. This indicator does not repaint and is not recalculated. All screenshots are real!

This is a professional multi currency tool. Its main purpose is semi-automatic Forex trading following Elder's Triple Screen strategy. Its wide functionality and ability to quickly change some essential parameters makes it an ideal market interpretation tool, which is indispensable in the common trade analysis. Its main advantage is almost unlimited number of simultaneously analyzed instruments. If the potential technical limits of your monitor resolution allow, multiple indicators can be used.

This indicator shows data from 9 currency pairs by your choice from all 9 timeframes. If a digital value of the RSI is less or equal to DnLevel = 30 (or whatever number you decided to put), then a Green square will appear. This is (potentially) an Oversold condition and maybe a good time to go Long . If a digital value of the RSI is greater or equal to UpLevel = 70 (or whatever number you decided to put), then a Red square will appear. This is (potentially) an Overbought condition and maybe a go

The Trend Trade indicator displays assumed turning points of the price on the chart in the direction of the trend after correction. It is based on data of the Prise Reversal oscillator with the period 6 and indicators which characterize strength and availability of the trend. When the value of Prise Reversal is in overbought or oversold area (area size is set by a user), and the current trend is confirmed, the Trend Trade indicator draws an arrow pointed to the further assumed price movement.
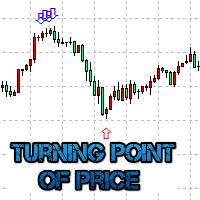
The Turning point of price indicator displays assumed turning points of the price on the chart. It is based on data of the Prise Reversal oscillator and standard ADX. When the value of Prise Reversal is in overbought or oversold area (area size is set by a user), and the value of the ADX main line exceeds the preset value, the Turning point of price indicator draws an arrow pointed to the further assumed price movement. This idea is described in the article Indicator of Price Reversal .
Indica

The presented indicator draws the pivot points for different timeframes – 4 hours, day, week and month. Before you leave, download the demo version of this indicator, evaluate its performance. After all, this does not oblige you to anything. And then you will see that it has the best price to quality ratio, buy it now and receive updates for free. In the new version, an information panel with control buttons is displayed on the screen. The "Symbol properties" information panel shows: Symbol - na

PROscalper is a perfect tool for traders who use the scalping strategy! It gives you the visual view of the main Stoploss, Takeprofits and current/last pips on the chart and also in the integrated menu. So with this overview you have the high quality indicator for scalping! You can use PROscalper on any timeframes and on any pairs, but lower timeframes are recommended. To improve results, you can combine PROscalper with a Trendindicator (TrendfollowerSR) to get a dual confirmation for the entrie

This indicator displays a complete tick chart with two optional moving averages, and makes paying attention to sub-m1 price data really easy. [ Installation Guide | Update Guide | Troubleshooting | FAQ | All Products ] Identify price spikes easily The blue line is the ask price The red line is the bid price The indicator doesn't lose tick data when reloaded It implements two optional moving averages The indicator is non-repainting
Input Parameters
Display Moving Averages: Display or hide the

The indicator compares quotes of the current symbol and a synthetic quote calculated from two specified referential symbols. The indicator is useful for checking Forex symbol behavior via corresponding stock indices and detecting their convergence/divergence which can forecast future price movements. The main idea is that all stock indices are quoted in particular currencies and therefore demonstrate correlation with Forex pairs where these currencies are used. When market makers decide to "buy"
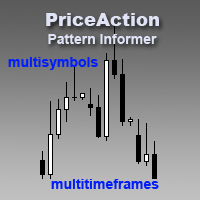
Pattern Informer is a convenient indicator for recognizing Price Action patterns on selected instruments. It presents a convenient overview form of all instruments on three timeframes (Н1, Н4, D1) in a single chart. It's an indispensable tool for manual trading based on the Price Action method. Pattern Informer recognizes the following patterns: PinBar Inside Bar Outside Bar DBLHC DBHLC TBL TBH
Indicator Parameters symbols_list - the list of currency pairs separated by commas for which pattern

The Volume Spike indicator is a useful tool to identify the directional market's intention.
How Does It Work: The Volume Spike indicator identifies the volume peaks and creates a sensitive rectangle equipped with Alert and Warning Pop Up that it suggests the market's direction. This tool has the ability to select the time frame on which to do the analysis of volume and it gives a great visual signal colored into rectangle. The indicator can identify valid market signals but it can also suggest

표시기는 두 부분으로 구성됩니다. 1부: 색상 양초가 주요 추세를 보여줍니다. 컬러 캔들(Color Candles)은 컬러 캔들스틱으로 시장 상태를 파악하는 것입니다. 스크린샷에서 보듯이, 색상이 아쿠아(Aqua)라면 시장은 매수 주문을 해야 하거나 매도 주문을 종료해야 하는 상태입니다. 색상이 토마토라면 짧은 주문을 하거나 긴 주문을 종료할 때입니다. 색상이 변경되는 경우 완료될 때까지 기다리는 것이 좋습니다(현재 막대가 닫힐 때까지). 파트 II: 밴드 그리기 안쪽 밴드는 안전 구역으로 정의되고, 바깥쪽 밴드는 마감 주문용으로 정의됩니다. 아래와 같은 거래 전략: 색상이 아쿠아이고 가격이 내부 밴드에 있는 경우 장기 주문을 하고, 가격이 외부 밴드를 넘으면 주문을 마감할 시간입니다. 색상이 토마토이고 가격이 안쪽 밴드에 있으면 짧은 주문을 하고, 가격이 바깥쪽 밴드를 넘으면 주문을 마감할 시간입니다. 참고 : 가격이 내부 밴드에 있을 때 진입 시장에만 해당됩니다. 이는 매우

This indicator builds so called "random walk" bands: on every bar it finds maximal or average distance between current price and multiple expanding parabolic curves starting at predefined number of bars in the past. If you like Bollinger bands or Envelopes you may find this indicator useful as well. As you may know, price movements are very similar to random walk time series (specifically, Gaussian random walk), yet they do effectively break the hypothesis of randomness. One of the features of t
The main rule of the profitable trading is opening trades in the direction of a trend. You can define the current trend using fractal analysis. The Important Zone ResSup indicator displays important price support and resistance levels on the chart. The breakthrough or bounce from those levels shows further price direction. The data panel allows you to track the current trends on all timeframes. The current timeframe's important level values are shown in the comments. The indicator can be useful

This indicator allows you to see the strength of the trend on all timeframes. It can be used for all currency pairs. The indicator can be displayed in the form of a column (from left to right): status buy / sell / strong buy / strong sell, strength of the trend in percentage, pips last candle, body candle now, remaining time, and the timeframe of M1 to MN. Information contained below (from left to right): total trend percent, sell percent, buy percent.

The National Prise Reversal indicator represents an oscillator of a national currency (options: USD, CAD, CHF, JPY, GBP, EUR, AUD . It is based on already known Prise Reversal oscillator. But it analyzes particularly movement of a selected national currency on pairs with other specified currencies. Basing on these data the National Prise Reversal indicator determines overbought or oversold of the selected currency. When the indicator is in the overbought zone, it indicates possible weakening of

This indicator is meant for Harmonic Traders, it helps them in identifying the formed patterns by analyzing the market past data, looking for Harmonic Patterns. The Patterns that this indicator can detect are: AB=CD Butterfly Gartely Crab Bat The indicator shows the following: The completed pattern, with the critical zone highlighted in Gray box The suggested 3 take profit levels (in green) The Suggested Stop Loss level (in Red) The formed pattern ratios can be checked by hovering the mouse on t

The Correlation Matrix indicator shows the actual correlation between the selected instruments. The default setting is set to 28 currency pairs, gold, and silver, but the indicator can compare any other symbols.
Interpretation of the indicator Positive correlation (correlation is above 80 %). Negative correlation (correlation is below -80 %). Weak or no correlation (correlation is between -80 and 80 %).
Main features The indicator shows the actual correlation between the selected instrum
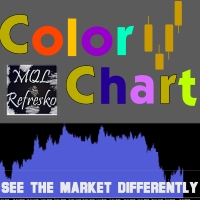
Visualize your charts differently in MetaTrader 5. The product is good for comparing the prices, since the indicator draws High, Close, HLC, etc. It is useful when applied with other indicators (like MACD). This simple indicator colors the entire space below the chart allowing you to see the market with greater clarity. You will see the actual price, trends, and the market behavior.
Indicator parameters: Applied_Price : From this option you can select the type of price you want to draw with t

DailyBreakouts is the perfect tool for traders who use the breakout strategy! First, DailyBreakouts analyzes the last day; then, the beginning of the new day. After that, it gives you the signal for the breakout . With the integrated menu, you have the perfect overview of the pips, breakout zones, stop loss, and take profit. DailyBreakouts works on M30 and H1 timeframes, because it gives you one signal per day - so it is pointless to use lower or higher timeframes. To improve results, you can co
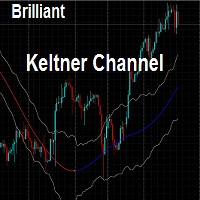
This indicator draws the Keltner Channel for any time frame Displayed on the current Time frame allowing user to choose which moving average type for the calculations. The available Moving Averages are: Simple Moving Average (MA_Mode=Mode_SMA)
Exponential Moving Average (MA_Mode=Mode_EMA) Smoothed Moving Average (MA_Mode=Mode_SmoothedAverage) Linear Weighted Moving Average (MA_Mode=Mode_LinearWeighted) Tillson's Moving Average (MA_Mode=Mode_Telsons) Moving Average line is coded into RED or BLUE

The Pairs Cross indicator is a unique tool for negatively correlated trading instruments, such as EURUSD and USDCHF currency pairs. It is based on a concept called pairs trading (or spread trading). Our indicator compares the strength of two currency pairs that are inversely correlated and quickly tells you when it’s time to buy the first pair and short a second pair, and vice versa. This is a straightforward approach to trading currency pairs that works very well.
How to you use the Pairs Cr
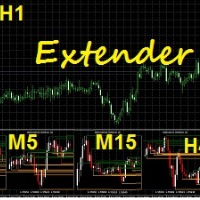
Extender represents a multifunctional indicator which can be used for own investing strategy or can be easily adopted as a part your own investing strategy. After installation as a secondary indicator you can see a multiframe visualization of selected timeframes of analyzed underlying asset. The multiframe visualization has a few modifications which can be selected in section Indicator Setup.
Input parameters Indicator setup Timeframes – definition of selected timeframes for visualization, e.g

Breakeven Level indicator shows the breakeven level of your buy and sell orders. Useful if you have several open positions. Apart from demonstrating breakeven level, the indicator displays additional information concerning your trading instrument in the upper right corner (balance, equity, number of buy orders, sum of buy orders, number of sell positions and sum of sell orders). Breakeven level for sell orders has red color, buy - blue color.
Indicator Parameters Color of the text on the chart
Control Trading Intraday Zones shows the best candles-zones to trade intraday. Shows maximum of the day and minimum of the day zones, adaptable to each symbol, gives you a guide to know the best zones to make the best intraday trades. Indicator goes from -100 (lowest of the day) to 100 (highest of the day), when 0 is middle price of the day. For example, when price reaches high of the day the indicador will continue showing max levels even the price continue rising, because indicator limits to 1

High Low Open Close Levels The indicator HLOC is a good ally to correctly identify the appropriate trend of price. The indicator is designed to be minimally invasive and it shows a visual and sound aid in order to take decision on the market. The indicator is equipped with sound alert and window alert in order to have a reminder of the price movements. We suggest you watch the video below to evaluate its operational benefits.
Input values: Show Level (true/false) TimeFramePeriod (refer to line

Informational indicator which shows: Swap Price under/upper Open for every Time Frame Spread Time to close the current candle Broker Time Net Change: delta in percentage from Open (MN-W1-D1) Tick Value Volumes Info for every trades open: Lots Breakeven Profit Buy-Profit Sell Equity Symbol Positive values are green and negative values are red (modifiable in input).
Inputs: View BE line (enable/disable) View all Symbol (shows the list of symbol) Color (for every text) Line Color (for BE line)
This indicator provides you with MACD formula applied to volume-aware Accumulation/Distribution and OnBalance Volumes indicators. In addition to tick volumes it supports special pseudo-real volumes, synthesized for Forex symbols where real volumes are unknown. More details on the volume surrogates may be found in description of another indicators - TrueVolumeSurrogate and OnBalanceVolumeSurrogate (algorithm of the latter is used internally in MACDAD for AD and OBV calculation before they proceed

Trend Hunter 는 Forex 시장에서 작업하기 위한 추세 지표입니다. 지표의 특징은 가격이 추세선을 약간 뚫어도 신호를 변경하지 않고 추세에 따라 자신있게 움직인다는 것입니다. 표시기가 다시 그려지지 않고 바가 닫힌 후 시장 진입 신호가 나타납니다.
트렌드 헌터는 공정한 지표입니다. 신호의 잠재적 이익을 표시하려면 표시기 신호 위로 마우스를 가져갑니다.
손절매가 짧은 거래의 경우 추세를 따라 이동할 때 추가 지표 신호가 제공됩니다.
Trend Hunter Scanner 는 다른 통화 쌍 및 기간에 대한 추세의 방향을 평가하는 데 도움이 됩니다.
지표는 차트 아래에 있는 편리한 패널을 통해 제어됩니다.
MT5 버전 https://www.mql5.com/ko/market/product/16517
옵션 Alert - 터미널에 알림 표시 EMail - 이메일 알림 보내기 Push - 스마트폰에 푸시 알림 보내기 Style - 표시기 그리기 스타일 Sca

In the stock market technical analysis, support and resistance is a concept that the movement of the price of a security will tend to stop and reverse at certain predetermined price levels. Support and resistance levels can be identified on any timeframe. However, the most significant ones are found on the higher time frames, such as daily, weekly, and monthly. This indicator using the weekly OHLC data to identify the relevant levels. This is a support and resistance indicator and providing majo

Parabolic Converter is and analogue of the Parabolic indicator for МТ4 which can automatically recalculate parameters of Time Frame specified in settings for lower time periods. It has a Notification System which triggers when the price movement direction is changed. For example: if we set Time Frame 1 Hour to H1 and M30, M15, M5 and M1 contained therein, we can see the indicator's readings corresponding to H1 (fig.). At that, if we add one more Parabolic on the same chart (of several charts) wi

Charles Henry Dow felt that if the industrial average and the railroad average both moved in the same direction, it meant that a meaningful economic shift was occurring. In brief, this indicator bases on the Dow's theory. It can create an index of market symbols, almost anythings index. For example: Index of the Euro, Index of the Great Britain Pound, Index of the Japanese Yen, Index of the Swiss Franc, Index of the Gold, Index of the New Zealand Dollar, Index of the Australian Dollar, Index of

BreakEven Line is a very useful and easy to use indicator. In case of multiple positions opened on the same instrument, the indicator shows the breakeven point where it is possible to close the positions. Its graphic simplicity makes it an unobtrusive and customizable tool. You can enable/disable a line on a chart, so you can make the indicator invisible. Inputs Show cumulative BE (line on/off) Breakeven line color (to change the line color) Breakeven line style Breakeven line width Show short B

Charles Henry Dow felt that if the industrial average and the railroad average both moved in the same direction, it meant that a meaningful economic shift was occurring. In brief, this indicator bases on the Dow's theory. It can create an index of market symbols, almost anythings index. For example: Index of the Euro, Index of the Great Britain Pound, Index of the Japanese Yen, Index of the Swiss Franc, Index of the Gold, Index of the New Zealand Dollar, Index of the Australian Dollar, Index of
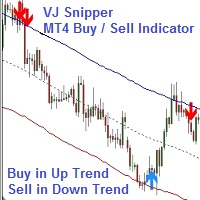
VJ Sniper - MT4 Buy / Sell Indicator: This Indicator is as simple as Buy in Up Trend & Sell in Down Trend. There are 2 Support / Resistance lines for choosing the best Entries. Background: Any in-built indicator of MT4 does not work as stand alone such as Stochastic, CCI or DeMarker etc. But combination of them with trend projection work & give the best results for Trading entries. So this Indicator is blended to give the best results whi
The indicator searches Price Action patterns and puts corresponding labels on a chart. It can display only certain selected patterns.
Determined Patterns: Inside Bar. Determinative bullish bar Inside Bar. Determinative bearish bar BUOVB (engulfing). Bullish setup BEOVB (engulfing). Bearish setup DBLHC. Bullish setup (bars with similar Lows and higher closure) DBHLC. Bearish setup (bars with similar Highs and lower closure) Pin Bar. Bullish setup Pin Bar. Bullish setup Pin Bar. Bearish setup Pi

Advanced ideas of the popular MACD indicator: It detects and displays classic and reverse divergences (three methods of detecting divergences). It uses different color to highlight an uptrend and a downtrend. Two methods of determining a trend: а) MACD crosses the 0 level (classic signal); б) MACD crosses its own average (early signal). This is a multi-timeframe indicator: it can display MACD data from other timeframes. Two methods of drawing: classic histogram and line. It generates sound and v

You can fins our other products from link : https://www.mql5.com/en/users/drbastem/seller Also, you can ask all your questins from email : haskayafx@gmail.com or mobile : +90 530 867 5076 or @MehmetBastem on telegram application This indicator is used to determine the trend. Standard Osma indicator is used. It has the indicator warning system: beep, e-mail and has three types of alerts, including messages to mobile phone. It shows the best performance on the chart of 5 minutes. When the

Volume POC
The Volume POC indicator displays important levels. You can use it as an independent trading system. Warning functions at a candle closing allow you to have some information on the market direction. The graphical display is simple and effective. The levels reported are the result of the study of historical market volumes. These levels give excellent entry points and excellent levels of support and resistance. You can use the indicator also on very low timeframes. It is suitable for
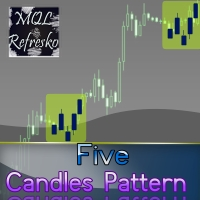
The "Five Candle Pattern" indicator is a novel way to see the market, because with it we can compare and/or seek training or the pattern of the past 4 or 5 Candles, and identify them in the same graph, to view your behavior at an earlier time. The indicator creates a pattern of those 4 or 5 candles and searches backward, identifies, and marks the same formation or pattern. With that information you adjust the strategy that is operating, or create a new one, because you can compare the past devel

The Open All indicator uses a simple market information that is "Open Candle". This tool is able to show all the openings of all time frames in order to extract information of strength and trendy. You can display 28 instruments with relative time frame interior for a total of 252 informations. The display is fully customizable, you can choose either the symbol and enable/disable Time Frames. Using it correctly you could get valuable aid to intercept correlations and turning points in the market.

This is a moving average which can move not only to the right/left, but also up/down. You can also select a mode of displaying the indicator (as a line or as dots) and all other settings of a standard moving average. If you overlay several indicators in one window, you can clearlier determine price channels setting each border individually.
Settings Line_or_Dot - mode of displaying the indicator: true - as a line, false - as dots; MA_period - moving average period; MA_shift_X - number of candl

The indicator colors bullish, bearish and doji candles. Also, the amount of candles (bullish, bearish and doji) for the last N days is calculated. You can select colors for both bodies and shadows of candles. You can also enable coloring only candle bodies. МetaТrader 5 version: https://www.mql5.com/en/market/product/11649 Parameters color bulls = color of bullish candle bodies color shadow bulls = color of bullish candle shadows color bears = color of bearish candle bodies color shadow bears =
The indicator calculates WPR formula on volume-aware indicators Accumulation/Distribution , OnBalance Volume , or Price Volume Trend . WPR range is moved into positive domain [0..1] for convenience.
Parameters WPR - period of WPR, by default 24; Base - type of the underlying indicator: AccumulationDistribution (by default), OnBalanceVolume, or PriceVolumeTrend; Price - applied price type for OBV and PVT, by default - Close; it's ignored in case of AD;
Screenshots On the screenshots below th

YF-Meter indicator help you to find the fastest speed up currency pairs.
While the US news are released, non-US currencies rising up or dropping down at the moment.
It is important to consider "the opportunity cost" of opening the positions.
If we can find the fastest rising up or dropping down currency pairs, that would improve our trading. This idea comes up with "Newton's laws of motion", different from the traditional volatility measurement.
After adjustment by the unique filter(the digi

Trend Trade indicator is based on ADX indicator to define long/medium/short trend and good entry signals. The product supports virtual trade on chart to show where/when should we make an entry/exit. It works very well on D1 or above. The indicator is efficient on GOLD and CFDs. Alert_Settings = "+++++++++++++++++++++++" SendMailMode = true - Send email SendNotificationMode = true - Send notification to your phone AlertMode = true - Sound alert Show_Virtual_Trades = true - Show virtual trades Sin

You can fins our other products from link : https://www.mql5.com/en/users/drbastem/seller Also, you can ask all your questins from email : haskayafx@gmail.com or mobile : +90 530 867 5076 or @MehmetBastem on telegram application This indicator is used to determine the trend. Standard Three Moving Average and ADX indicators are used. It has the indicator warning system (audio, e-mail) and three types of alerts, including messages to mobile phone. It shows the best performance on M5. When

This indicator is used to determine the trend. Standard Three Moving Average and ADX indicators are used. It has the indicator warning system (audio, e-mail) and three types of alerts, including messages to mobile phone. It shows the best performance on M5. When the trend value reaches the value set, the warning system is activated. This indicator works only with Forex symbols.
Inputs SoundAlarm = true - Sound Alert Sendmail=true - Send an e-mail in case of a buy or sell signal Sendnotificatio

You can fins our other products from link : https://www.mql5.com/en/users/drbastem/seller Also, you can ask all your questins from email : haskayafx@gmail.com or mobile : +90 530 867 5076 or @MehmetBastem on telegram application This indicator is used to determine the trend. Standard MACD indicator is used. It has the indicator warning system: beep, e-mail and has three types of alerts, including messages to mobile phone. It shows the best performance on the chart of 5 minutes. When the

i-Regression Channel generates regression channel: Linear regression channel consists of two parallel lines located at the equal distance from the linear regression trend line. The distance between the channel borders and the regression line is equal to the value of the highest close price deviation from the regression line. degree - degree of regression, changes from 1 to 61; kstd - regression channel width; bars - the number of bars for the channel calculation; shift - the channel horizontal s

The indicator Net Change is a very useful tool able to extrapolate a percentage in order to have a real reference on the performance of the instrument. This indicator is designed to show the main values: you could monitor the Daily, Weekly, Monthly, Quarterly, Semi-annual and Annual percentages. A necessary tool for those who want to really explore the quantitative logic of the market.
Input values SYMBOLS SETTINGS Use_Only_Current_Symbol (true/false): Permits to manage only current symbol on

The Best and Worst indicator (similar to Net Change Indicator) has the peculiarity of being a dynamic indicator. It seems a very Stock Exchange Indicator. This means that it is able to draw up a list and put in order the best and worst instruments in descending order. You can choose to show the percentage of any Time Frame: 1M, 5M, 15M, 30M, H1, H4 etc ... This instrument could really give great suggestions on your trading in order to center the right time and to have a total view of the markets

Arrows appear after Reversal-Pattern and when the confirmation-candle reaches its value, it won't disappear (no repaint). but with fix settings no additional settings necessary Entry : immediately after arrow Stop loss : a few pips above the high of the arrow - candle / below the low of the arrow - candle Take Profit : at least the next candle / move to break even after candle closed / trail the SL works on : Major Forex-pairs / M15 and higher time-frames The Value of the confirmation-candle =>

Future Price 미래 가격 - 표시기는 견적 내역에서 일치 항목 검색을 기반으로 미래 가격 움직임에 대한 예상 옵션을 보여줍니다. 표시기는 두 가지 모드로 작동합니다. 첫 번째 모드는 지정된 수의 옵션을 열거 및 표시하고 두 번째 모드는 하나의 설정된 옵션을 표시합니다.
설정 설명 Static_VARIANTS = 0; - 표시할 원하는 옵션을 설정합니다. = 0이면 옵션 반복이 작동합니다. TOTAL_VARIANTS = 20; - 옵션 세트의 수를 설정합니다. 30개 이하를 권장합니다. Time_Seconds_Show = 3; - 주어진 세트에서 하나의 옵션의 최소 표시 시간, 최대 시간은 다음 견적의 도착 시간으로 제한됩니다. Future_Bars = 50; - 앞으로 표시되는 막대의 수는 60개 이하를 권장합니다. History_Bars = 636; - 기록에서 분석된 막대의 수

The indicator is based on Moving Average to define the trend, then it finds a good entry point and follows the trend. We will keep open on a new signal until the trend is changed, and all trades exit on an opposite signal. The exit point is a bit late relative to the highest profitable point (at top/bottom), but it is the best point to exit your trades. Keep the trades, which are moving the right direction to get a high profit, and stop wrong trades as soon as possible when the trend is changed

The indicator compares Fractal and Zigzag indicators to define hard Support and Resistance. The arrow signal appears when a new support or resistance emerges or when the price breaks through Support and Resistance zone. This indicator is efficient in conjunction with a rebound and breakout strategy. It works well on H4 and D1 for all pairs.
Settings BarCounts = 200; FastPeriod = 7 - fast period SlowPeriod = 14 - slow period Show_SR = true - show support/resistance Show_Arrows = true - show up/
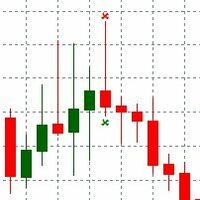
PinBar indicator is an Indicator identifies price reversal, pattern and timely identifies that price trend is changed. The Trend change is immediately identified over the chart. Alert is send over the Chart and Email address. Indicator generated Signal Price is displayed over the chart near the PinBar. Please make sure to use on Higher time frames if you are swing trader. for day traders who want to use M30 or M15 time frames, Take profit should be kept minimal. Lower than M15 is not recommende

Using high-volatility channel breakout-style trading systems has historically worked well across major currency pairs, show promise in determining the opportune time to trade the channel breakout trading strategy. This Breakout Strategy may look simple, but it is good follow trade trader strategy.
Setting: Channel Periods: default 20 BarsCount: bars count in history Alert_Settings = "+++++++++++++++++++++++" SendMailMode = true - Send email SendNotificationMode = true - Send notification to yo

Volume Delta is a very powerful indicator that reads the supply on the Market. It calculates the Delta from movement of the price and the difference of BUY and SELL Tick volumes. Its special structure allows you to get all timeframe values available on the MT4 platform. A good observation of this instrument can suggest great entry points and possible reversal. We are confident that this tool will help you to improve your trading timing. See also for MT5: https://www.mql5.com/en/market/product/5
The indicator uses 2 Moving Average: 1 fast EMA and 1 slow EMA to define trend, reversal signal and breakout point. Reversal Signal comes on open time, it can be used as scalping signal for short time, but be careful with this signal because it may be an anti-trend signal, the indicator tries to catch reverse point. Breakout signal is where support or resistance was broken out, the reversal signal has failed. Breakout signal is stronger than the Reversal Signal. We can use support/resistance lev
MetaTrader 마켓은 거래 로봇과 기술 지표들의 독특한 스토어입니다.
MQL5.community 사용자 메모를 읽어보셔서 트레이더들에게 제공하는 고유한 서비스(거래 시그널 복사, 프리랜서가 개발한 맞춤형 애플리케이션, 결제 시스템 및 MQL5 클라우드 네트워크를 통한 자동 결제)에 대해 자세히 알아보십시오.
트레이딩 기회를 놓치고 있어요:
- 무료 트레이딩 앱
- 복사용 8,000 이상의 시그널
- 금융 시장 개척을 위한 경제 뉴스
등록
로그인
계정이 없으시면, 가입하십시오
MQL5.com 웹사이트에 로그인을 하기 위해 쿠키를 허용하십시오.
브라우저에서 필요한 설정을 활성화하시지 않으면, 로그인할 수 없습니다.