Very simple indicator to draw lines on a chart

지표 스크립트

작업 종료됨

실행 시간 3 일
고객의 피드백
Cooperative, knowledgeable, efficient, diligent. Thank you.
피고용인의 피드백
It was a pleasure dealing with him.

명시

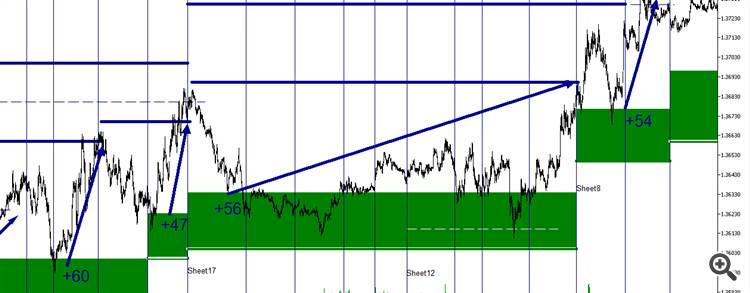
You will be creating an indicator, SRLevels for MQL 5. The purpose of the indicator is to download support / resistance information and display it on a chart, like this but much nicer-looking: 

(Please ignore the arrows and numbers; they are not needed).

Example chart

This is what you will need to do:

  1. Create a download manager.
    • The purpose of the download manager is to manage data downloading for the all charts that have the SRLevels indicator attached.
    • It shall be a global, static script.
    • When an indicator initialises, it will register itself with the download manager and the download manager will begin to download data for that instrument, every one minute.
    • When an indicator finalises, it will notify the download manager and the download manager shall stop downloading data for that instrument, unless there is another indicator still open that needs the data.
    • Data is downloaded from this URL: http://68.71.134.144:11000/mt.aspx?job=getLevels&instrument=EUR/USD&numRecords=100&user=myusername&pass=mypassword.
    • Username and password are configurable in the indicator settings.
    • I can supply you with a script you can use or modify for downloading data from the internet.
  2. Each line of data is in format: date time,Long|Short,Pivot,Target1,Target2
  3. For each line of data:
    • A vertical line is to be drawn at the timestamp. If it is the first Long or the first Short signal, then it is to be slightly thicker for emphasis. The vertical lines shall be color-coded for whether the signal is to long or short.
    • A horizontal line is to be drawn at the pivot, (which is like a stop loss point), and the two targets.
    • A rectangle (or zone) is to be drawn from the pivot a certain percentage of the way to the first target. On the chart illustrated above, the zone is drawn using 30%. The percentage is to be configurable in the indicator options. The zone is to be color-coded according to whether it is a signal to long or short.

  4. List of configuration items (You may include others that you think of)
    • Username / password
    • numRecords to download
    • Zone percentage (default 30%)
    • All colors / drawing options

You will supply the source code when the job is finished.

I will pay $15 for the indicator. If you do a good job, and the graphics look really nice, I will give you another $15 bonus. 

Please contact me on skype. My skype id is "benjaminboyle". I'm usually online Monday - Thursday. My timezone is GMT+10

Thanks in advance :)
응답함

1
개발자 1
등급
(336)
프로젝트
620
38%
중재
39
23% / 64%
기한 초과
93
15%
무료
비슷한 주문
Hello I'm trying to fix a indicator that I have, It's a .ex4 file, Can I just code a new indicator because I only have a failed version of it in a ex4 file. Here are the three files. They are EX4 files. So i wanted to have a trade panel that can fill up the whole screen where it shows all the pair symbols. MTF_TMA_Harmonic ex4 file is exactly what I'm looking for however the ex4 file for some reason doesn't work
I have a machine learning library in MT5 that I want to make an indicator with… You think you can help me? My strategy is simple... Predicting the Daily, Weekly, and Monthly High, Low, and Close prices... Then BUY @ LOW and SELL @ HIGH
My EA places orders when an arrow appears according to the pz day-trading indicator. 1) I need to change the indicator, so that it places orders when the stock indicator arrow appears. All other EA conditions remain the same. 2) I need it to place orders when the candle turns colored according to the Pvsar indicator. The only change is that for pvsra I need a buy order to be placed above the high of the candle that
Hello there, I'm trying to fix a indicator that I have, It's a .ex4 file, Can I just code a new indicator because I only have a failed version of it in a ex4 file. Here are the three files. They are EX4 files. So i wanted to have a trade panel that can fill up the whole screen where it shows all the pair symbols. MTF_TMA_Harmonic ex4 file is exactly what I'm looking for however the ex4 file for some reason doesn't
Hello I'm trying to fix a indicator that I have, It's a .ex4 file or Can I just code a new indicator because I only have a failed version of it in a ex4 file. Here are the three files. They are EX4 files. So i wanted to have a trade panel that can fill up the whole screen where it shows all the pair symbols. MTF_TMA_Harmonic ex4 file is exactly what I'm looking for however the ex4 file for some reason doesn't work
Hi everyone I have a question, is there anyone who can rewrite the code from tradinvivew pineditor to mql5 meta trader? It is about 150 line. My strategy has 50% success rate with RR 2,6. Tested for last one year, strategy works only in bull market. This is trading on gold, unfortunately I am not in the best financial position, in return I would send you the code, if you don't like it I understand that you will stop
Editing of strategy 30 - 60 USD
I have a strategy that i would like edited. I have a strategy where right now it takes profit at the next high or low. That can be removed if necessary. The SL is set using the current RSI Band Gap. I'd like the same to be done for the TP. You'll see in the settings that I have a SL and TP buffer. I would also like for those to be kept the same but again I just want the TP to be the RSI Band Gap. It'll make more
need a professional developer to modify my current indicator. Need to add time frame parameter with true .false option. Which i set true show only those TF signal and when all signal match with the current TF ( to enter trade). Alert get generated. Price is non negotiable .please don't respond if you don't agree to price. Thank you
create a scanner for find bos and choch indicator on the chart, I want the indicator based on line charts rather than candlesticks .the indicator can scanner all symbols and all timefimes when i want. Create a panel that displays symbols, time and indicates whether it is bos or choch. the scanner can alert to my phone terminal. If you are interested please contact me
I'm looking for a skilled developer who can produce an indicator and trading bot for the following specification: Input parameters Parameter Data type Range start time Time Range end time Time Range buffer Number pips Range colour Colour EMA Cross EMA 1 EMA 2 Period 50 200 Days to include Mon Tue Wed Thur Fri Tick box to select Entry on close TF Time Frame 5, 10, 15, 30 Mins 1hr, 4hr Max time to enter Time

프로젝트 정보

예산
15 - 30 USD
개발자에게
13.5 - 27 USD
기한
에서 1  5 일