İş tamamlandı
İş Gereklilikleri
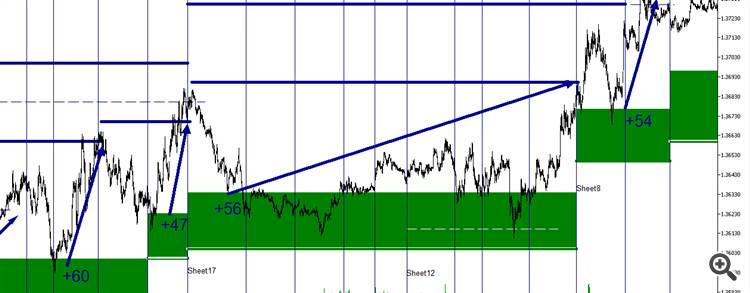
You will be creating an indicator, SRLevels for MQL 5. The purpose of the indicator is to download support / resistance information and display it on a chart, like this but much nicer-looking:
(Please ignore the arrows and numbers; they are not needed).
This is what you will need to do:
- Create a download manager.
- The purpose of the download manager is to manage data downloading for the all charts that have the SRLevels indicator attached.
- It shall be a global, static script.
- When an indicator initialises, it will register itself with the download manager and the download manager will begin to download data for that instrument, every one minute.
- When an indicator finalises, it will notify the download manager and the download manager shall stop downloading data for that instrument, unless there is another indicator still open that needs the data.
- Data is downloaded from this URL: http://68.71.134.144:11000/mt.aspx?job=getLevels&instrument=EUR/USD&numRecords=100&user=myusername&pass=mypassword.
- Username and password are configurable in the indicator settings.
- I can supply you with a script you can use or modify for downloading data from the internet.
- Each line of data is in format: date time,Long|Short,Pivot,Target1,Target2
- For each line of data:
- A vertical line is to be drawn at the timestamp. If it is the first Long or the first Short signal, then it is to be slightly thicker for emphasis. The vertical lines shall be color-coded for whether the signal is to long or short.
- A horizontal line is to be drawn at the pivot, (which is like a stop loss point), and the two targets.
A rectangle (or zone) is to be drawn from the pivot a certain percentage of the way to the first target. On the chart illustrated above, the zone is drawn using 30%. The percentage is to be configurable in the indicator options. The zone is to be color-coded according to whether it is a signal to long or short.
- List of configuration items (You may include others that you think of)
- Username / password
- numRecords to download
- Zone percentage (default 30%)
- All colors / drawing options
You will supply the source code when the job is finished.
I will pay $15 for the indicator. If you do a good job, and the graphics look really nice, I will give you another $15 bonus.
Please contact me on skype. My skype id is "benjaminboyle". I'm usually online Monday - Thursday. My timezone is GMT+10
Thanks in advance :)
