트레이딩 로봇 주문 방법을 보십시오
주문을 실행하거나 포스트하기 전에 규칙을 읽으십시오
MQL5 및 MQL 4의 트레이딩 로봇을 주문하는 방법
로봇을 주문하기 위해샘플 요구 사항을 보십시오
카테고리의 새로운 주문:
550+ USD
30 - 300 USD
30+ USD
30+ USD
명시
Hi,
I’m currently working on a trading system that should be automated. The first step will be to code an indicator for detecting special/important support and resistance areas on any forex chart and suggesting appropriate SL/TP levels for making the corresponding BUY/SELL market orders. Said indicator needs complex calculations and a lot of input parameters for the user in the GUI. Therefore the budget is up to $ 100 and I need the final product (incl. bug fixes) soon resp. within the next few days.A detailed description of the requested indicator’s functionality is attached in the postscript (see below).
Who can do this VERY accurately?
[An advanced mathematical understanding is strongly required!]
Ben
PS: Description of the requested indicator:
MT4 Indicator “SupRes_v1”
Concept:
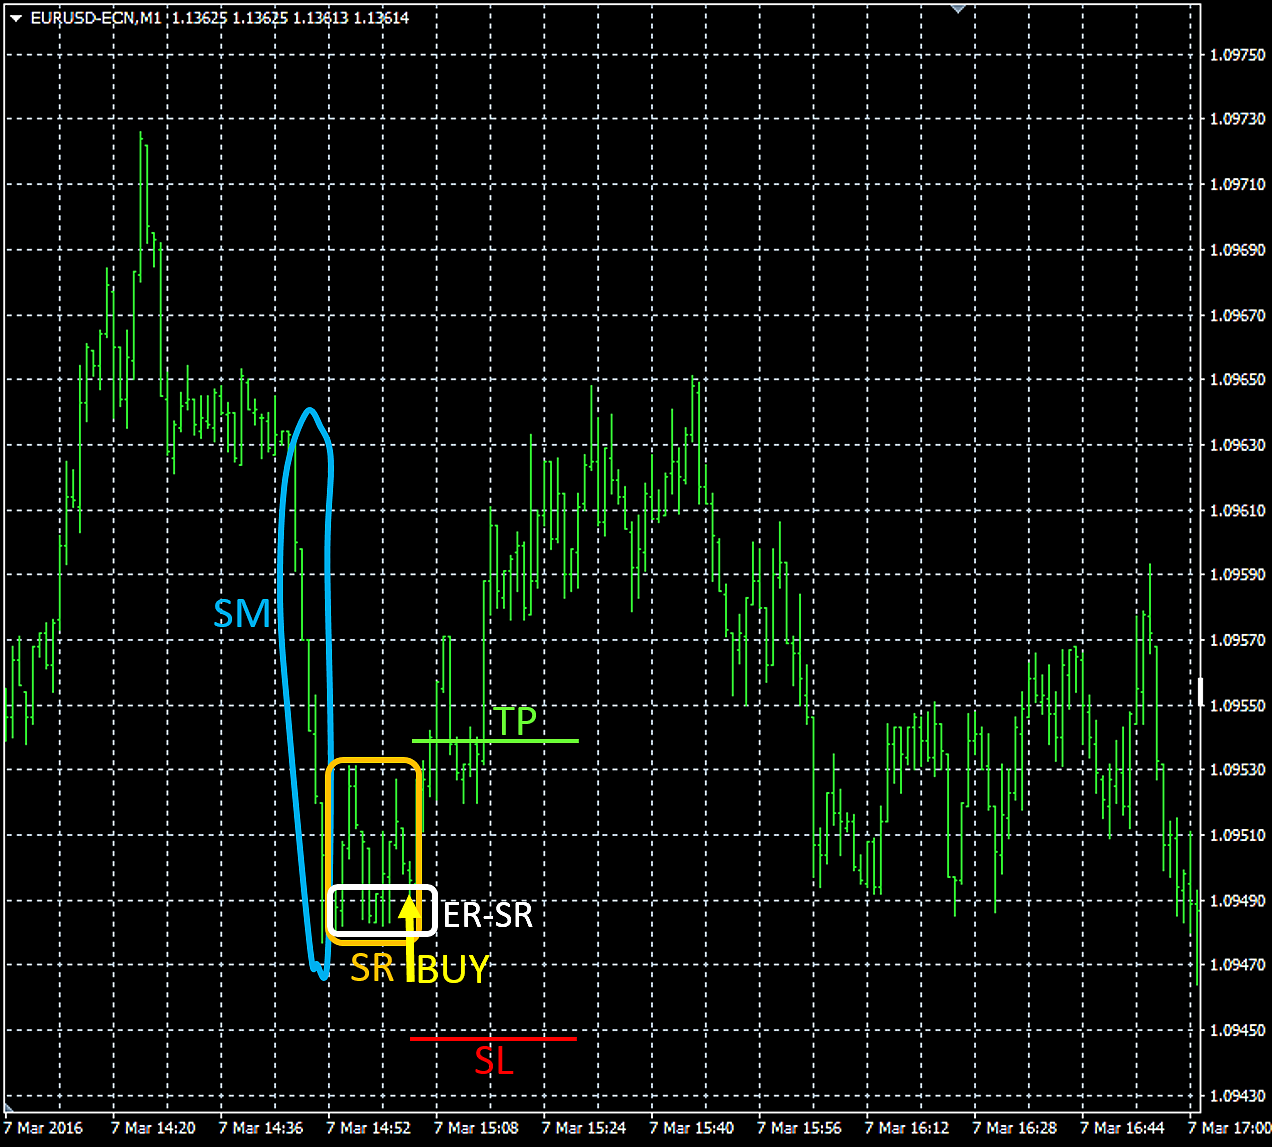
“SupRes_v1” detects strong up/down price movements followed by a support/resistance area and draws a down(sell.order) / up(buy.order) arrow contrary to said strong movement. The requested indicator also plots lines for suggested fixed SL/TP levels along with said arrows that symbolize the recommended trading direction.
It is recommended to open the attached image in a separate browser tab etc. for a better understanding when reading the detailed description below.
Description in detail:Stage 1:
The fx chart resp. price makes a strong up(sell.order) / down(buy.order) movement for at least n bars. A “strong movement (SM)” must be calculated as follows:
SM = [(Difference in points between the highest high and the lowest low of the last n closed bars)/n]/[SUM(length of n bars)]
In the Indi’s GUI the user must also be able to define the minimum value for SM:
-> Minimum value of SM: 0.55 [etc.]
-> Minimum number n of SM bars: 5 [etc.]
If e.g. SM = 0.50, the strong movement’s bars’ “overlapping value” must be averagely at least 50 %.
If e.g. SM = 1.00, the strong movement consist of consecutive “non-overlapping” bars.
If e.g. SM > 1.00, the strong movement’s bars must have partly gaps between each other.
The indi must permanently scan the chart’s last n closed bars and recognize if all conditions for a valid “SM” are fulfilled.
Once a SM is detected the indi must “note” the value resp. price of SM’s lowest low and highest high and their positions (time/date). From then on the indi must continually check resp. recalculate if the movement stays “strong” (definition see above) when including the follow-up bars n+1, n+2, n+3, …, n+x (instead of calculating only with n) and – ONLY IN THIS CASE – update the values/dates for SM’s lowest low and highest high (see above).
Furthermore a potential SM(n) resp. SM(n+x) must be ignored by the indi if it exceeds “maximum points of distance SM” or undercuts “minimum points of distance SM”, whereby “distance” = difference between the highest high and the lowest low of all “SM valid closed bars (n+x)”:
-> Maximum points of distance SM: 300 [etc. (if TF = M1)]
-> Minimum points of distance SM: 60 [etc. (if TF = M1)]
Stage 2:
The strong movement slows down. This means that the “Minimum value for SM’s n bars: 0.55 [etc.]” is undercut by the currently closed n+x+1 bar e.g. SM’s calculated current actual value shrinks from >0.55 to 0.54 or 0.43 etc. In this case the indi must make the “final notation” of SM’s lowest low / highest high (see above) BUT EXCLUDING the last closed bar that caused the end of SM!
Now the bars of SM consist of the initial bar (IB) followed by n-1 bars + x bars that let the movement stay strong (x can also be 0!) including the final SM bar (FB), before SM is terminated by the terminating bar (TB) which already belongs to the “support/resistance area (SR)”, see below.
Stage 3:
The “strong movement (SM)” is – per definition – followed by a “support/resistance area (SR)”. Now the indi must check if at least the next k closed bars within SR – starting with TB (see above) – are fulfilling the following conditions:
1.) The difference of SR’s k bars’ highest high and lowest low must be a “maximum percentage (SR-MP)” in relation to SM:
-> Maximum value for SR-MP: 0.35 [etc.]
-> Minimum number k of SR bars: 5 [etc.]
If e.g. SR-MP = 0.35, the k bars in the support/resistance area (SR) are all swinging within a range of maximum 35 % in relation to the strong movement’s (SM) distance [calculated according to “Stage 1”).
2.) At least e bars of the k closed bars (within SR, see above) have a high(sell.order) / low(buy.order) that is close to the highest.high(sell.order) / lowest.low(buy.order) of “SM-SR”, whereby “SM-SR” includes ALL closed bars starting with IB (initial bar of SM) and ending with the last closed CURRENT bar. Said “e” bar’s upper/bottom extrema [high(sell.order) / low(buy.order)] must be in a specified range [in points]; for example 2 bars out of 5 within SR are close to each other AND close to said extremum of “SM-SR”:
-> Maximum range of SR’s e bars: 10 [etc.]
-> Minimum number e of SR bars with similar extrema: 2 [etc.]
If “Minimum number e of SR bars with similar extrema” = 0, there MUST NOT be any couple/triplet etc. of bar’s with similar extrema but CAN BE.
3.) At least the l last closed bars of k are lower(sell.order) / higher(buy.order) OR EQUAL to the corresponding extremum of SM:
-> Minimum number l of SR’s last bars with lower/higher extremum: 2 [etc.]
If “Minimum number l of SR’s last bars with lower/higher extremum” = 0, the last closed bars within k have no further restriction at this point.
NOTE:
If not all conditions of “Stage 3” are fulfilled at the close of bar k, the indi must continually check resp. recalculate them with bars k+1 (instead of k), then k+2 (instead of k+1), then k+3 (instead of k+2), … and so on. This process will end if
a) all conditions are fulfilled
or
b) “Maximum value for SR-MP” is exceeded by the currently processed bar.
If “b” occurs the indi must go back to resp. start again with “Stage 1”.
If “a” occurs the indi must proceed with “Stage 4” (see below).
Stage 4:
If all conditions of “Stage 3” are fulfilled the indi must wait until the current price reaches the end region of SR = ER-SR. The “ER-SR” is – per definition – located in the upper(sell.order) / bottom(buy.order) area of SR and finally ending with the SR’s highest.high(sell.order) / lowest.low(buy.order). ER-SR must be set in the GUI by the user as a percentage of the distance between the highest high and the lowest low of SR:
-> ER-SR’s percentage for entry price level: 0.25 [etc.]
In this case the current price must reach the top(sell.order) / bottom(buy.order) 25% of SR to fulfill this condition.
If said value is set to e.g. 1.25 (= 125%) the current price must exceed(sell.order) / undercut(buy.order) SR’s highest.high(sell.order) / lowest.low(buy.order) with a “distance of at least 25% SR”, whereby “distance of SR” = highest.high - lowest.low of the current/actual SR in points.
NOTE:
It’s very important that all follow-up bars after “Stage 3” resp. while “Stage 4” must apart from that ALSO be in the range of “Maximum value for SR-MP” [see “Stage 3: 1.)”], even the currently processed (not closed) bar!
As soon as a (current) follow-up bar of “Stage 4” exceeds “Maximum value for SR-MP” before reaching “ER-SR” (see above) the indi must go back resp. start again with “Stage 1”.
Stage 5:
If all conditions of “Stage 4” are fulfilled the indi must draw a colored down(sell.order) / up(buy.order) arrow above/below the current price reaching ER-SR (see above):
-> Color of the up/buy arrow: yellow [etc.]
-> Color of the down/sell arrow: yellow [etc.]
Furthermore the indi must calculate and draw suggested fixed SL/TP levels (horizontal thin and dotted lines with a length of 20 bars):
-> Color of the fixed SL line: red [etc.]
-> Color of the fixed TP line: lime [etc.]
The value resp. price level of SL/TP must be calculated as follows:
A user defined percentage of the difference highest.high and lowest.low of the whole movement IB->ArrowBar is converted to points and
for SL added(sell.order) to / subtracted(buy.order) from the “arrow’s price level”
resp.
for TP subtracted(sell.order) from / added(buy.order) to the “arrow’s price level”:
-> SM-SR’s percentage for calculating SL buy: 0.35 [etc.]
-> SM-SR’s percentage for calculating TP buy: 0.25 [etc.]
-> SM-SR’s percentage for calculating SL sell: 0.40 [etc.]
-> SM-SR’s percentage for calculating TP sell: 0.20 [etc.]
Furthermore the final SL/TP levels must ALWAYS be “expanded” by a user set spread (in points) that best represents the broker’s average:
-> Spread added to expand TP/SL: 12 [etc.]
Stage 6:
After an arrow and its corresponding TP/SL lines were drawn by the indi the latter must “pause” all calculations for r (recess) bars. After r bars it starts again with “Stage 1”:
-> Number of recess bars after signal: 10 [etc.]
Extra filter:
If enabled, all potential sell/buy signals will be “skipped” if not at least b bars BEFORE SM have a lower(sell.order) / higher(buy.order) extremum than the highest.high(sell.order) / lowest.low(buy.order) of SM-SR with at least p points difference:
-> Enable extra filter: true/false
-> Minimum number of lower/higher bars b before SM: 100 [etc.]
-> Minimum points of lower/higher bars before SM: 120 [etc.]
!! Please optimize the indicator for the lowest possible CPU usage – thx !!
응답함
1
등급
프로젝트
396
28%
중재
69
19%
/
49%
기한 초과
121
31%
작업중
2
등급
프로젝트
149
36%
중재
29
3%
/
55%
기한 초과
35
23%
무료
3
등급
프로젝트
370
42%
중재
145
17%
/
41%
기한 초과
124
34%
무료
게재됨: 38 코드
4
등급
프로젝트
0
0%
중재
0
기한 초과
0
무료
비슷한 주문
Hello looking for someone to convert an indicator from tradingview to Thinkorswim I have attached the codes from trading view Also, I like make it trigger (alert) a one-time alert when the trend changes, and can also create a custom watchlist column that flags symbols currently in a new trend so you can scan multiple stocks easily. And like the watchlist to show only fresh trend changes or the current trend direction
Version document : 1.0 Plateforme : TradingView Langage : Pine Script v6 Type : Indicateur d'analyse et d'aide à la décision (non-exécutant) 1. Présentation du projet Nom du produit ONYX SR V2 — Intelligent Support & Resistance Scalping System Objectif Créer un indicateur TradingView capable d'identifier automatiquement des opportunités de scalping basées sur : supports et résistances dynamiques ; action du prix ;
I have a EA/indicator that I want built. I should say 1st off dont know how to code myself so I will be using AI to verify that the source code is complete and matches the documents spec or if better so if you can not truly do the job do not waste either of out time. This is a idea I came.up wit and used AI to produce a framework for it.... and of course AI isn't 100% accurate so I need a knowledgeable quantitative
TumiiFX
30 - 20000 USD
1. Use two EMAs: 20 and 50. If EMA 20 is above EMA 50 → uptrend (look for buys) If EMA 20 is below EMA 50 → downtrend (look for sells) 2. Wait for a pullback into the area between the two EMAs. - For buys: price must touch or move between EMA 20 and EMA 50 during the last few candles. - For stils: same idea, but in a downtrend. 3. Entry signal: Buy: a bullish engulfing candle in an uptrend after the pullback
I Need HFT bot working on MT4
30 - 100 USD
I am looking for an experienced MQL4 developer to build a professional High-Frequency Trading (HFT) / Low-Latency Expert Advisor for MetaTrader 4 (MT4) . The EA will be deployed on an IC Markets Live account and should be optimized for the fastest possible execution using a low-latency VPS located in LD4 or NY4 . The primary instruments will be US30 and XAUUSD (Gold) . The goal is to create an EA capable of
A robot
50+ USD
HIGH-FREQUENCY M5/M15 CONCURRENT ENTRY SNIPER import time class HighFrequencySniper: def __init__(self): self.target_profit = 25.00 # Targeted Delta Move self.max_execution_time = 3600 # 1 Hour Sandbox (Seconds) self.lot_allocation = "CALIBRATED_TO_RISK" def execute_hft_scan(self, current_price, m5_rsi, m15_order_block): print(f"[SCANNING] Current Kernel Metric: ${current_price:.2f
I need a trading bot, please i need this project urgently and when messaing me kindly send me samples of past works and dont forget i need the project to be done as soon as possible
A lightweight MT5 chart overlay displaying total floating P&L, average entry price, combined lot size, and current symbol exposure as a percentage of account balance, all updating in real time with color-coded profit/loss indicators, delivered with clean object-oriented source code and no DLL dependencies
ENTRY EXIT TIMING (ET BANDS)
30 - 50 USD
QUIERO CONSEGUIR EL CODIGO FUENTE DE ESTE INDICADOR QUE ME GUSTA MUCHO TAMBIEN TIENE EL NOMBRE DE ET BANDS O ENTRY EXIT TIMING . no se los componentes pero estas son las imagenes. que mejor lo describen
I am looking to convert my existing TradingView Pine Script (v5) strategy into an MQL5 Expert Advisor (EA) for MetaTrader 5. Strategy Details: Asset: Gold (XAUUSD) Timeframe: 15-minute Strategy Logic: The strategy is based on a breakout concept. Anchor Candle: The base calculation starts from the Specified Candle Entry Window: The EA should only look for entries As Per Indicator Risk Management: The strategy
프로젝트 정보
예산
50 - 100 USD
기한
에서 1 로 4 일