スピーディに自動売買ロボットを注文する方法を見る
注文を投稿するまたは受注する前にルールをご覧ください。
MQL5およびMQL4で自動売買ロボットを注文する方法
ロボットを注文するにはサンプル要件仕様をご覧ください
カテゴリでの新規注文:
200 - 2000 USD
100 - 200 USD
200+ USD
112+ USD
30+ USD
指定
Hi,
I’m currently working on a trading system that should be automated. The first step will be to code an indicator for detecting special/important support and resistance areas on any forex chart and suggesting appropriate SL/TP levels for making the corresponding BUY/SELL market orders. Said indicator needs complex calculations and a lot of input parameters for the user in the GUI. Therefore the budget is up to $ 100 and I need the final product (incl. bug fixes) soon resp. within the next few days.A detailed description of the requested indicator’s functionality is attached in the postscript (see below).
Who can do this VERY accurately?
[An advanced mathematical understanding is strongly required!]
Ben
PS: Description of the requested indicator:
MT4 Indicator “SupRes_v1”
Concept:
“SupRes_v1” detects strong up/down price movements followed by a support/resistance area and draws a down(sell.order) / up(buy.order) arrow contrary to said strong movement. The requested indicator also plots lines for suggested fixed SL/TP levels along with said arrows that symbolize the recommended trading direction.
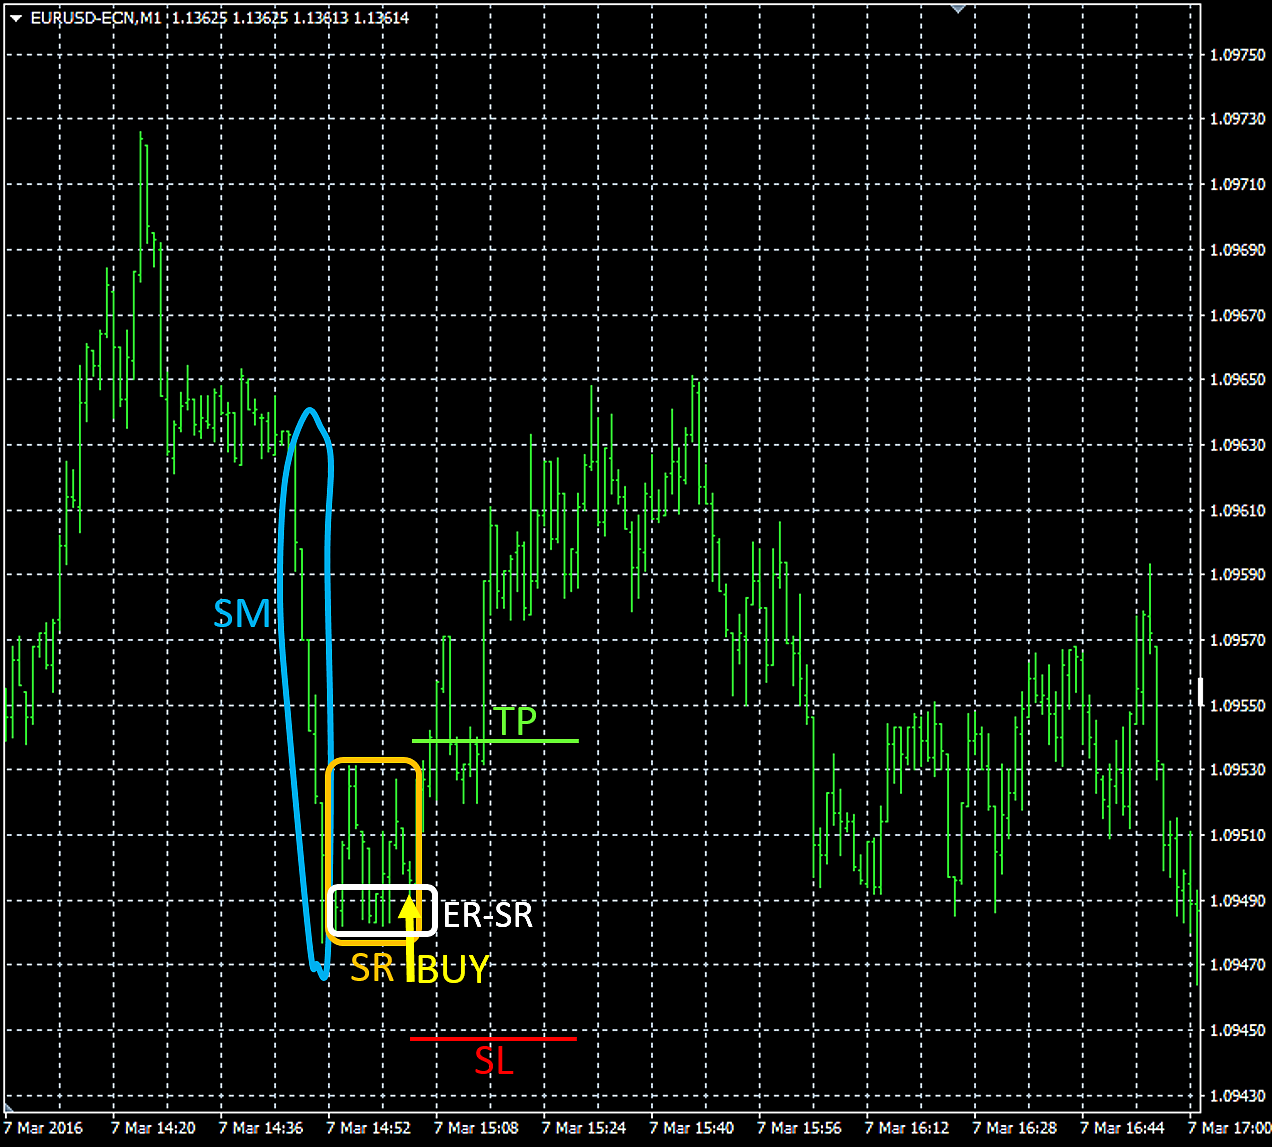
It is recommended to open the attached image in a separate browser tab etc. for a better understanding when reading the detailed description below.
Description in detail:Stage 1:
The fx chart resp. price makes a strong up(sell.order) / down(buy.order) movement for at least n bars. A “strong movement (SM)” must be calculated as follows:
SM = [(Difference in points between the highest high and the lowest low of the last n closed bars)/n]/[SUM(length of n bars)]
In the Indi’s GUI the user must also be able to define the minimum value for SM:
-> Minimum value of SM: 0.55 [etc.]
-> Minimum number n of SM bars: 5 [etc.]
If e.g. SM = 0.50, the strong movement’s bars’ “overlapping value” must be averagely at least 50 %.
If e.g. SM = 1.00, the strong movement consist of consecutive “non-overlapping” bars.
If e.g. SM > 1.00, the strong movement’s bars must have partly gaps between each other.
The indi must permanently scan the chart’s last n closed bars and recognize if all conditions for a valid “SM” are fulfilled.
Once a SM is detected the indi must “note” the value resp. price of SM’s lowest low and highest high and their positions (time/date). From then on the indi must continually check resp. recalculate if the movement stays “strong” (definition see above) when including the follow-up bars n+1, n+2, n+3, …, n+x (instead of calculating only with n) and – ONLY IN THIS CASE – update the values/dates for SM’s lowest low and highest high (see above).
Furthermore a potential SM(n) resp. SM(n+x) must be ignored by the indi if it exceeds “maximum points of distance SM” or undercuts “minimum points of distance SM”, whereby “distance” = difference between the highest high and the lowest low of all “SM valid closed bars (n+x)”:
-> Maximum points of distance SM: 300 [etc. (if TF = M1)]
-> Minimum points of distance SM: 60 [etc. (if TF = M1)]
Stage 2:
The strong movement slows down. This means that the “Minimum value for SM’s n bars: 0.55 [etc.]” is undercut by the currently closed n+x+1 bar e.g. SM’s calculated current actual value shrinks from >0.55 to 0.54 or 0.43 etc. In this case the indi must make the “final notation” of SM’s lowest low / highest high (see above) BUT EXCLUDING the last closed bar that caused the end of SM!
Now the bars of SM consist of the initial bar (IB) followed by n-1 bars + x bars that let the movement stay strong (x can also be 0!) including the final SM bar (FB), before SM is terminated by the terminating bar (TB) which already belongs to the “support/resistance area (SR)”, see below.
Stage 3:
The “strong movement (SM)” is – per definition – followed by a “support/resistance area (SR)”. Now the indi must check if at least the next k closed bars within SR – starting with TB (see above) – are fulfilling the following conditions:
1.) The difference of SR’s k bars’ highest high and lowest low must be a “maximum percentage (SR-MP)” in relation to SM:
-> Maximum value for SR-MP: 0.35 [etc.]
-> Minimum number k of SR bars: 5 [etc.]
If e.g. SR-MP = 0.35, the k bars in the support/resistance area (SR) are all swinging within a range of maximum 35 % in relation to the strong movement’s (SM) distance [calculated according to “Stage 1”).
2.) At least e bars of the k closed bars (within SR, see above) have a high(sell.order) / low(buy.order) that is close to the highest.high(sell.order) / lowest.low(buy.order) of “SM-SR”, whereby “SM-SR” includes ALL closed bars starting with IB (initial bar of SM) and ending with the last closed CURRENT bar. Said “e” bar’s upper/bottom extrema [high(sell.order) / low(buy.order)] must be in a specified range [in points]; for example 2 bars out of 5 within SR are close to each other AND close to said extremum of “SM-SR”:
-> Maximum range of SR’s e bars: 10 [etc.]
-> Minimum number e of SR bars with similar extrema: 2 [etc.]
If “Minimum number e of SR bars with similar extrema” = 0, there MUST NOT be any couple/triplet etc. of bar’s with similar extrema but CAN BE.
3.) At least the l last closed bars of k are lower(sell.order) / higher(buy.order) OR EQUAL to the corresponding extremum of SM:
-> Minimum number l of SR’s last bars with lower/higher extremum: 2 [etc.]
If “Minimum number l of SR’s last bars with lower/higher extremum” = 0, the last closed bars within k have no further restriction at this point.
NOTE:
If not all conditions of “Stage 3” are fulfilled at the close of bar k, the indi must continually check resp. recalculate them with bars k+1 (instead of k), then k+2 (instead of k+1), then k+3 (instead of k+2), … and so on. This process will end if
a) all conditions are fulfilled
or
b) “Maximum value for SR-MP” is exceeded by the currently processed bar.
If “b” occurs the indi must go back to resp. start again with “Stage 1”.
If “a” occurs the indi must proceed with “Stage 4” (see below).
Stage 4:
If all conditions of “Stage 3” are fulfilled the indi must wait until the current price reaches the end region of SR = ER-SR. The “ER-SR” is – per definition – located in the upper(sell.order) / bottom(buy.order) area of SR and finally ending with the SR’s highest.high(sell.order) / lowest.low(buy.order). ER-SR must be set in the GUI by the user as a percentage of the distance between the highest high and the lowest low of SR:
-> ER-SR’s percentage for entry price level: 0.25 [etc.]
In this case the current price must reach the top(sell.order) / bottom(buy.order) 25% of SR to fulfill this condition.
If said value is set to e.g. 1.25 (= 125%) the current price must exceed(sell.order) / undercut(buy.order) SR’s highest.high(sell.order) / lowest.low(buy.order) with a “distance of at least 25% SR”, whereby “distance of SR” = highest.high - lowest.low of the current/actual SR in points.
NOTE:
It’s very important that all follow-up bars after “Stage 3” resp. while “Stage 4” must apart from that ALSO be in the range of “Maximum value for SR-MP” [see “Stage 3: 1.)”], even the currently processed (not closed) bar!
As soon as a (current) follow-up bar of “Stage 4” exceeds “Maximum value for SR-MP” before reaching “ER-SR” (see above) the indi must go back resp. start again with “Stage 1”.
Stage 5:
If all conditions of “Stage 4” are fulfilled the indi must draw a colored down(sell.order) / up(buy.order) arrow above/below the current price reaching ER-SR (see above):
-> Color of the up/buy arrow: yellow [etc.]
-> Color of the down/sell arrow: yellow [etc.]
Furthermore the indi must calculate and draw suggested fixed SL/TP levels (horizontal thin and dotted lines with a length of 20 bars):
-> Color of the fixed SL line: red [etc.]
-> Color of the fixed TP line: lime [etc.]
The value resp. price level of SL/TP must be calculated as follows:
A user defined percentage of the difference highest.high and lowest.low of the whole movement IB->ArrowBar is converted to points and
for SL added(sell.order) to / subtracted(buy.order) from the “arrow’s price level”
resp.
for TP subtracted(sell.order) from / added(buy.order) to the “arrow’s price level”:
-> SM-SR’s percentage for calculating SL buy: 0.35 [etc.]
-> SM-SR’s percentage for calculating TP buy: 0.25 [etc.]
-> SM-SR’s percentage for calculating SL sell: 0.40 [etc.]
-> SM-SR’s percentage for calculating TP sell: 0.20 [etc.]
Furthermore the final SL/TP levels must ALWAYS be “expanded” by a user set spread (in points) that best represents the broker’s average:
-> Spread added to expand TP/SL: 12 [etc.]
Stage 6:
After an arrow and its corresponding TP/SL lines were drawn by the indi the latter must “pause” all calculations for r (recess) bars. After r bars it starts again with “Stage 1”:
-> Number of recess bars after signal: 10 [etc.]
Extra filter:
If enabled, all potential sell/buy signals will be “skipped” if not at least b bars BEFORE SM have a lower(sell.order) / higher(buy.order) extremum than the highest.high(sell.order) / lowest.low(buy.order) of SM-SR with at least p points difference:
-> Enable extra filter: true/false
-> Minimum number of lower/higher bars b before SM: 100 [etc.]
-> Minimum points of lower/higher bars before SM: 120 [etc.]
!! Please optimize the indicator for the lowest possible CPU usage – thx !!
応答済み
1
評価
プロジェクト
395
28%
仲裁
69
19%
/
49%
期限切れ
120
30%
仕事中
2
評価
プロジェクト
149
36%
仲裁
29
3%
/
55%
期限切れ
35
23%
暇
3
評価
プロジェクト
370
42%
仲裁
145
17%
/
41%
期限切れ
124
34%
暇
パブリッシュした人: 38 codes
4
評価
プロジェクト
0
0%
仲裁
0
期限切れ
0
暇
類似した注文
BTC/USDT Grid Trading Boo
30 USD
(Isolated ×3 Leverage | Trailing Profit Lock | Bybit Futures Trading) No demo account available. Developer must use personal testing setup or Bybit testnet API keys to validate connectivity, simulate runs, and deploy to the specified VPS prior to handover. 🔴 Pre-Flight Checklist (NON-NEGOTIABLE – Complete Before Coding) 🟥 API Validation: • Enable: Trading + Info Read (Zero withdrawal perms). • Whitelist VPS IP if
New options in Account Management: I have an EA, which does trade and does some account management as well. Need to add the following options as well in the existing code. 1. Enable Maximum Exposure control - True / False Breakeven closure after max trades - 15 Immediate closure after max trades – 25 ExposureTrailingSLLevel – 1.5 ExposureTrailingNextLevel – 2.5 New trades after - immediate /session /day/week
Necesito convertir un indicador de código abierto de Tradingview a MT5, es un indicador sencillo, solo necesito que copie los MSS por lo que se puede obviar todo lo demás
MT5 News-Truggered Forex Bot
50+ USD
I need a fully automated trading bot for MetaTrader 5 that can open and close positions around major U.S. news releases, specifically Non-Farm Payrolls (NFP) and CPI. Before each release I will enter the exact price level where I want to sell; at the scheduled announcement the bot must instantly check that price and, if it is reached or crossed, execute the trade without manual intervention. To achieve this, the code
To implement the 90% Win Rate Trend Trading Strategy in MQL5 for MetaTrader 5, I need to break down the strategy into programmable rules. Here's a detailed outline: *Strategy Components:* 1. *Trend Identification:* Use indicators like Moving Averages, RSI, or Bollinger Bands to identify trends. 2. *Entry Signals:* Use indicators like ZZ Semafor, ASCtrend, and Scalping Indicator to generate buy/sell signals. 3. *Risk
I need a skilled MQL5 developer to convert the meter section of the LuxAlgo Market Sentiment Technicals indicator from TradingView (Pine Script) into a fully functional MetaTrader 5 (MT5) version. The MT5 indicator should display the same sentiment states — Bullish, Strong Bullish, Neutral, Bearish, and Strong Bearish — and match the TradingView version in both logic and timing accuracy (within 1–2 seconds)
Code already Build need someone to debug it so I can compile it and make it work very elaborate code don't want it changed. this is what it has let me know if you can fix What's Included - ALL 4 PARTS! ✅ PART 1: Initialization & Database Layer (788 lines) Core constants & enumerations Advanced data structures Global variables & arrays Memory management system Indicator manager class Main functions (OnInit
Develop mt5 trading strategy
30+ USD
I’m looking to connect with a developer who has a tested and reliable trading strategy , preferably one that has passed or been tested under prop firm conditions . Hi few questions Do you any trading strategy? Does your strategy pass prop firms? Is your strategy using algo? What platform you recommend to use for it? i will be waiting for a great developer to response to this offer
Necesito Robot para operar el Nasdaq en cfds
40 - 65 USD
Necesito programar un bot en MT5, este bot lo quiero para MT5, un bot para operar Nasdaq en CFDs, El bot lo quiero para operar solo compras, utilizando los indicadores que sean necesarios para apoyarnos en la tendencia alcista NO MARTIN GALA Me debes dar el código fuente completo La licencia es de por vida Necesito una demo para probar que la estrategia sea rentable
Looking for someone to replicate this EA on utube
100 - 400 USD
https://www.youtube.com/live/Fn6ucmWyuAA?si=x96zzN07q8Diif8a To build a fully automated AI-style trading robot similar to the one demonstrated in the video, which opens, manages, and closes trades automatically based on adaptive market behavior. The system should visually and functionally resemble the performance shown in the video but include transparent, editable logic for long-term optimization
プロジェクト情報
予算
50 - 100 USD
VAT(付加価値税) (19%):
9.5
- 19
USD
合計:
59.5
- 119
USD
開発者用
45
- 90
USD
締め切り
最低 1 最高 4 日