CGraphic 테스트 - 질문 및 제안 - 페이지 6

 
Roman Konopelko :
CGraphic 클래스에서 요청한 대로 모든 위치에서 색상 유형을 uint로 대체했습니다.

또한 CCanvas 클래스에 주어진 두께로 기본 요소를 그릴 수 있는 새로운 메서드를 추가했습니다.
혁신에 따라 CCurve는 CCurve의 속성을 확장했습니다.
이제 선으로 곡선을 그릴 때 선의 굵기와 끝 부분의 스타일을 설정할 수 있습니다.


예, 정말 대단합니다.
 

스플라인 작업(베지어 곡선에 의한 보간)이 수정되었습니다. 구현이 CGraphics 클래스에서 CCanvas로 직접 이동되어 그래픽 라이브러리 외부에서 스플라인을 빌드할 수 있습니다.‌

또한 닫힌 스플라인을 그리는 알고리즘이 추가되었습니다.

결과적으로 두 개의 새로운 공용 메서드가 CCCanvas 클래스 에 나타났습니다.

 void               PolylineSmooth( const int &x[], const int &y[], const uint clr, const int size,
                                     ENUM_LINE_STYLE style= STYLE_SOLID ,ENUM_LINE_END end_style=LINE_END_ROUND,
                                     double tension= 0.5 , double step= 10 );
void               PolygoneSmooth( int &x[], int &y[], const uint clr, const int size,
                                     ENUM_LINE_STYLE style= STYLE_SOLID ,ENUM_LINE_END end_style=LINE_END_ROUND,
                                     double tension= 0.5 , double step= 10 );

이 방법을 사용하면 주어진 스타일과 두께로 스플라인을 그릴 수 있습니다.

베지어 곡선이 원과 타원을 정확하게 묘사한다는 사실 때문에 주어진 두께로 이러한 프리미티브를 그리는 새로운 방법으로 CCanvas 클래스를 보완할 필요가 없습니다.

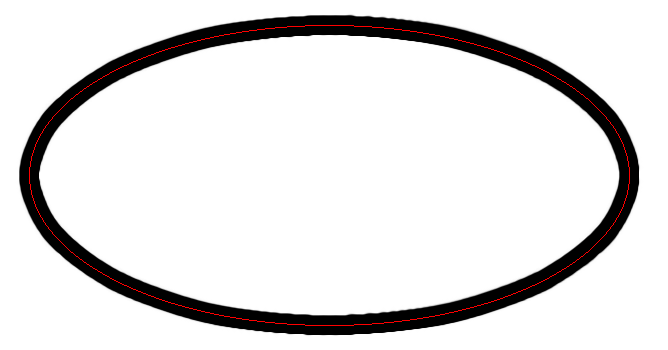
PolygoneSmooth 방법에 기반한 베지어 곡선에 의한 타원 근사의 예:

 #include <Canvas\Canvas.mqh>
//+------------------------------------------------------------------+
//| Get arrays with ellipse coordinates                              |
//+------------------------------------------------------------------+
void Ellipse( int &x[], int &y[])
  {
   int xc = 750 ;
   int yc = 300 ;
   int rx = 300 ;
   int ry = 150 ;
   ArrayResize (x, 16 );
   ArrayResize (y, 16 );
   int i= 0 ;
   for ( double fi= 0 ; fi< 2 * M_PI ; fi+= M_PI_4 / 2 ,i++)
     {
      x[i]=( int ) MathRound (xc+ cos (fi)*rx);
      y[i]=( int ) MathRound (yc+ sin (fi)*ry);
     }
  }
//+------------------------------------------------------------------+
//| Script program start function                                    |
//+------------------------------------------------------------------+
void OnStart ()
  {
   CCanvas canvas;
   canvas.CreateBitmapLabel( 0 , 0 , "Canvas" , 0 , 0 , 1500 , 600 );
   canvas.Erase( ColorToARGB ( clrWhite ));
   int x[];
   int y[]; 
   Ellipse(x,y);
   canvas.PolygoneSmooth(x,y, ColorToARGB ( clrBlack ), 20 , STYLE_SOLID ,LINE_END_BUTT, 0.5 , 1 );
   canvas.Arc( 750 , 300 , 300 , 150 , 0 , M_PI * 2 , ColorToARGB ( clrRed ));   
   canvas.Update();
  }

결과:


그래픽 라이브러리의 보편성을 향한 또 다른 가능한 단계: 곡선 CURVE_CUSTOM 그리기를 위한 사용자 정의 모드.

이 모드는 표준 라이브러리 도구가 허용하는 것과 다르게 곡선을 그리기 위해 ‌CGraphic 클래스의 상속자를 만들고 ...Plot 메서드를 오버로드할 필요가 없습니다.

이 CURVE_CUSTOM 모드를 구현하기 위해 CCurve 클래스에 새 속성이 추가됩니다.‌

   //--- gets or sets the custom properties
   PlotFucntion      CustomPlotFunction( void )               const { return (m_custom_plot_func);   }
   void              *CustomPlotCBData( void )                 const { return (m_custom_plot_cbdata); }
   void               CustomPlotFunction(PlotFucntion func) { m_custom_plot_func=func;     }
   void               CustomPlotCBData( void *cbdata)        { m_custom_plot_cbdata=cbdata; }

새로운 함수 포인터 PlotFucntion을 기반으로 합니다.‌

 typedef void (*PlotFucntion)( double &x[], double &y[], int size, CGraphic *graphic,CCanvas *canvas, void *cbdata);

이 접근 방식은 차트를 그릴 수 있는 새로운 가능성을 열어줍니다.

예를 들어, CGraphics 라이브러리에서 촛대‌를 구축해 보겠습니다.

1. 하나의 양초에 대한 모든 데이터가 저장될 컨테이너 클래스를 생성합시다.‌

 //+------------------------------------------------------------------+
//| Class CCandle                                                    |
//| Usage: class to represent the candle                             |
//+------------------------------------------------------------------+
class CCandle: public CObject
  {
private :
   double             m_open;
   double             m_close;
   double             m_high;
   double             m_low;
   uint               m_clr_inc;
   uint               m_clr_dec;
   int                m_width;

public :
                     CCandle( const double open, const double close, const double high, const double low,
                                                       const int width, const uint clr_inc= 0x000000 , const uint clr_dec= 0xF5F5F5 );
                    ~CCandle( void );
   double             OpenValue( void )             const { return (m_open);     }
   double             CloseValue( void )           const { return (m_close);    }
   double             HigthValue( void )           const { return (m_high);     }
   double             LowValue( void )             const { return (m_low);      }
   uint               CandleColorIncrement( void ) const { return (m_clr_inc);  }
   uint               CandleColorDecrement( void ) const { return (m_clr_dec);  }
   int                CandleWidth( void )           const { return (m_width);    }
  };
//+------------------------------------------------------------------+
//| Constructor                                                      |
//+------------------------------------------------------------------+
CCandle::CCandle( const double open, const double close, const double high, const double low,
                                 const int width, const uint clr_inc= 0x000000 , const uint clr_dec= 0xF5F5F5 ):
                                 m_open(open),m_close(close),m_high(high),m_low(low),
                                 m_clr_inc(clr_inc),m_clr_dec(clr_dec),m_width(width)
  {
  }
//+------------------------------------------------------------------+
//| Destructor                                                       |
//+------------------------------------------------------------------+
CCandle::~CCandle( void )
  {
  }

2. CCandle 클래스는 CObject의 상속자이기 때문에 우리가 그리고 싶은 모든 양초를 CArrayObj 클래스의 객체에 순차적으로 쓸 수 있습니다. 이 배열은 cbdata 매개변수로 사용자 정의 렌더 메소드에 전달됩니다. 결과적으로 양초를 그리는 방법은 다음과 같습니다.‌

 //+------------------------------------------------------------------+
//| Custom method for plot candles                                   |
//+------------------------------------------------------------------+
void PlotCandles( double &x[], double &y[], int size,CGraphic *graphic,CCanvas *canvas, void *cbdata)
  {
//--- check obj
   CArrayObj *candles=dynamic_cast<CArrayObj*>(cbdata);
   if (candles== NULL || candles.Total()!=size)
       return ;
//--- plot candles  
   for ( int i= 0 ; i<size; i++)
     {
      CCandle *candle=dynamic_cast<CCandle*>(candles.At(i));
       if (candle== NULL )
         return ;
       //--- primary calculate
       int xc=graphic.ScaleX(x[i]);
       int width_2=candle.CandleWidth()/ 2 ;
       int open=graphic.ScaleY(candle.OpenValue());
       int close=graphic.ScaleY(candle.CloseValue());
       int high=graphic.ScaleY(candle.HigthValue());
       int low=graphic.ScaleY(candle.LowValue());
       uint clr=(open<=close) ? candle.CandleColorIncrement() :  candle.CandleColorDecrement();
       //--- plot candle
      canvas.LineVertical(xc,high,low, 0x000000 );
       //--- plot candle real body
      canvas.FillRectangle(xc+width_2,open,xc-width_2,close,clr);
      canvas.Rectangle(xc+width_2,open,xc-width_2,close, 0x000000 );
     }
  }

삼. 단순화를 위해 모든 양초는 무작위로 생성됩니다. 그래서 우리는 순차적으로 10개의 양초를 생성하고 CArrayObj 클래스의 객체로 채웁니다. CGraphics 개체를 만들고 여기에 하나의 곡선을 추가한 후 PlotCandles 함수를 기반으로 그려질 것임을 나타냅니다. 또한 촛불이 완전히 보이도록 y축의 최대값과 최소값을 변경해야 합니다.

 //+------------------------------------------------------------------+
//| Script program start function                                    |
//+------------------------------------------------------------------+
void OnStart ()
  {
   int count= 10 ;
   int width= 10 ;
   double x[];
   double y[];
   ArrayResize (x,count);
   ArrayResize (y,count);
   CArrayObj candles();
   double max= 0 ;
   double min= 0 ;
//--- create values 
   for ( int i= 0 ; i<count; i++)
     {
      x[i] = i;
      y[i] = i;
       //--- calculate values
       double open= MathRound ( 50.0 +( MathRand ()/ 32767.0 )* 50.0 );
       double close= MathRound ( 50.0 +( MathRand ()/ 32767.0 )* 50.0 );
       double high= MathRound ( MathMax (open,close)+( MathRand ()/ 32767.0 )* 10.0 );
       double low= MathRound ( MathMin (open,close) -( MathRand ()/ 32767.0 )* 10.0 );
       //--- find max and min
       if (i== 0 || max<high)
         max=high;
       if (i== 0 || min>low)
         min=low;
       //--- create candle
      CCandle *candle= new CCandle(open,close,high,low,width);
      candles.Add(candle);
     }
//--- create graphic
   CGraphic graphic;
   if (!graphic.Create( 0 , "CandleGraphic" , 0 , 30 , 30 , 780 , 380 ))
     {
      graphic.Attach( 0 , "CandleGraphic" );
     }
//--- create curve
   CCurve *curve=graphic.CurveAdd(x,y,CURVE_CUSTOM, "Candles" );
//--- sets the curve properties
   curve.CustomPlotFunction(PlotCandles);
   curve.CustomPlotCBData( GetPointer (candles));
//--- sets the graphic properties
   graphic.YAxis().Max(( int )max);
   graphic.YAxis().Min(( int )min);
//--- plot 
   graphic.CurvePlotAll();
   graphic.Update();
  }

결과적으로 다음 그래프를 얻습니다.


파일:
Canvas.mqh  304 kb
Axis.mqh  12 kb
Curve.mqh  23 kb
Graphic.mqh  73 kb
Candle.mq5  6 kb
 

‌ @로만 코노펠코

CGraphic::SetDefaultParameters 함수에 작은 오류가 있습니다.

색상은 불투명도를 염두에 두고 초기화해야 합니다.

 void CGraphic::SetDefaultParameters( void )
  {
...
...
//--- sets the default values for grid
   m_grid.clr_line= ColorToARGB ( clrWhiteSmoke , 255 );
   m_grid.clr_axis_line= ColorToARGB ( clrSilver , 255 );
 
o_o :

‌ @로만 코노펠코

CGraphic::SetDefaultParameters 함수에 작은 오류가 있습니다.

색상은 불투명도를 염두에 두고 초기화해야 합니다.

좋은 오후, 나는 이미 이 순간을 수정했지만 불행히도 이러한 수정 사항은 아직 빌드에 포함되지 않았습니다.
 

다음은 컴퓨터를 정지시킨 예입니다. 내가 한 일 : 편집기 에서 차트에 표시기를 붙인 후 다양한 조합으로 재생하여 87 및 88 행 주석 처리 / 주석 해제 (한 번에 하나씩, 함께 할 때)

 //+------------------------------------------------------------------+
//|                                        tst.mq5 |
//|                              Copyright © 2017, Vladimir Karputov |
//|                                           http://wmua.ru/slesar/ |
//+------------------------------------------------------------------+
#property copyright "Copyright © 2017, Vladimir Karputov"
#property link        "http://wmua.ru/slesar/"
#property version    "1.000"
#property description "Panel indicator: \"Evening Star\" pattern " 
#property description "search results for different periods" 
#property indicator_chart_window 
#property indicator_buffers 0
#property indicator_plots    0
#include <Graphics\Graphic.mqh>
//--- object for creating graphs
CGraphic my_graphic;
//+------------------------------------------------------------------+
//| Global Variables                                                 |
//+------------------------------------------------------------------+
bool            m_first_start= false ;
//+------------------------------------------------------------------+ 
//| Custom indicator initialization function                         | 
//+------------------------------------------------------------------+ 
int OnInit ()
  {
   if (! EventSetTimer ( 3 ))
       if (! EventSetTimer ( 3 ))
         if (! EventSetTimer ( 3 ))
           {
             Print ( "Error create timer! THREE attempts!" );
             return ( INIT_FAILED );
           }
//--- canvas creation
   my_graphic.Create( 0 , "Evening Star Statistics" , 0 , 10 , 10 , 800 , 550 );

   my_graphic.CurvePlotAll();
   my_graphic.Update();
//---
   m_first_start= false ;
//--- 
   return ( INIT_SUCCEEDED );
  }
//+------------------------------------------------------------------+
//| Custom indicator deinitialization function                       |
//+------------------------------------------------------------------+
void OnDeinit ( const int reason)
  {
   my_graphic.Destroy();
  }
//+------------------------------------------------------------------+ 
//| Custom indicator iteration function                              | 
//+------------------------------------------------------------------+ 
int OnCalculate ( const int rates_total,
                 const int prev_calculated,
                 const datetime &time[],
                 const double &open[],
                 const double &high[],
                 const double &low[],
                 const double &close[],
                 const long &tick_volume[],
                 const long &volume[],
                 const int &spread[])
  {
   if (!m_first_start)
     {
       //--- revert access to arrays - do it like in timeseries 
       ArraySetAsSeries (time, true );
       ArraySetAsSeries (open, true );
       ArraySetAsSeries (high, true );
       ArraySetAsSeries (low, true );
       ArraySetAsSeries (close, true );

       int size= ArraySize (time);
       double arrY[],arrX[];
       ArrayResize (arrX,size);
       ArrayResize (arrY,size);
       for ( int i= 0 ; i<size;++i)
        {
         arrX[i]=( double )time[i];
         arrY[i]=close[i];
        }
      CCurve *curve_b=my_graphic.CurveAdd(arrX,arrY,CURVE_LINES, "Close" );
      CAxis *xAxis=my_graphic.XAxis();           // получаем ось X
       //---попеременно комбинирую (комментировать, раскомментировать) строки 87
       //--- и 88 можно словить момент поглощения памяти и зависания компьютера
       //xAxis.AutoScale(false); 
       //xAxis.Type(AXIS_TYPE_DATETIME); 
      my_graphic.CurvePlotAll();
      my_graphic.Update();
      m_first_start= true ;
     }
//--- return value of prev_calculated for next call 
   return (rates_total);
  }
//+------------------------------------------------------------------+
//| Timer function                                                   |
//+------------------------------------------------------------------+
void OnTimer ()
  {

  }
//+------------------------------------------------------------------+

업적을 두 번 반복했습니다. 단계를 기록하지 않은 것이 아쉽습니다. 세 번째는 확인하기가 두렵습니다.


추가됨: 빌드 1607 x64

파일:
tst.mq5  8 kb
 
Vladimir Karputov :

다음은 컴퓨터를 정지시킨 예입니다. 내가 한 일 : 편집기 에서 차트에 표시기를 붙인 후 다양한 조합으로 재생하여 87 및 88 행 주석 처리 / 주석 해제 (한 번에 하나씩, 함께 할 때)

업적을 두 번 반복했습니다. 단계를 기록하지 않은 것이 아쉽습니다. 세 번째는 확인하기가 두렵습니다.


추가됨: 빌드 1607 x64


오늘 나는 기록을 반복했습니다. 컴퓨터가 완전히 정지되어 RAM 소비가 2GB에서 5.5GB로 증가했습니다. 차트를 닫는 데 성공한 것 같지만 컴퓨터가 5분 동안 중단되었습니다.

이번에는 300개 이하의 요소로 배열 크기에 대한 제한을 도입했습니다. 분명히 도움이되지 않았습니다.


디버그는 무엇을 말합니까?

 
o_o :

디버그는 무엇을 말합니까?


Zhebug는 도달하지 못했습니다. 나는 이것을했습니다 : 표시기를 매달고 주석을 달지 않고 한두 줄을 주석 처리하고 컴파일했습니다. 결과적으로 타블렛에서 글을 쓰다보니 노트북이 나가버렸네요..
 
Vladimir Karputov :

Zhebug는 도달하지 못했습니다. 나는 이것을했습니다 : 표시기를 매달고 주석을 달지 않고 한두 줄을 주석 처리하고 컴파일했습니다. 결과적으로 타블렛에서 글을 쓰다보니 노트북이 나가버렸네요..


따라서 하드 리셋 후 랩톱이 활성화되었지만 파괴적인 실험을 계속하려는 열망은 사라졌습니다. 랩톱에서 여러 Expert Advisors가 회전하고 있으므로 한 시간 동안 정지하려는 욕구가 없습니다.