당사 팬 페이지에 가입하십시오
- 조회수:
- 33468
- 평가:
- 게시됨:
- 2008.12.04 09:04
- 업데이트됨:
- 2014.04.21 14:53
-
이 코드를 기반으로 한 로봇이나 지표가 필요하신가요? 프리랜스로 주문하세요 프리랜스로 이동
Nowadays, the most popular representatives of the fractal time functions are the financial time series. The fractal structure of these series is well-known and
aсcording to Mandelbrot there is a "rewording of the famous market saying that the movement of stocks and currencies is independent of the time scale and the
price. An observer can't tell if the information refers to the weekly, daily or hourly changes just by looking at the appearance of the chart» [1].
Usually, to determine the fractal dimension the Hurst's exponent is calculated [2]. However, for the reliable calculation of this exponent a huge amount of data
is necesary (~ 10^3) and that is too much comparing to the duration of the trends of trading.
The authors [1] interpose the fractal characteristics - the variation index (m) that is closely related to the common fractal dimension. In distinct from the
Hurst's exponent, the amount of information that is necessary for index determination is less by a factor of 2. It leads to use it as a local characteristics for
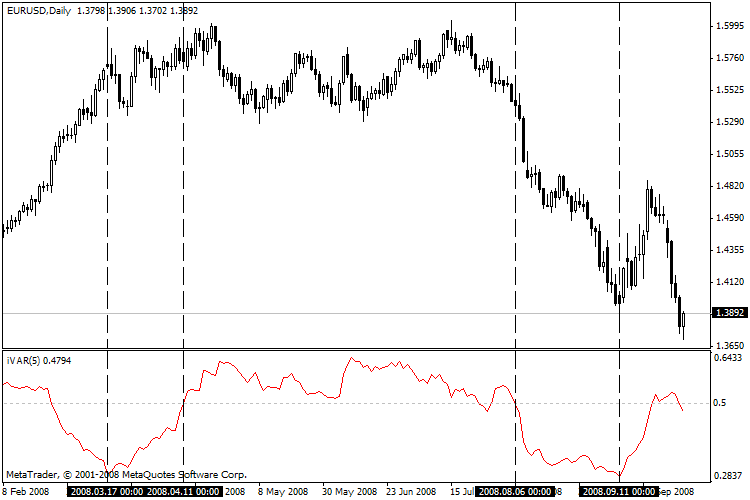
determination of the dynamics of the price series. If m < 0.5, it can be interpretated as a trend and m > 0.5 - as a flat.
The suggested indicator calculates the variation index on a previous interval which is 2^n long. The "n" parameter is specified by the user.
The common rules of the indicator application are the following:
- If the value of the indicator is lower than 0.5 it means the trend state of the market.
- The extremely low value is often precedes the end (correction) of the current trend.
- If the value of the indicator is higher than 0.5 it means the flat state of the market.
- The extremely high value is often precedes the beginning of the considerable trends.
- If the value of the indicator is close to 0.5 it means an undefined state of the market.

Literature:
1. M.M. Dubovikov and others. Dimension of the Minimal Cover and Local Analysis of Fractal Time Series, 2004.
2. Edgar E. Peters, Fractal Market Analysis. Applying Chaos Theory to Investment and Economics, John Wiley & Sons, 2003.
MetaQuotes Ltd에서 러시아어로 번역함.
원본 코드: https://www.mql5.com/ru/code/8464
 JimsCloseOrders
Simple EA to Close Orders
 Order Closer Scripts
Scripts to Close Orders under various conditions
 NonLagAMA
This indicator is an adaptation of NONLagDOT. It indicates the direction of the AMA slope without any lag. It works best when use on the 30 minutes charts.
 MultiStrend
Indicator MultiStrend. It works only with the Supertrend indicator.