거래 로봇을 무료로 다운로드 하는 법을 시청해보세요
당사를 Facebook에서 찾아주십시오!
당사 팬 페이지에 가입하십시오
당사 팬 페이지에 가입하십시오
스크립트가 마음에 드시나요? MetaTrader 5 터미널에서 시도해보십시오
- 조회수:
- 14760
- 평가:
- 게시됨:
- 2016.05.16 09:49
- 업데이트됨:
- 2016.05.23 09:53
-
이 코드를 기반으로 한 로봇이나 지표가 필요하신가요? 프리랜스로 주문하세요 프리랜스로 이동
Author: mandorr
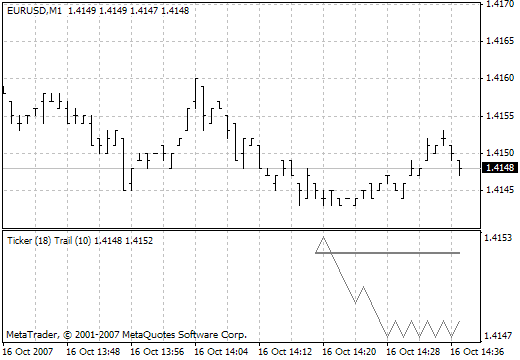
Here, the trail line is used instead of the signal line. Trail is the line that is distanced from the current price no more than the trailing length. If the difference between the price and the trail line is less than the trailing length, then the trail line does not move. The trail line is a good filter with a delay by price and not by time, unlike the signal line.

Calculated as the difference between the fast and the slow trail. Since this is an oscillator, there is no ticker line on the chart. The indicator values vary in the range from -100 to +100. The change of the TrailCD line direction can serve as a trading signal. In another version, the signal is the zero line crossing. A very strong signal is the indicator line reaching the value of -100 or +100. It is necessary to accumulate a quite large number of bars for the indicator signals to become significant.
Here, the trail line is used instead of the signal line. Trail is the line that is distanced from the current price no more than the trailing length. If the difference between the price and the trail line is less than the trailing length, then the trail line does not move. The trail line is a good filter with a delay by price and not by time, unlike the signal line.

Calculated as the difference between the fast and the slow trail. Since this is an oscillator, there is no ticker line on the chart. The indicator values vary in the range from -100 to +100. The change of the TrailCD line direction can serve as a trading signal. In another version, the signal is the zero line crossing. A very strong signal is the indicator line reaching the value of -100 or +100. It is necessary to accumulate a quite large number of bars for the indicator signals to become significant.
MetaQuotes Ltd에서 러시아어로 번역함.
원본 코드: https://www.mql5.com/ru/code/7492
 Ticker MACD
The chart contains the main line (the difference between the fast EMA and the slow EMA, applied to the Ticker line) and the signal line (obtained by applying the SMA to the main line).
 Ticker Awesome Oscillator
It is calculated as the difference between two simple moving averages: SMA(5) and SMA(34). Type of the chart: histogram with green and red colored bars.
 Trend continuation factor2
This indicator is created to determine the trend and its direction.
 TrendStrength
The indicator used to determine the global trend.