당사 팬 페이지에 가입하십시오
- 조회수:
- 21275
- 평가:
- 게시됨:
- 2016.05.16 09:49
- 업데이트됨:
- 2016.05.23 09:51
-
 이 코드를 기반으로 한 로봇이나 지표가 필요하신가요? 프리랜스로 주문하세요
프리랜스로 이동
이 코드를 기반으로 한 로봇이나 지표가 필요하신가요? 프리랜스로 주문하세요
프리랜스로 이동
The chart contains the main line (the difference between the fast EMA and the slow EMA, applied to the Ticker line) and the signal line (obtained by applying the SMA to the main line).
In the "Ticker MACD" indicator the line with the index 0 (№0 in the "Colors" tab) is the main line of the MACD. The line with the index 1 (№1 in the "Colors" tab) is the signal line. The indicator starts plotting the signal line PeriodSignal bars after the main line.
It should be noted that the normal values of the indicator start appearing after at least PeriodSlow number of bars, or even more. This is due to the fact that in the calculation of the EMA values, which are used to calculate the MACD, the recurrent formula is applied: X[t+1]=X[t]+K*(Price[t+1]-X[t]).
The initial value of both EMA is accepted as equal to the current price: X[0]=Price[0]. This leads to the EMAs with the same period, but with different initial times, having different values at the same moment of time due to different initial EMA values. But after a fairly long period of time, the values of these EMAs become virtually identical. This is unforeseeable on usual charts because of the large number of bars of the window. For the ticker version, it is necessary to wait for the sufficient number of bars to be accumulated.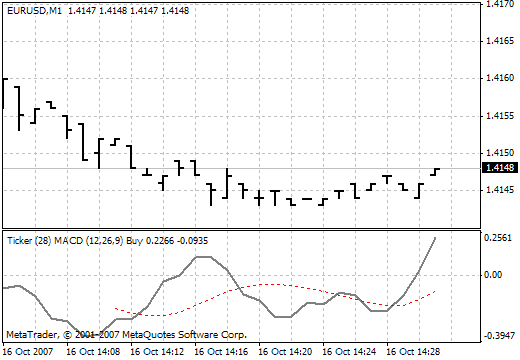
The classic indicator parameters are selected by default:
12, 26, 9. If anyone is interested, they can experiment with the parameters and determine the rules for working with this indicator.
The traditional version: crossing of the signal line by the signal line. Sometimes the crossing of the zero line by the main or signal line is used.
The third version: increase/decrease in the value of the main line compared to the previous value (in the spirit of the AO indicator by Bill Williams).
More "exquisite" version: the divergence of the Ticker MACD indicator's main line with the Ticker indicator's main line. As you can see, there are some usage options.
MetaQuotes Ltd에서 러시아어로 번역함.
원본 코드: https://www.mql5.com/ru/code/7491
 Ticker Awesome Oscillator
It is calculated as the difference between two simple moving averages: SMA(5) and SMA(34). Type of the chart: histogram with green and red colored bars.
Lagrange polynomial
Two options of the calculation, which creates the Lagrange polynomial based on the reference points.
Ticker Trail
Here, the trail line is used instead of the signal line. Trail is the line that is distanced from the current price no more than the trailing length.
Trend continuation factor2
This indicator is created to determine the trend and its direction.