당사 팬 페이지에 가입하십시오
- 게시자:
- Nikolay Kositsin
- 조회수:
- 19103
- 평가:
- 게시됨:
- 2011.10.04 11:12
- 업데이트됨:
- 2016.11.22 07:32
-
이 코드를 기반으로 한 로봇이나 지표가 필요하신가요? 프리랜스로 주문하세요 프리랜스로 이동
Real author:
Vladislav Goshkov (VG)
The well-known theorist Thomas Henning Murrey is widely known in the world of the modern trading. It was he who adapted the theory of the legendary William Gann making it more understandable. Murrey created his famous math lines on the basis of the Gann's "Square of Nine" principles. The lines proved to be an effective and widely used tool for forecasting the market movements changes.
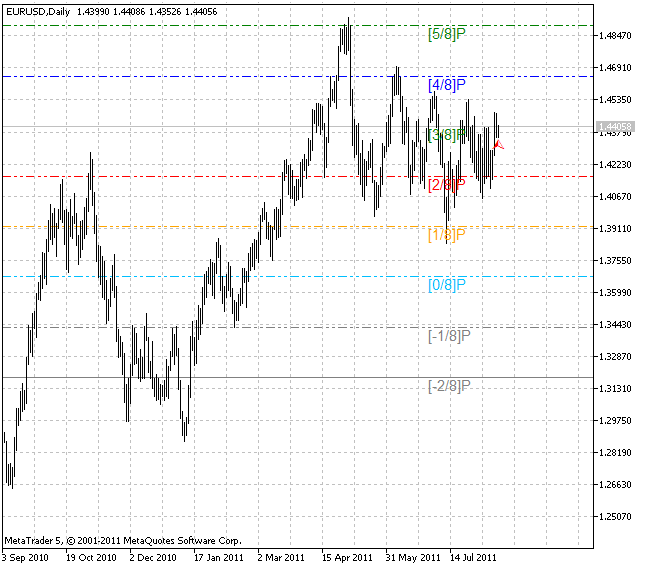
The idea of Murrey Lines can be shortly described the following way: the range is divided into 8 equal parts (areas) and two outer areas are additionally generated above and below. Areas are divided into lines.
Lines description (for a daily chart):
- 8/8 andf 0/8 lines (ultimate resistance). These are the most strong lines causing the most considerable resistance and support.
- 7/8 line (weak, stall and reverse). This is a weak line. If the price has moved too far and too fast and stopped near this line, it will quickly reverse downwards. If the price has not stopped near this line, it will continue moving up to 8/8.
- 1/8 line (weak, stall and reverse). This is a weak line. If the price has moved too far and too fast and stopped near this line, it will quickly reverse upwards. If the price has not stopped near this line, it will continue moving down to 0/8.
- 6/8 and 2/8 lines (pivot, reverse). These two lines are inferior only to the 4/8 line in their ability to reverse the price movement.
- 5/8 line (top of trading range). Prices of all markets spend 40% of their time to move between the 5/8 and 3/8 lines. In case the price moves around the 5/8 line and sticks to it for 10-12 days, it means that this is a "premium area" for selling and many traders follow this signal. But in case the price stays above 5/8, it is going to stay in the area for long. But if the price falls below 5/8, then it will most probably fall down to the next resistance level.
- 3/8 line (bottom of trading range). If the price below this level is moving upwards, it will be very difficult for it to break this level. In case this line is passed and the price stays above it for 10-12 days, then it will remain above this line and spend 40% of time moving between this line and the 5/8 line.
- 4/8 line (major support/resistance). This line provides maximum of resistance/support. This line is the best for buying/selling. In case the price is higher than 4/8, then it is a strong support level. In case the price is lower than 4/8, then it is a splendid resistance level.
- The area between 8/8 and +2/8 is an overbought zone.
- The area between 0/8 and -2/8 is an oversold zone.
This indicator was first implemented in MQL4 and published in CodeBase at mql4.com 12.10.2007.

MetaQuotes Ltd에서 러시아어로 번역함.
원본 코드: https://www.mql5.com/ru/code/462
 Bollinger Bands Set
Conjunto de Bandas de Bollinger ® criado com base no algoritmo de média universal.
 ColorMomentum_AMA
The color histogram based on the Momentum and Perry Kaufman's Adaptive Moving Average indicators.
 Keltner Channels Set
Set of Keltner Channels based on the universal smoothing.
 Multistochastic
The indicator for multi-currency technical analysis based on the related financial assets resonances.