당사 팬 페이지에 가입하십시오
- 조회수:
- 14983
- 평가:
- 게시됨:
- 2021.08.30 11:45
- 업데이트됨:
- 2021.08.30 11:52
-
이 코드를 기반으로 한 로봇이나 지표가 필요하신가요? 프리랜스로 주문하세요 프리랜스로 이동
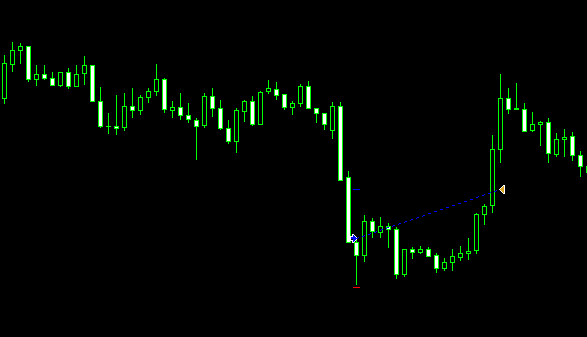
This EA buys when at new low in a down trend occurs with oversold rsi.
inputs for trending range and quality including look back how many bars involved.
sells at new high and same as buy.
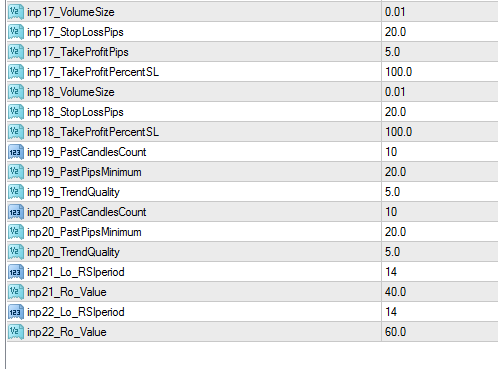
- Past candle count , look back period for trend conditions.
- past pips , pip look back range minimum range.
- trend quality 1-10 , 1 being loose trend / 10 quality trend.
- stop are placed in pips targets are a percent of stops.
- 100 being a 1:1 risk reward ratio . 200 1:2 ect
- lots set at 0.01 , variable.
- rsi period set at 14, variable and oversold and overbought levels set at 40/60 variable.
- preset parameters may not be profitable , lots of inputs for optimization.
- ignore input 17 takeprofitinpips set at 5pips


 IND - RiskPerTrade - MT4
Building good trading habits by seeing things in terms of percentage not in terms of money.
 EVZ Reader
Script to download EVZ data for Euro FX Vix indicator
 Timeframe Flow
Sharing this trend indicator made by me. Called "Timeframe Flow". It will draw a user defined higher time-frame candle on every shift on your current time-frame. Meaning you can have H4, H12 or D1 candles on every shift of your H1 Charts. Or you can have D2, D3 or D5 candles on every shift of your Daily Charts. Combined with the current time-frame ATR Bands, you have a trend indicator with some filter. You may also use the Mid Line crosses as exit( Calculated using Higher timeframe candles displayed in the indicator(Close + Open)/2 ).
 ATR with Smoothing
ATR with 4 smoothing options : RMA, EMA, WMA, SMA
