당사 팬 페이지에 가입하십시오
- 조회수:
- 19243
- 평가:
- 게시됨:
- 2021.08.29 21:56
-
이 코드를 기반으로 한 로봇이나 지표가 필요하신가요? 프리랜스로 주문하세요 프리랜스로 이동
THE STORY BEHIND THIS TRADING TOOL:
Most traders lose and this is a fact. There are lot of reasons behind their losses, but the main reason in my opinion is that they can't control their emotions since they are dealing with money. So when we see a trader keep holding a losing trade for so long or when we see a trader closes a winning trade too soon, this trader don't know how to manage emotions.
For example, if we give Ben, Joey and Rachel the same trading plan with the same balance and the same trading information, in the end of the day every one of them will have a different result because they are human beings and have emotions.
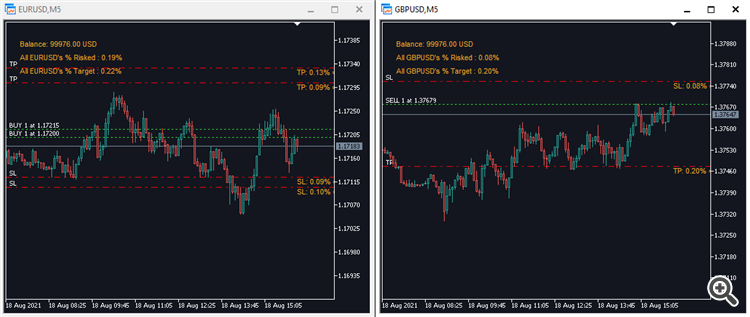
So what I did, I create an eyeglasses (a.k.a. the RiskPerTrade trading tool) that will allow Ben, Joey and Rachel to see everything on their screen in terms of % instead of money.
I urge you to try wearing these eyeglasses :)
HOW TO USE IT :
You can check the following video that will explain how to use this trading tool
SCREENSHOTS :
ALTERNATIVE TRADING TOOL:
You can also consult the following indicator which is the Overall Risk trading tool
THE STORY BEHIND THE OVERALL RISK TRADING TOOL:
The story behind developing this trading tool was to build a good trading habit, which is to always think in terms of percentage rather than amount of money. This way will allow us to treat small accounts as we are treating bigger accounts, which will allow us to switch from small accounts to bigger accounts smoothly.
HOW TO USE IT :
You can check the following video that will explain how to use this trading tool
 EVZ Reader
Script to download EVZ data for Euro FX Vix indicator
 Motion Smoothness Index
Determines when market price is smooth or rough
 Tops and bottoms in trend
with rsi .
 Timeframe Flow
Sharing this trend indicator made by me. Called "Timeframe Flow". It will draw a user defined higher time-frame candle on every shift on your current time-frame. Meaning you can have H4, H12 or D1 candles on every shift of your H1 Charts. Or you can have D2, D3 or D5 candles on every shift of your Daily Charts. Combined with the current time-frame ATR Bands, you have a trend indicator with some filter. You may also use the Mid Line crosses as exit( Calculated using Higher timeframe candles displayed in the indicator(Close + Open)/2 ).
