당사 팬 페이지에 가입하십시오
- 조회수:
- 11649
- 평가:
- 게시됨:
- 2019.02.21 12:43
-
 이 코드를 기반으로 한 로봇이나 지표가 필요하신가요? 프리랜스로 주문하세요
프리랜스로 이동
이 코드를 기반으로 한 로봇이나 지표가 필요하신가요? 프리랜스로 주문하세요
프리랜스로 이동
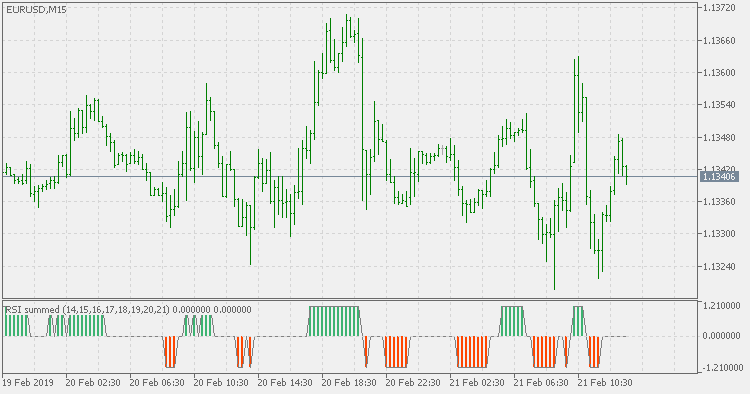
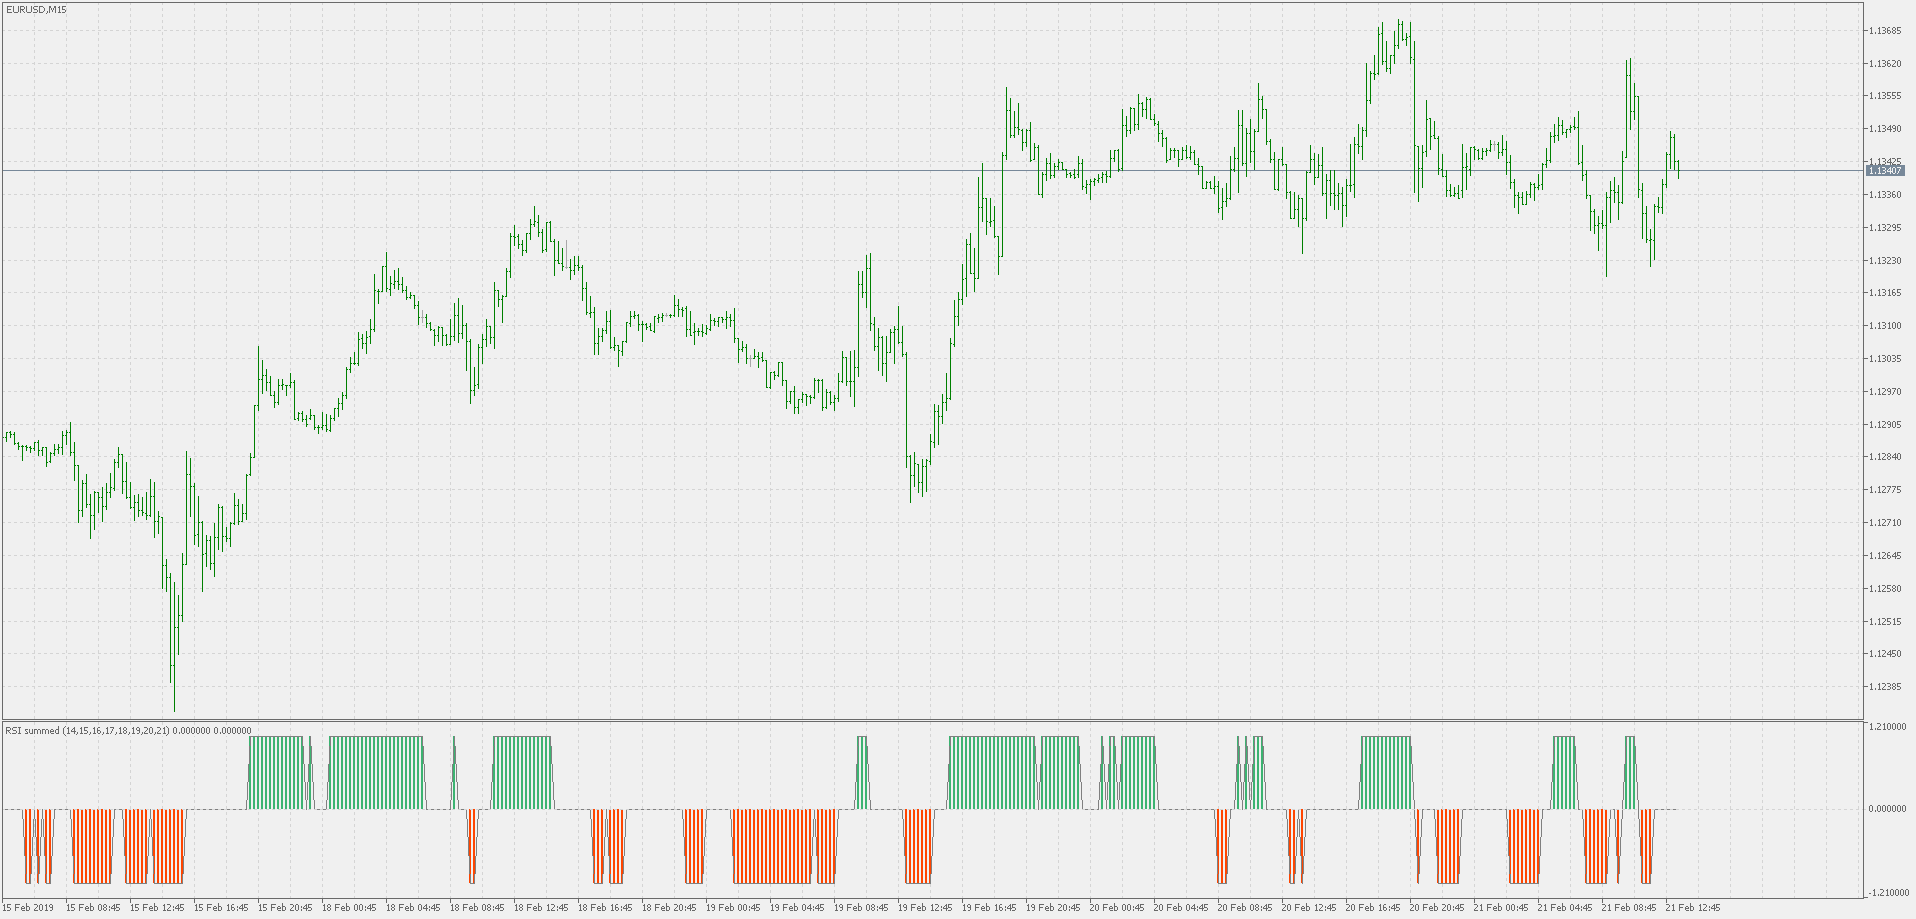
Theory :
The theory of this indicator is simple :
It takes nnn RSI values specified by periods parameter and checks if all the nnn rsi values are above or bellow the required value. If they are above, it shows it as state up, if all are bellow the desired low level, it shows it as state down, otherwise it shows it as neutral state. One may argue that that state can be obtained by checking the slowest rsi only, but in some cases it is not so (it largely depends on the periods used) hence the indicator does it for all the specified RSI values
Periods used can be specified as a list separated by ":". Default is 14;15;16;17;18;19;20;21
Usage :
You can use the color change as signals
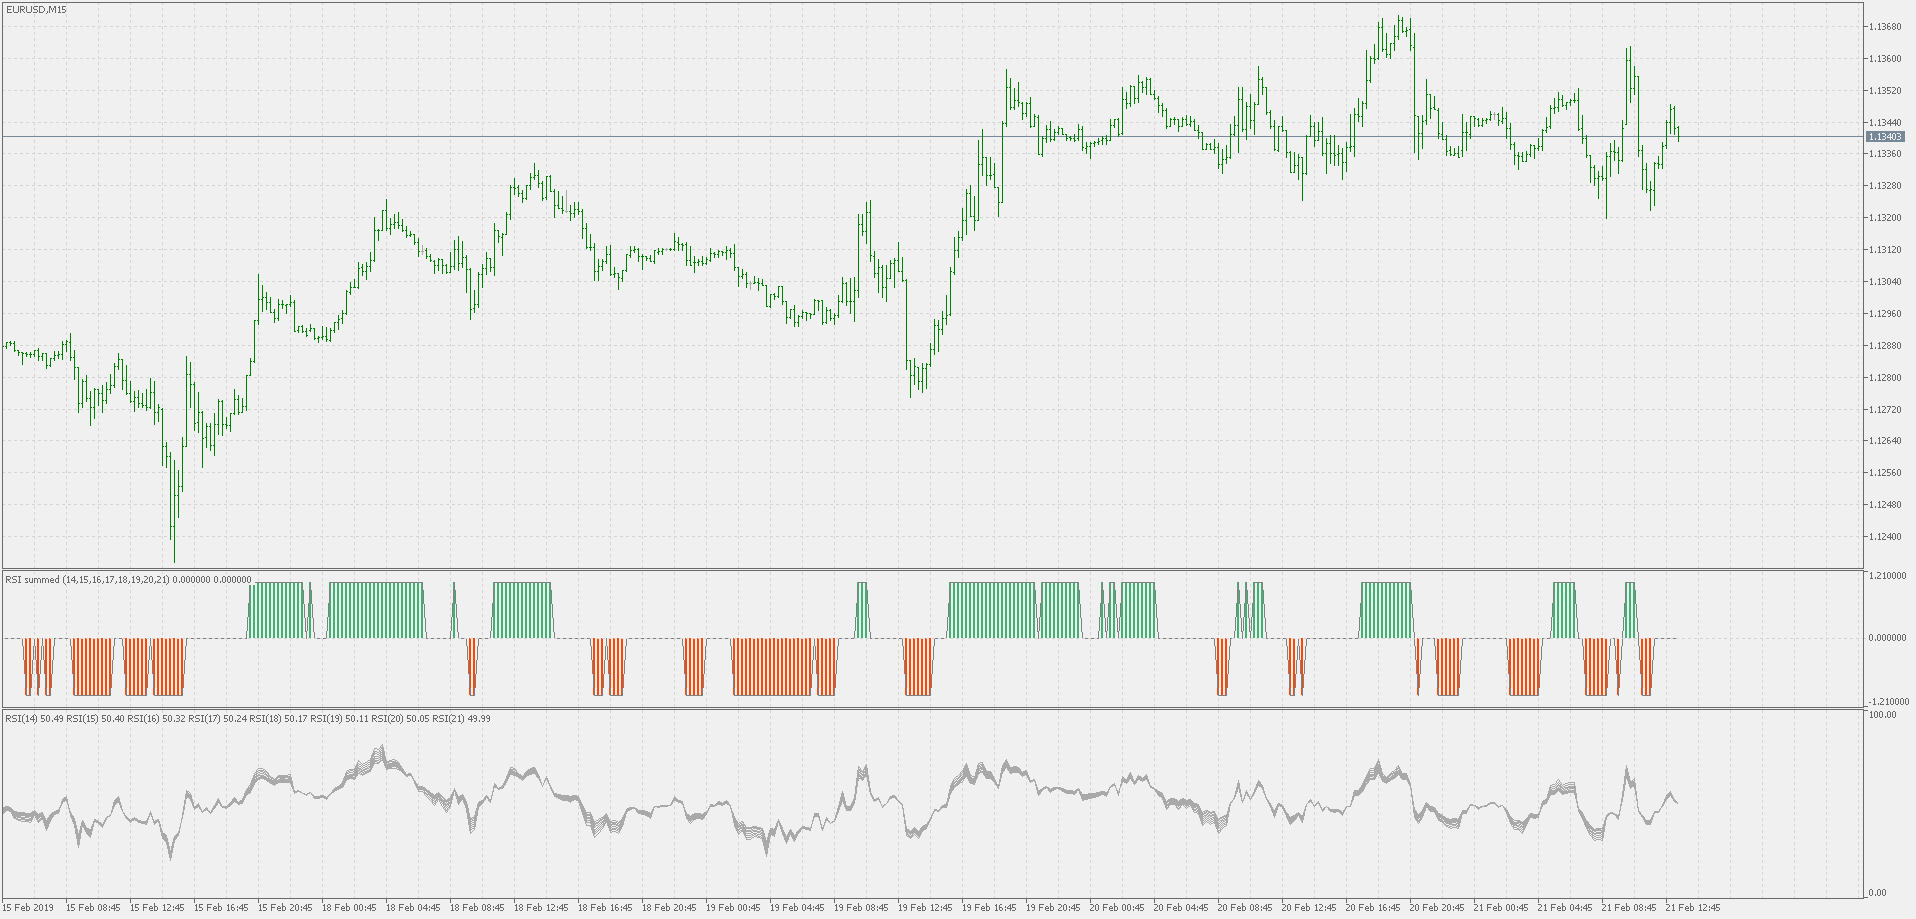
PS: example compared to the used RSIs
 Bollinger bands - squeeze
Bollinger bands - squeeze
Squeeze - on chart
Squeeze - on chart candles or bars
Normalized MACD - of averages
Normalized MACD of averages
Adaptive moving average - double smoothed
Adaptive moving average - double smoothed