당사 팬 페이지에 가입하십시오


- 조회수:
- 23269
- 평가:
- 게시됨:
- 업데이트됨:
-
 이 코드를 기반으로 한 로봇이나 지표가 필요하신가요? 프리랜스로 주문하세요
프리랜스로 이동
이 코드를 기반으로 한 로봇이나 지표가 필요하신가요? 프리랜스로 주문하세요
프리랜스로 이동
Theory :
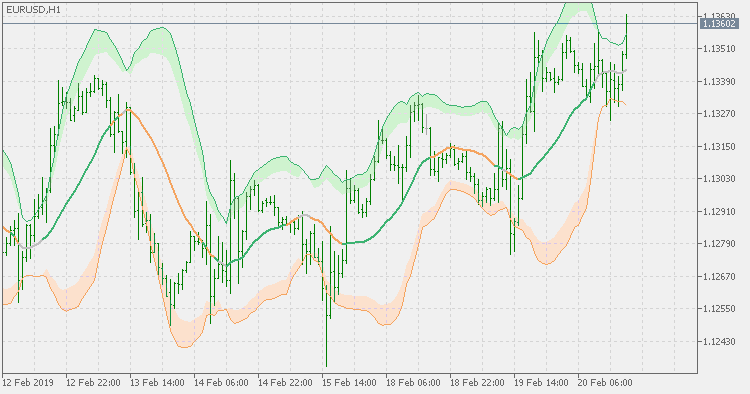
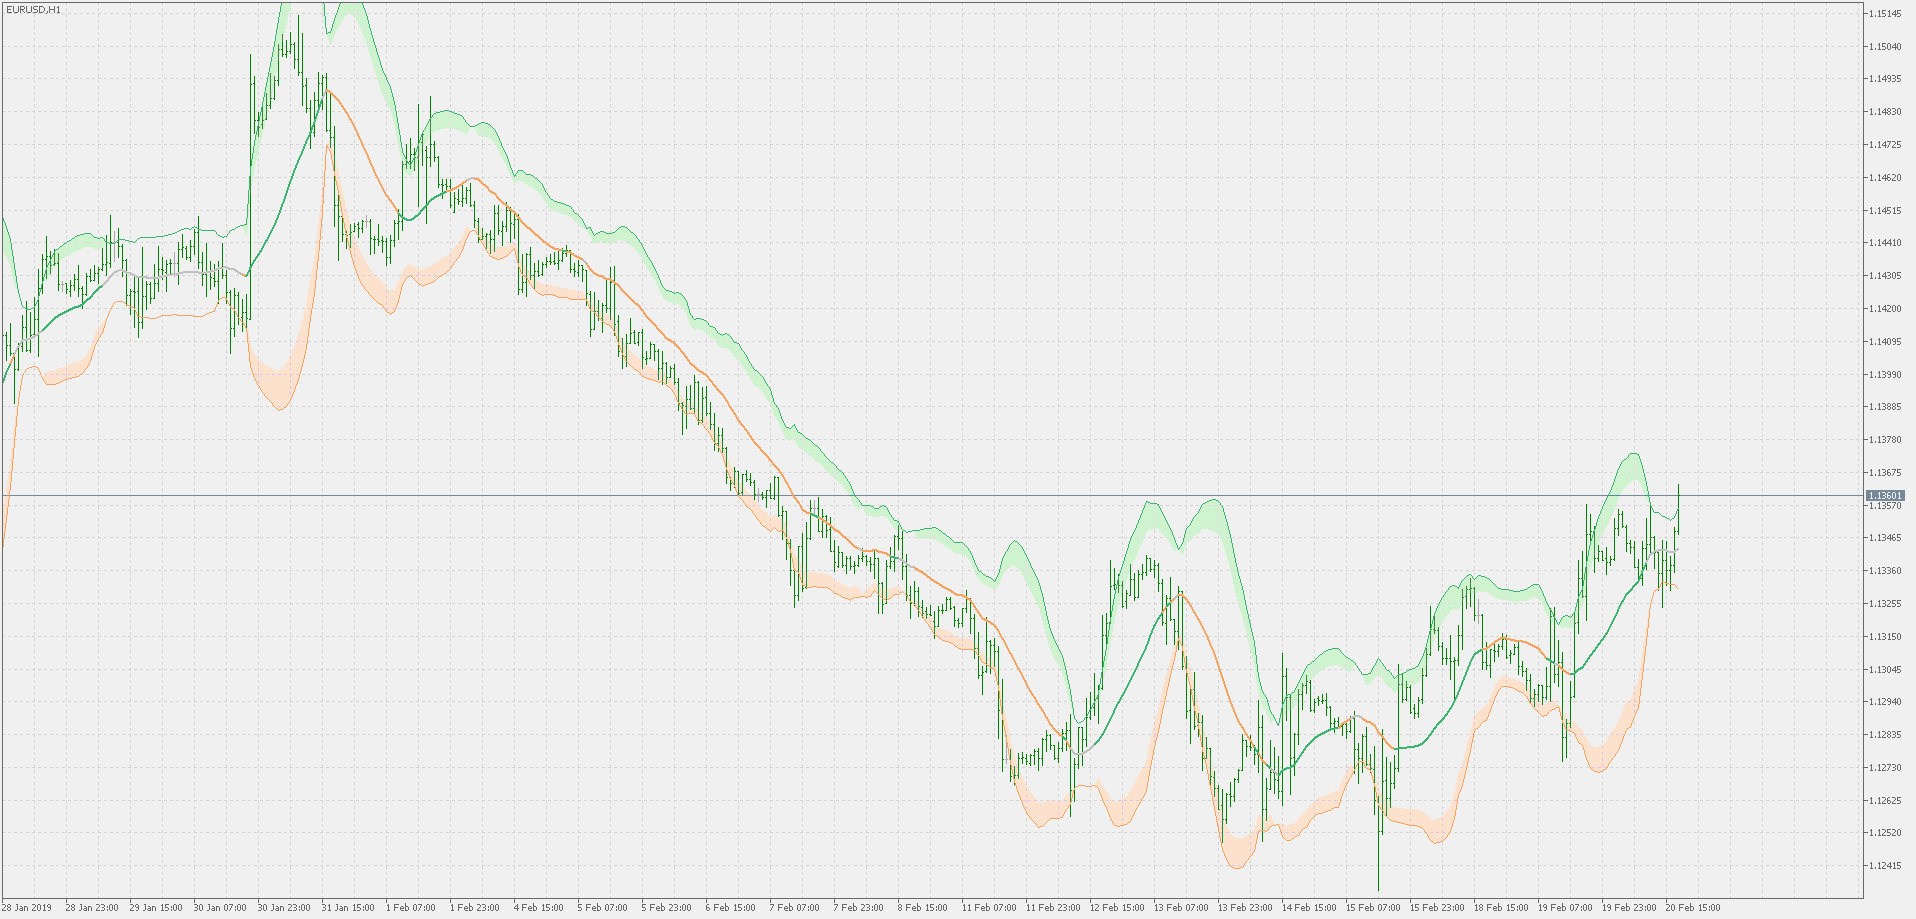
The "squeeze" method (indicator doing that was posted here : Squeeze )is usually (due to the nature of calculation - since it uses standard deviations as a part of calculation) associated with Bollinger bands indicator. This indicator is doing that : combining the Bollinger bands and the "squeeze" into one indicator
Usage :
Check if the middle Bollinger bands value has a color or not. If it does not have a color (it is gay), according to theory the market is consolidating and you can expect a break in either direction. Use the Bollinger bands itself for estimation of the possible direction and then use the color change as signal. The color of the middle line is not based on middle line slope, but on the median price position related to that value
The ATR and deviation bands multipliers used as default are the ones that are usually used for that. Some experimenting with those parameters is advised before you use the indicator for trading decisions