거래 로봇을 무료로 다운로드 하는 법을 시청해보세요
당사를 Facebook에서 찾아주십시오!
당사 팬 페이지에 가입하십시오
당사 팬 페이지에 가입하십시오
스크립트가 마음에 드시나요? MetaTrader 5 터미널에서 시도해보십시오
- 조회수:
- 9642
- 평가:
- 게시됨:
- 2019.01.16 21:28
-
 이 코드를 기반으로 한 로봇이나 지표가 필요하신가요? 프리랜스로 주문하세요
프리랜스로 이동
이 코드를 기반으로 한 로봇이나 지표가 필요하신가요? 프리랜스로 주문하세요
프리랜스로 이동
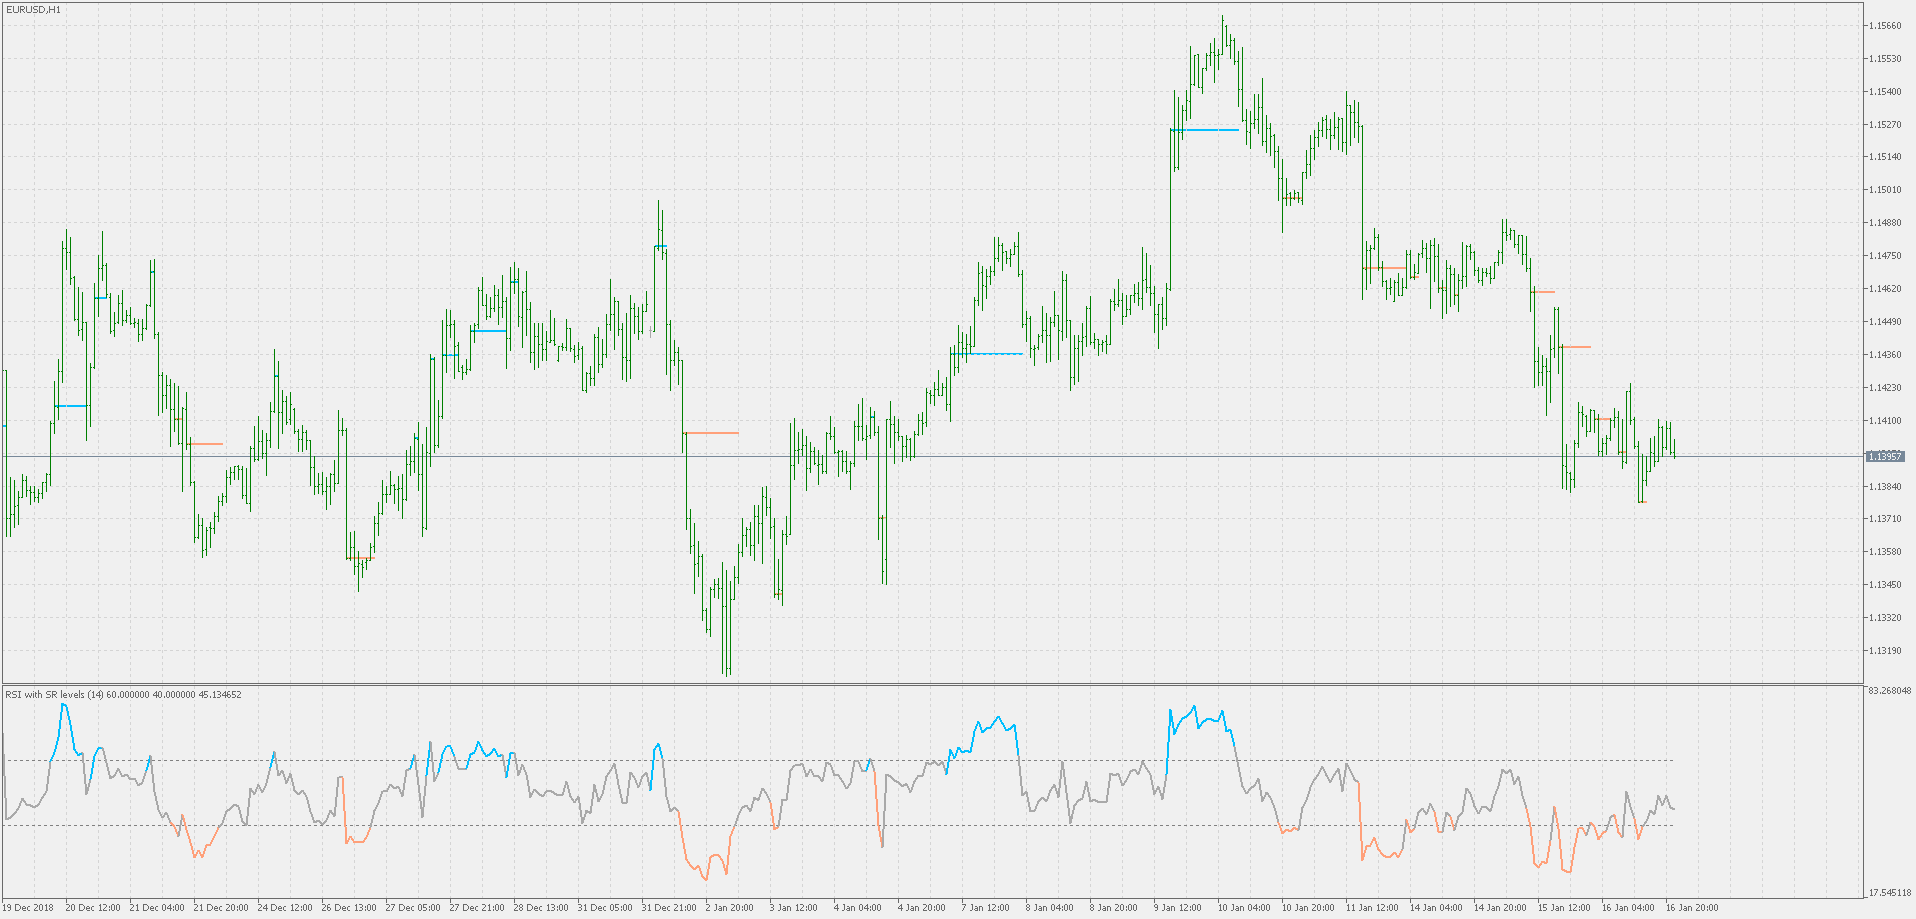
Theory :
This is RSI with on-chart support / resistance levels displayed. The way how it is done is explained in more detail here : CCI With on-chart SR Levels
Usage :
You can use it as any regular RSI and you can use the color changes as signals
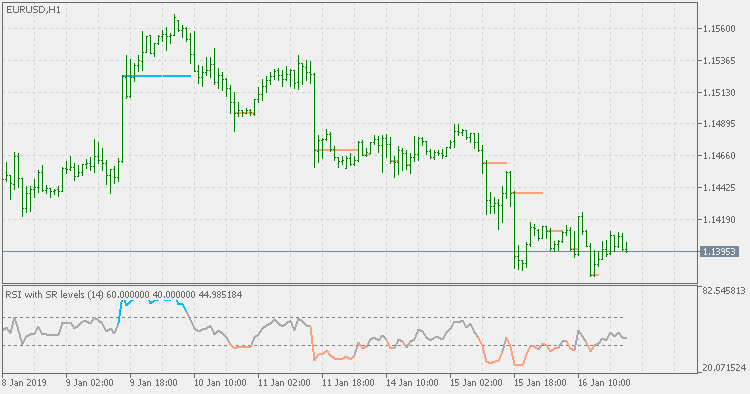
The "big picture" example
 CCI with on chart SR levels
CCI with on chart support and resistance levels
Corrected double smoothed Wilder's EMA (extended version)
Corrected double smoothed Wilder's EMA (extended version)
Stochastic with support / resistance levels
Stochastic with support / resistance levels
Trix oscillator with support / resistance lines on chart
Trix oscillator with support / resistance lines on chart