Join our fan page
- Views:
- 9645
- Rating:
- Published:
- 2019.01.16 21:10
-
 You are missing trading opportunities:
- Free trading apps
- Over 8,000 signals for copying
- Economic news for exploring financial markets
Registration Log inYou agree to website policy and terms of use
If you do not have an account, please register -
 Need a robot or indicator based on this code? Order it on Freelance
Go to Freelance
Need a robot or indicator based on this code? Order it on Freelance
Go to Freelance
Theory :
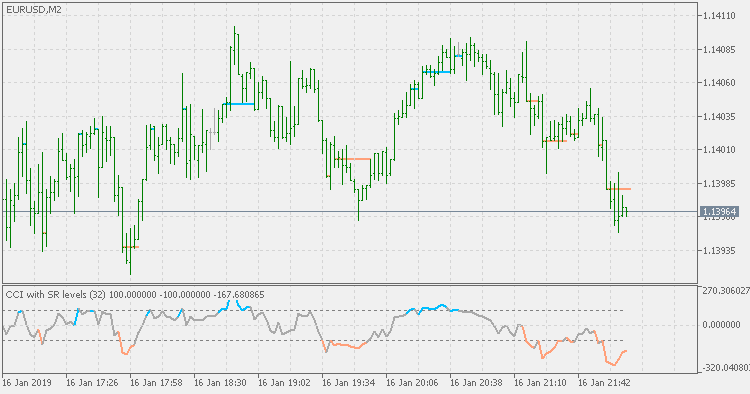
The idea for this indicator is as simple as it gets : a lot of times we are using some indicator levels as a signal that some desired level is reached and that the price change is to be used as an entry or exit price for our orders / positions. That is all OK but many times we simply are comparing the prices only visually. This indicator is a sort of a "helper" for that. What it does :
- it waits for a level break (CCI in this case)
- if it was broken, then it checks if a new trend line at the chart should be displayed
- if it remains in the over bought or oversold area, it adjusts the existing SR level displayed on chart
- if it retraces in to the neutral zone, the line update is canceled and a new signal is waited for
Th indicator, as it is, is mainly meant to be used in manual trading.
Usage :
The same as any CCI.
PS:
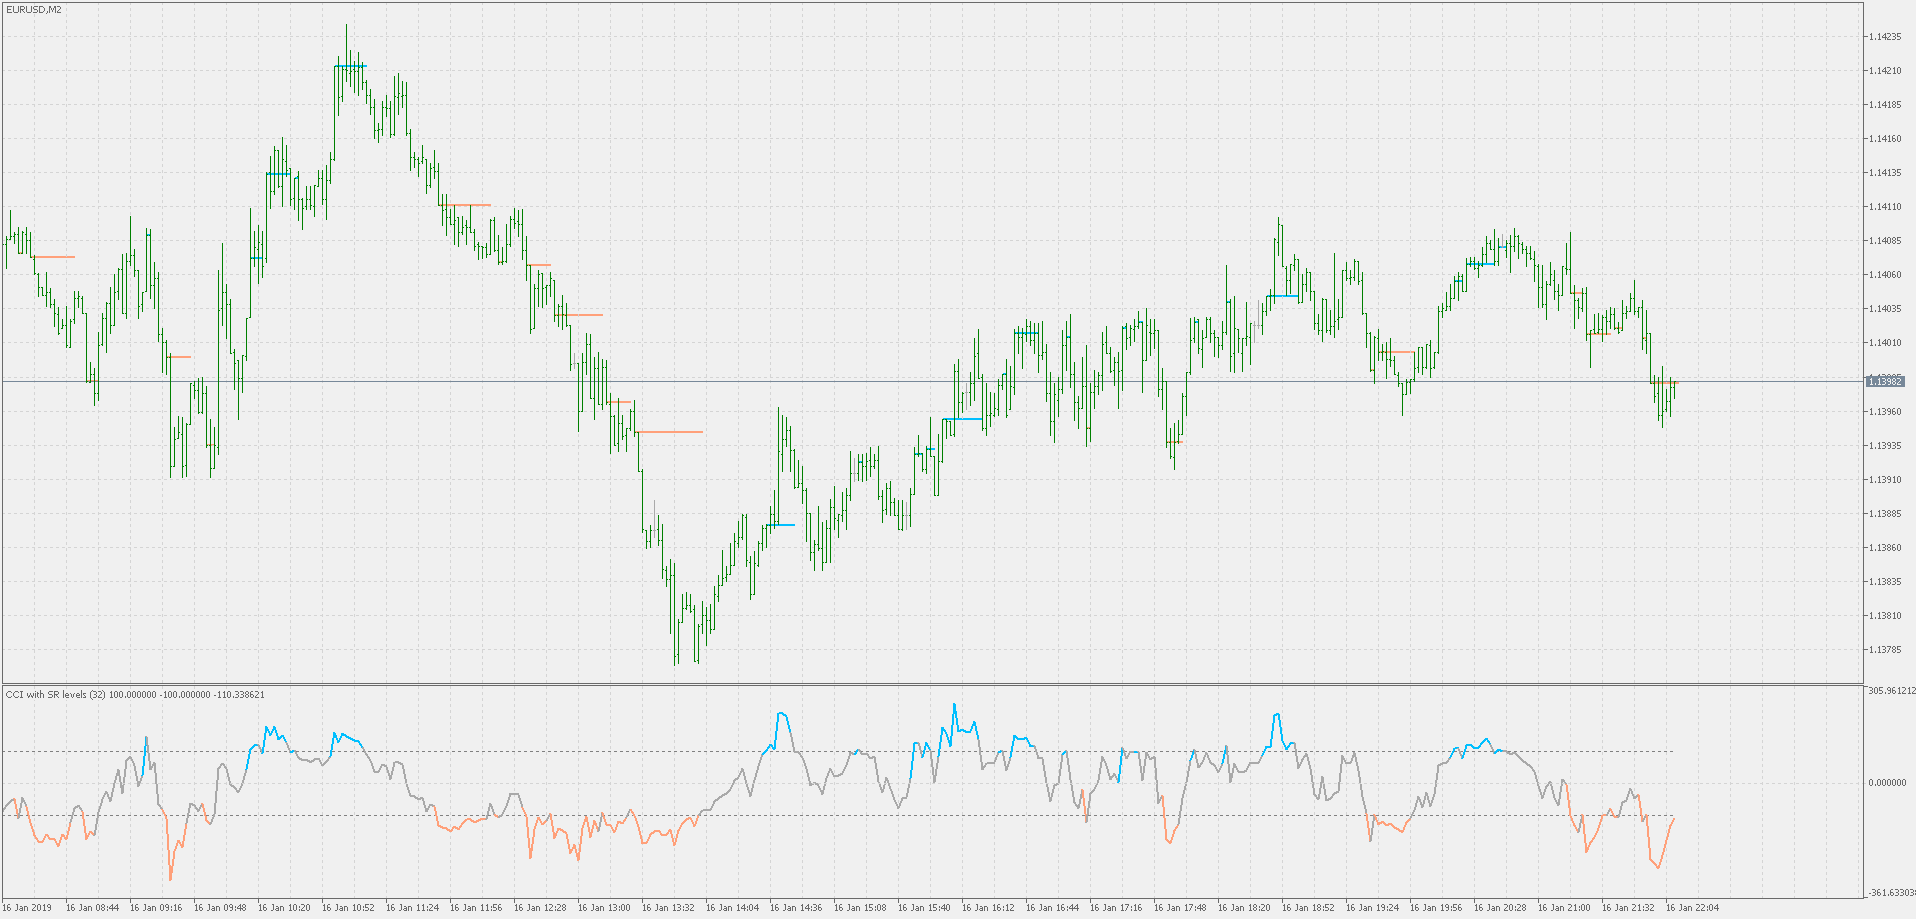
The "big picture" example that shows in a more clear way how the indicator works and what is it showing us on chart
 Corrected double smoothed Wilder's EMA (extended version)
Corrected double smoothed Wilder's EMA (extended version)
Corrected double smoothed Wilder's EMA
Corrected double smoothed Wilder's EMA
RSI with on chart SR levels
RSI with on chart SR levels
Stochastic with support / resistance levels
Stochastic with support / resistance levels