당사 팬 페이지에 가입하십시오
- 조회수:
- 8024
- 평가:
- 게시됨:
- 2018.05.02 16:38
-
 이 코드를 기반으로 한 로봇이나 지표가 필요하신가요? 프리랜스로 주문하세요
프리랜스로 이동
이 코드를 기반으로 한 로봇이나 지표가 필요하신가요? 프리랜스로 주문하세요
프리랜스로 이동
Linear regression line with an addition of standard error channel projection.
Linear regression attempts to model the relationship between two variables by fitting a linear equation to observed data. One variable is considered to be an explanatory variable, and the other is considered to be a dependent variable. For example, a modeler might want to relate the weights of individuals to their heights using a linear regression model.
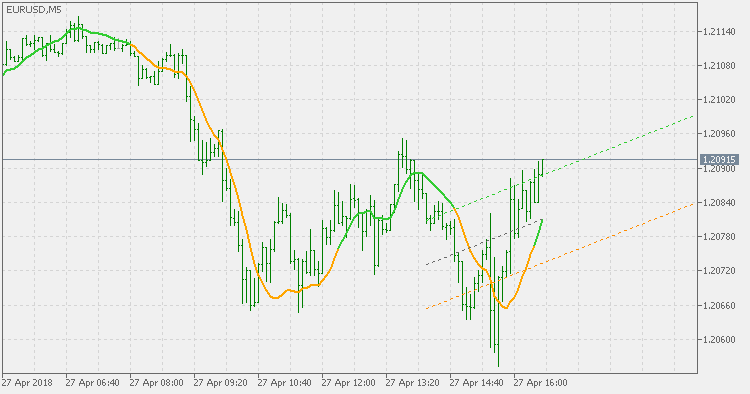
Two things to pay attention to:
- The color of the linear regression line is not based on the slope of the linear regression value but on the slope of the corresponding linear regression value for the given point.
- The channel is not a equal linear regression channel : the channel is calculated using standard error and can not be compared to the linear regression channel (except for the middle line).
 WSO & WRO Channel
This version of WSO (Widner Support Oscillator) and WRO (Widner Resistance Oscillator) shows channel on chart instead of displaying oscillator values in a separate window.
WSP & WRO
WSO (Widner Support Oscillator) and WRO (Widner Resistance Oscillator).
Volatilty Bands
This is the version that David Rooke proposes as a solution to Bollinger Bands issues.
Volatility Bands Percent
This is the version that David Rooke proposes as a solution to Bollinger Bands issues in a percent representation.