당사 팬 페이지에 가입하십시오
A multi-harmonic (or multi-tone) trigonometric model of a price series x[i], i=1..n, is given by:
x[i] = m + Sum( a[h]*Cos(w[h]*i) + b[h]*Sin(w[h]*i), h=1..H )
where:
- x[i] - past price at i-th bar, total n past prices;
- m - bias;
- a[h] and b[h] - scaling coefficients of harmonics;
- w[h] - frequency of a harmonic;
- h - harmonic number;
- H - total number of fitted harmonics.
Fitting this model means finding m, a[h], b[h], and w[h] that make the modeled values to be close to real values. Finding the harmonic frequencies w[h] is the most difficult part of fitting a trigonometric model. In the case of a Fourier series, these frequencies are set at 2*pi*h/n. But, the Fourier series extrapolation means simply repeating the n past prices into the future.
This indicator uses the Quinn-Fernandes algorithm to find the harmonic frequencies. It fits harmonics of the trigonometric series one by one until the specified total number of harmonics H is reached. After fitting a new harmonic, the coded algorithm computes the residue between the updated model and the real values and fits a new harmonic to the residue.
The indicator has the following input parameters:
- Npast - number of past bars, to which trigonometric series is fitted;
- Nfut - number of predicted future bars;
- Nharm - total number of harmonics in model;
- FreqTOL - tolerance of frequency calculations.
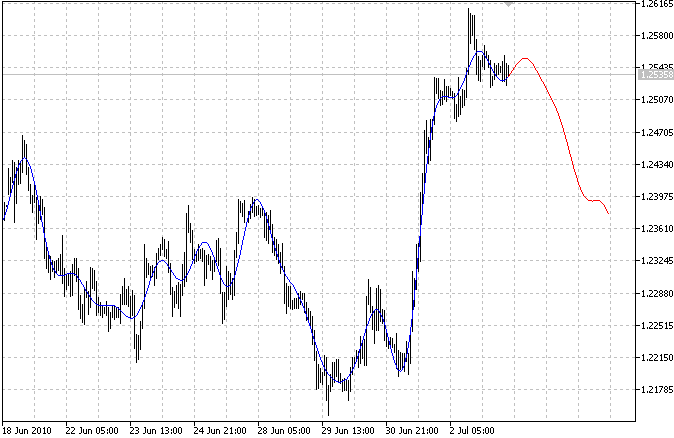
The indicator plots two curves: the blue curve indicates modeled past values and the red curve indicates the modeled future values.

 AR extrapolation of price
This indicator uses an autoregresive model to extrapolate prices
 Linear regression slope
Linear regression slope normalized to SMA.
 iS7N_TREND_1
Trend indicator with simple smoothing algorithms.
 Price prediction by Nearest Neighbor
This indicator uses the Nearest Neighbor clustering technique, also called k-NN, to search for the most similar pattern in history and use its past prices as predictions of the current pattern future prices.