LiteFinance / プロファイル


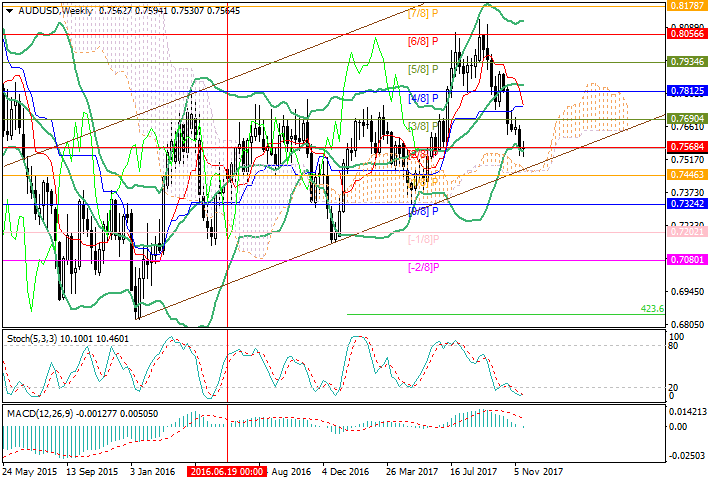
On the 4-hour chart the price has been growing for the third week and it has reached the level of 0.7770.
In case of reversal of the price, the downward correction to the level of 0.7705 (correction 23.6%, the middle line of Bollinger Bands) is possible. If the price is set above the level of 0.7770, the further growth is possible, but its potential seems restricted, as Stochastic is in the overbought area and can form a sell signal in the nearest future.
On the daily chart the price is tending to the corrections cluster at the area of 0.7780 (50.0% and 38.2%); in addition, in this area the downward correctional fan line 38.2% goes. All the facts, supported by Stochastic, which has entered the overbought area, shows the possibility of the fall to the levels of 0.7700 (correction 50.0%) and 0.7615 (correction 61.8%, the middle line of Bollinger Bands). If the price is set above the level of 0.7780 the further growth to the levels of 0.7845 (correction 61.8%) and 0.7885 (correction 23.6%) is possible, but the price should break through the downward fan.
Trading tips
Short positions can be opened at the level of 0.7780 with the targets at 0.7700, 0.7615 and stop loss at 0.7820.
Alternative scenario
Long positions can be opened at the level of 0.7800 with the targets at 0.7845, 0.7885 and stop loss around 0.7870.
AUD/USD: анализ уровней Фибоначчи
На 4-часовом графике цена растёт третью неделю подряд и к настоящему времени достигла отметки 0.7770.
В случае разворота цены возможно начало нисходящей коррекции к отметке 0.7705 (коррекция 23,6%, средняя линия полос Боллинджера). При закреплении цены выше отметки 0.7770 возможно продолжение роста, но потенциал его видится ограниченным, поскольку Стохастик находится в зоне перекупленности и в ближайшее время может сформировать сигнал на продажу.
На дневном графике цена стремится к скоплению коррекций в район 0.7780 (50,0% и 38,2%), кроме того в этом районе проходит линия нисходящего коррекционного веера 38,2%. Все это в сочетании с показанием Стохастика, который вошёл в зону перекупленности, даёт вероятность снижения к отметкам 0.7700 (коррекция 50,0%) и 0.7615 (коррекция 61,8%, средняя линия полос Боллинджера). При закреплении цены выше отметки 0.7780 существует возможность продолжения роста к отметкам 0.7845 (коррекция 61,8%) и 0.7885 (коррекция 23,6%), но для этого цене придётся пробиваться через нисходящий веер.
Основной сценарий
Открывать короткие позиции можно от уровня 0.7780 с целями 0.7700, 0.7615 и защитным приказом 0.7820.
Альтернативный сценарий
Открывать длинные позиции можно от уровня 0.7800 с целями 0.7845, 0.7885. Защитный приказ стоит выставить в районе 0.7870.

Current trend
On Wednesday US Congress finally approves the draft of the tax reform that provides for the reduction of the corporate tax rate from 35% to 21%. However, the US currency reacted to this fact only by slowing down its fall, as the decision was expected and included into the price.
However, the reduction of the tax burden on business may have long-term consequences for the US economy. First of all, the authors of the reform expect corporate income to increase, new workplaces to be creates, and salaries to rise. Another purpose of the reform is the repatriation of capitals into the USA. Trying to avoid taxes, major companies keep about $2 trln on foreign accounts. The law offers them a special deal: capitals may be repatriated one time at the rate of only 15.5%. However, the US economy will be able to feel the positive effect of the reform only in several years, while the budget deficiency will be evident at once. According to Bloomberg, it will take about $1-1.5 trln to implement the project.
The US currency may start strengthening in case of release of strong final data on the US GDP. According to forecasts, in Q3 2017 the growth of the indicator may make up 3.3% which is the biggest increase since Q3 2016.
Support and resistance
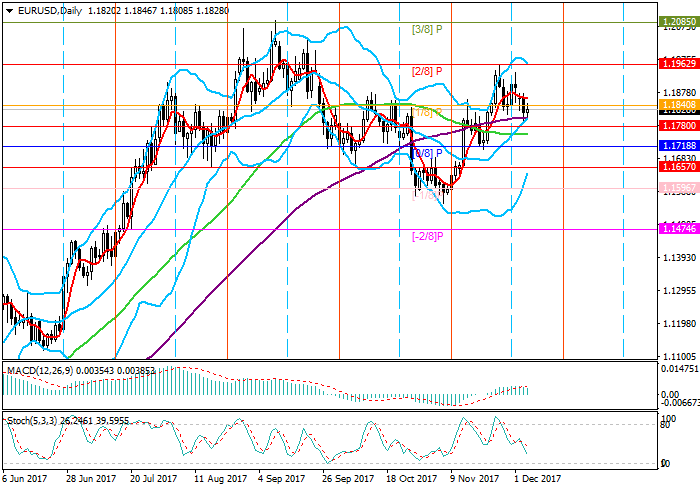
Currently the price is around 1.1900 (Murrey [7/8]). In case this level is broken out growth may continue to 1.1962 (Murrey [8/8]) and 1.2024 (Murrey [+1/8]). Stochastic is approaching the overbought area which creates the possibility of correction, but one may speak about it only when the price consolidates below 1.1840 (Murrey [6/8]). In this case the price may drop to 1.1780 (Murrey [5/8]) and 1.1718 (Murrey [4/8]).
Support levels: 1.1780, 1.1718, 1.1657.
Resistance levels: 1.1840, 1.1900, 1.1962.
Trading tips
In the current situation buy positions may be opened above 1.1900 with targets at 1.1962, 1.2024 and stop-loss at 1.1870.
Sell positions should be opened below 1.1840 with targets at 1.1780, 1.1718 and srop-loss at 1.1890.
EUR/USD: налоговая реформа не укрепила доллар
Текущая динамика
В среду Конгресс США окончательно одобрил законопроект налоговой реформы, предусматривающей снижение ставки корпоративного налога с 35% до 21%. Однако американская валюта отреагировала на этот факт лишь замедлением ослабления, поскольку это решение было ожидаемо и заложено рынком в цену.
Тем не менее, снижение налогового бремени на бизнес может иметь долгосрочные последствия для американской экономики. Прежде всего, авторы реформы рассчитывают на увеличение прибыли компаний, создание новых рабочих мест и повышение заработных плат сотрудникам. Также её целью видится репатриация капиталов в США, поскольку, уходя от налогов, крупные компании держат на иностранных счетах около 2 триллионов долларов. Для них в законе предусмотрена специальная мера: капитал можно будет репатриировать единоразово по ставке всего 15,5%. Однако положительный эффект от реформы американская экономика может почувствовать только в течение нескольких лет, в то время как бюджет ощутит дефицит средств сразу. По расчетам Bloomberg, стоимость реализации законопроекта составит 1-1,5 триллиона долларов.
Американская валюта может начать укрепление в случае публикации сильных финальных данных по ВВП США. По прогнозам, в третьем квартале текущего года рост показателя может составить 3,3%, что является самым значительным подъёмом с 3 квартала прошедшего года.
Уровни поддержки и сопротивления
В настоящее время цена находится в районе 1.1900 (Мюррей [7/8]). При пробое этого уровня вверх рост может быть продолжен к отметкам 1.1962 (Мюррей [8/8]) и 1.2024 (Мюррей [+1/8]). Приближение Стохастика к зоне перекупленности создаёт возможность коррекции, однако говорить о ней можно будет только при закреплении цены ниже отметки 1.1840 (Мюррей [6/8]). В этом случае цена может опуститься к уровням 1.1780 (Мюррей [5/8]) и 1.1718 (Мюррей [4/8]).
Уровни поддержки: 1.1780, 1.1718, 1.1657.
Уровни сопротивления: 1.1840, 1.1900, 1.1962.
Торговые сценарии
В текущих условиях покупать можно выше отметки 1.1900 с целями 1.1962, 1.2024 и стоп-лоссом 1.1870.
Продавать стоит ниже отметки 1.1840 с целями 1.1780, 1.1718 и стоп-лоссом 1.1890.
Current trend
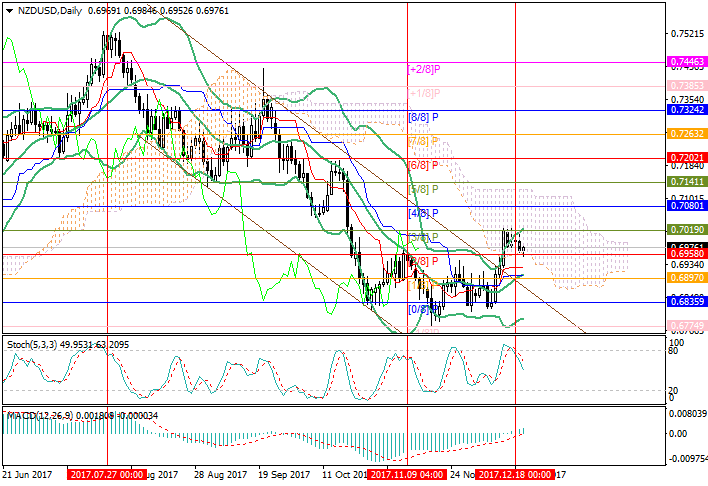
This week the pair is showing stable reduction and by now it has reached the level of 0.6958 (Murrey [2/8]). US dollar received support from the news on the tax reform that is about to be approved by the Congress. Today is the day of the last vote, after which the bill will be sent to President Trump for signing.
On the other hand, NZD is under considerable pressure of fundamental data. The index of prices for dairy products by Global Dairy Trade yesterday reduced to 3.9% which is the biggest fall since 2016. The trading balance of New Zealand was also weak. In November its deficiency exceeded forecasts and made up 1,193 mln. In the evening statistics on New Zealand GDP for Q3 2017 will be released. The indicator is expected to drop from 0.8% to 0.5% due to a long period of dry weather that caused the reduction in the volumes of production of agricultural products including the main export product – milk.
Support and resistance
Currently the pair is trading around the level of 0.6958 (Murrey [2/8]) and in case of its breakdown may drop to 0.6897 (Murrey [1/8]) and 0.6835 (Murrey [0/8]). One may speak about the growth of the price to 0.7080 (Murrey [4/8]) and 0.7140 (Murrey [5/8]) only after it consolidates above 0.7020 (Murrey [3/8]). Bollinger Bands are reversing upwards, confirming the formation of the upward trend. However, Stochastic points downwards indicating the possibility of downward correction.
Support levels: 0.6958, 0.6897, 0.6835.
Resistance levels: 0.7020, 0.7080, 0.7140.
Trading tips
In this situation sell positions may be opened if the price consolidates below 0.6958 with targets at 0.6897, 0.6835 and stop-loss at 0.6990.
Buy positions should be opened above 0.7020 with target at 0.7080, 0.7140 and stop-loss at 0.6990.
NZD/USD: коррекция может продолжиться
Текущая динамика
На текущей неделе пара уверенно снижается и к настоящему моменту достигла отметки 0.6958 (Мюррей [2/8]). Американский доллар получил поддержку новостей о налоговой реформе, которую уже практически одобрил Конгресс. Сегодня состоится последнее голосование, после чего проект поступит на подпись президенту Трампу.
С другой стороны новозеландская валюта испытывала существенное давление фундаментальных данных. Индекс цен на молочную продукции по данным Global Dairy Trade вчера снизился на 3,9%, что является самым значительным падением с 2016 года. Слабым оказался и торговый баланс Новой Зеландии. В ноябре его дефицит превысил прогнозы и составил 1193 миллиона. Вечером будет опубликована статистика по ВВП Новой Зеландии за третий квартал текущего года. Ожидается, что показатель снизится с 0,8% до 0,5% из-за продолжительной сухой погоды, вызвавшей снижение объёмов сельскохозяйственного производства, в том числе основного продукта экспорта – молока.
Уровни поддержки и сопротивления
В настоящее время пара торгуется в районе 0.6958 (Мюррей [2/8]) и в случае его пробоя может опуститься к отметкам 0.6897 (Мюррей [1/8]) и 0.6835 (Мюррей [0/8]). Говорить о росте цены к отметкам 0.7080 (Мюррей [4/8]) и 0.7140 (Мюррей [5/8]) можно будет только после закрепления цены выше отметки 0.7020 (Мюррей [3/8]). Полосы Боллинджера разворачиваются вверх, подтверждая формирование восходящего тренда. Однако Стохастик, направленный вниз, говорит о возможности нисходящей коррекции в его рамках.
Уровни поддержки: 0.6958, 0.6897, 0.6835.
Уровни сопротивления: 0.7020, 0.7080, 0.7140.
Торговые сценарии
В текущих условиях продавать можно будет при закреплении цены ниже уровня 0.6958 с целями 0.6897, 0.6835 и защитным приказом 0.6990.
Покупать стоит выше уровня 0.7020 с целью 0.7080, 0.7140 и защитным приказом 0.6990.
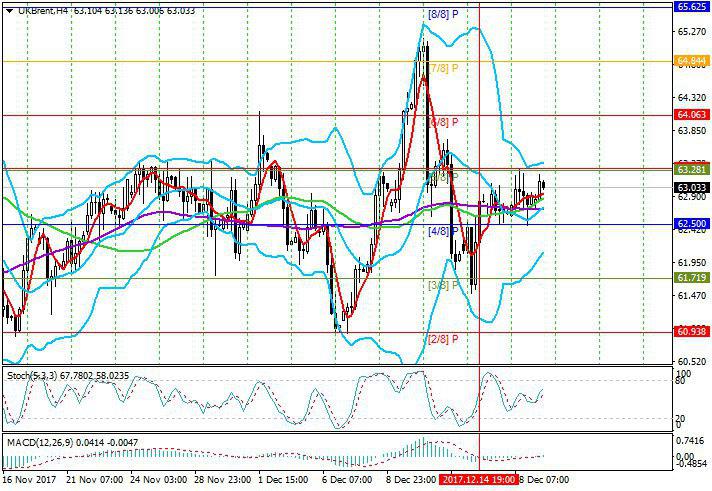
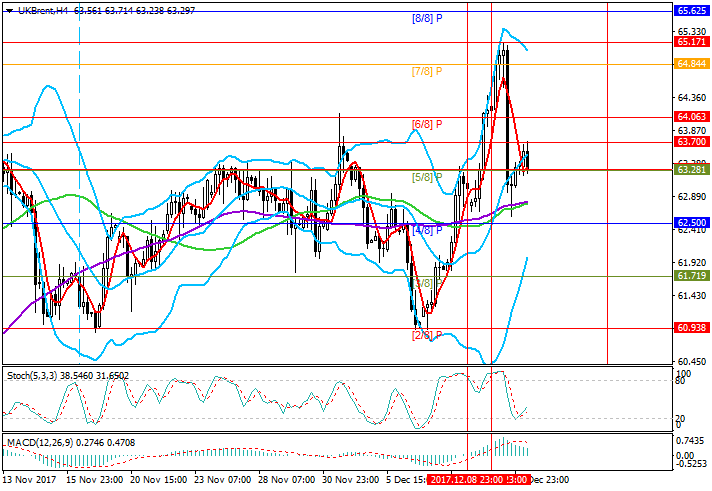
In the H4 chart the price has been trading within the range of 63.28 ([5/8])-62.50 ([4/8]) for the third session in a row. The key level for the “bulls” seems to be 63.28. In case of its breakthrough growth may continue to 64.06 ([6/8]) and 64.84 ([7/8]). However, the drivers on the week before Christmas may be insufficient, and it will remain within the said trading range.
Generally, technical indicators show the possibility of growth: Bollinger Bands start to rise, and Stochastic is also directed upwards. One may speak about considerable reduction to 61.72 ([3/8]) and 60.93 ([2/8]) only after the price consolidates below 62.50 ([4/8]) which seems unlikely in the short term.
Support and resistance
Support levels: 62.50 ([4/8], central line of Murrey range), 61.72 ([3/8], bottom of the channel), 60.93 ([2/8])
Resistance levels: 63.28 ([5/8], top of the channel), 64.06 ([6/8]), 64.84 ([7/8]).
Trading tips
In this situation buy positions should be opened if the price consolidates above 63.28 with targets at 64.06, 64.84 and stop-loss at 63.00.
Short positions should be opened if the price moves away from 63.28 with targets at 62.50, 61.72 and stop-loss at 63.45.
Brent Crude Oil: анализ уровней Мюррея
На 4-часовом графике цена третью сессию подряд торгуется в диапазоне 63.28([5/8])-62.50([4/8]). Ключевой для «быков» видится отметка 63.28. В случае её пробоя возможно продолжение роста к уровням 64.06 ([6/8]) и 64.84 ([7/8]). Однако не исключено, что на предрождественской неделе драйверов для существенного движения цены может не хватить, и она останется в рамках указанного торгового диапазона.
Технические индикаторы в целом допускают возможность роста: полосы Боллинджера начинают подниматься, Стохастик также направлен вверх. Говорить о существенном снижении к отметкам 61.72 ([3/8]) и 60.93 ([2/8]) можно будет только при закреплении цены ниже уровня 62.50 ([4/8]), что в ближайшей перспективе видится маловероятным.
Уровни поддержки и сопротивления
Уровни поддержки: 62.50 ([4/8] центральная линия диапазона Мюррея), 61.72 ([3/8] низ канала), 60.93 ([2/8]).
Уровни сопротивления: 63.28 ([5/8] верх канала), 64.06 ([6/8]), 64.84 ([7/8]).
Торговые сценарии
В сложившейся ситуации позиции на покупку стоит открывать при закреплении цены выше 63.28 с целями 64.06, 64.84 и защитным приказом в районе 63.00.
Короткие позиции стоит открывать при отскоке цены от отметки 63.28 с целями 62.50, 61.72 и защитным приказом 63.45.
Current trend
The European currency against USD dollar remains in the side consolidation stage in the long term despite its wide channel. Euro had been consolidating against USD until the end of November due to the fall of demand for the US currency. However, dollar was strengthened by positive data on the main sectors of the US economy, namely strong December releases on the labor market, inflation, key indexes, and industrial output.
Right now the pair is trading in the wide downward channel. Today it received support from positive data on key Eurozone indexes. The upward impulse is likely to remain today due to the absence of key released from the USA. A set of data is expected from Germany on Tuesday and Wednesday and may give the pair dynamics. The main macroeconomic releases for the USA (final GDP and labor market data) are due at the end of the week.
Support and resistance
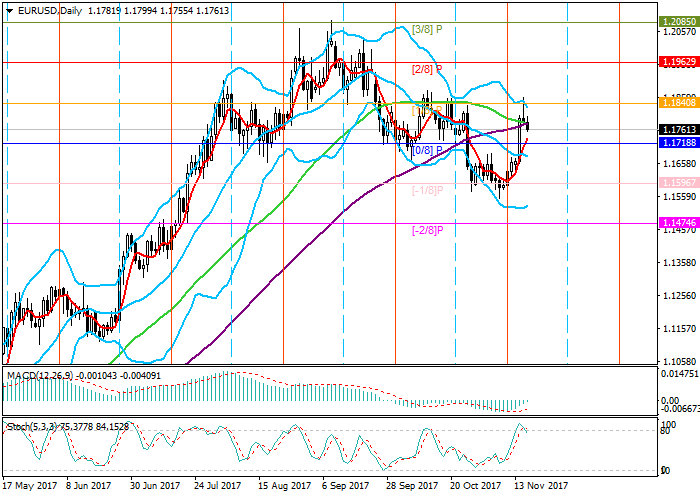
The downward trend is likely to remain until the end of the year in view of growing demand for USD after the Fed’s decision to increase the interest rate and in view of positive fundamental background. The pair may gradually go down to 1.1600, but before that it should break through the strong support level of 1.1690.
Technically, the pair remain in the medium term downward channel increasing pressure on the European currency. Indicators fail to show direction: MACD in the D1 chart is near the zero mark, and Bollinger Bands have reversed horizontally. Therefore, an alternative scenario will be the consolidation of the pair within the wide side channel.
Support levels: 1.1730, 1.1715, 1.1690, 1.1665, 1.1600, 1.1575, 1.1530, 1.1500, 1.1470.
Resistance levels: 1.1785, 1.1800, 1.1830, 1.1860, 1.1900, 1.1925, 1.1980, 1.2030.
Trading tips
Short positions may be opened from the current level with target at 1.1600 and stop-loss at 1.1870.
EUR/USD: пара остаётся в рамках нисходящего канала
Текущая динамика
Европейская валюта против американского доллара в долгосрочной перспективе остаётся в стадии боковой консолидации, несмотря на широкий канал. Весь ноябрь евро укреплялся по отношению к доллару за счёт снижения спроса на американскую валюту. В декабре инвесторский интерес к доллару начал расти, и пара сменила направление и устремилась вниз. Доллар усилили благоприятные данные по основным секторам экономики США. Так, в декабре вышли сильные данные по рынку труда, инфляции, ключевым индексам и промышленному производству.
Сейчас пара торгуется в широком нисходящем канале. Сегодня она получила поддержку на фоне хороших данных по ключевым индексам еврозоны. Вероятнее всего, сегодня восходящий импульс сохранится ввиду отсутствия ключевых новостей по США. Во вторник и среду выйдет ряд ключевых релизов по Германии, которые могут придать паре динамику. Основные макроэкономические релизы по США (окончательные данные по ВВП и рынку труда) будут опубликованы в конце торговой недели.
Уровни поддержки и сопротивления
Велика вероятность сохранения нисходящей тенденции до конца текущего года на фоне роста спроса на доллар на фоне решения ФРС США повысить процентную ставку и благоприятных фундаментальных условий. Вполне возможно постепенное снижение пары к уровню 1.1600, но перед этим ей необходимо преодолеть сильную поддержку 1.1690.
Технически, пара остается в среднесрочном нисходящем канале, что увеличивает давление на европейскую валюту. Индикаторы не могут определиться с направлением: MACD на дневном графике находится вблизи нулевой отметки, а полосы Боллинджера выстроились горизонтально. В этой связи альтернативным сценарием будет консолидация пары в рамках широкого бокового канала.
Уровни поддержки: 1.1730, 1.1715, 1.1690, 1.1665, 1.1600, 1.1575, 1.1530, 1.1500, 1.1470.
Уровни сопротивления: 1.1785, 1.1800, 1.1830, 1.1860, 1.1900, 1.1925, 1.1980, 1.2030.
Торговые сценарии
Выставлять короткие позиции можно от текущего уровня с целью 1.1600 и стоп-лоссом 1.1870.

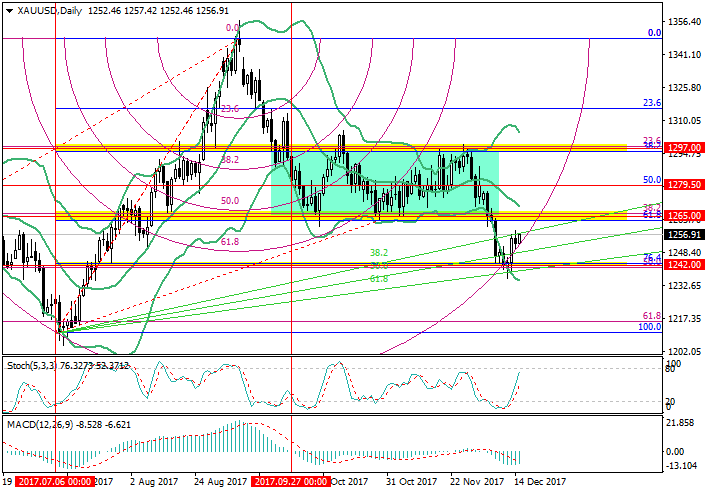
On the 4-hour chart the price is growing after the reversal around 1240.00. Now the “bullish” targets are the level of 1260.05 (correction 38.2%) and 1267.50 (correction 50.0%), approximately coinciding with the lower border of the sideways channel for D1 chart and being a key level for the further growth. If the price is set below the level of 1250.90 (correction 23.6%, the price can return to 6 months lows at the area of 1240.00.
On the daily chart the price оrebounded from the correction cluster 1242.00 (50.0% for W1, 76.4% for D1) and is now trying to grow through the upward upcoming fan. Key “bullish” level is the correction cluster around 1265.00 (38.2% for W1 and 61.8% for D1) and the middle line of Bollinger Bands behind it. After the breakout of the levels the price can return to the long term horizontal channel and can grow to the levels of 1279.50 (correction 50.0%) and 1297.00 (correction cluster 23.6% for W1 and 38.2% for D1). However, the possibility of the reversal of the price 1265.00, which is the strong “mirror” resistance and return of the price to the area of 1242.00 is high.
Main scenario
Short positions can be opened below the level of 1250.00 or after the rebound at the level of 1265.00 with the target at 1242.00 and stop loss 1256.00 and 1268.00.
Alternative scenario
Long positions can be opened above the level of 1267.50 with the targets at 1279.50, 1297.00 and stop loss around 1264.00.
XAU/USD: анализ уровней Фибоначчи
На 4-часовом графике цена растёт, развернувшись в районе 1240.00. В настоящее время целями «быков» видятся отметки 1260.05 (коррекция 38,2%) и 1267.50 (коррекция 50,0%), которая примерно совпадает с нижней границей бокового канала для графика D1 и является ключевой для дальнейшего значительного роста. При закреплении цены ниже отметки 1250.90 (коррекция 23,6%) вероятно возвращение цены к шестимесячным минимумам в район 1240.00.
На дневном графике цена отбилась от скопления коррекций 1242.00 (50,0% для W1, 76,4% для D1) и теперь пытается расти, пробиваясь через восходящий встречный веер. Ключевым для «быков» видится скопление коррекций в районе 1265.00 (38,2% для W1 и 61,8% для D1) и находящаяся за ним средняя линия полос Боллинджера. При пробое этих отметок цена вернётся в долгосрочный горизонтальный канал и может подняться к отметкам 1279.50 (коррекция 50,0%) и 1297.00 (скопление коррекций 23,6% для W1 и 38,2% для D1). Однако существует значительная вероятность разворота цены в районе 1265.00, который выступает сильным зеркальным сопротивлением и возвращения цены в район 1242.00.
Основной сценарий
Продавать стоит ниже уровня 1250.00 или при отскоке цены от уровня 1265.00 с целью 1242.00 и защитными приказами 1256.00 и 1268.00.
Альтернативный сценарий
Покупать можно при закреплении цены выше уровня 1267.50 с целями 1279.50, 1297.00. Защитный приказ стоит выставить в районе 1264.00.
This is a Incredible Expert Advisor for trading with any currency pair or securities on Forex. Expert Advisor is distinguished by stable income and may trade at any time interval.
Operating principle is based on Martingale system (When the price goes against it, in a certain period of time depending on the settings it makes one more transaction with an increased lot size and pushes the general take profit to the non-loss making level).
Stable income more than 1200% for the 1st year (verified).
A bit risky are unpredictable price flare-ups at 500-2000 and more points “in the wrong direction”, what may happen at economic crash of the country, war, major terroristic acts, etc. But this happens rarely (once in 2 years). One may learn about this from TV beforehand and suspend the work of the advisor for a week or less.
Expert Advisor is fully optimized and ready to work.
Expert Advisor earns 300$ per month from deposit and 1500$ by lot=0.01.
With further increase of the lot size Expert Advisor will earn more and more.
RECOMENDATION:
_____________________________________________
1/500
Pair: EUR/USD
Leverage: 1/500
Deposit: 1500$
Lots: 0.01
lotdecimal=2 (1 = mini lots, 2 = micro lots).
Time period: 5M - Í1 (recomendation H1)
Profit in month: about 400$
______________________________________________
Current trend
Yesterday US dollar decreased against Swiss franc, developing the “bearish” dynamics of the last week, caused by the mixed November US employment market data publication.
In the beginning of the new week USD is under pressure due to poor JOLTS Job Openings release and correctional market moods before Fed’s meeting on Wednesday, December, 13: investors are waiting for the growth if the interest rate by 1.50% with the possibility of more than 90%. In addition, new economical forecasts and regulator’s head Jane Yellen’s speech will be published during the meeting.
The Bank of England, NSB and ECB interest rate meetings are due on Thursday. The banks are not expected to change their monetary policies, but new forecasts and the commentaries of regulators’ heads will be important.
Support and resistance
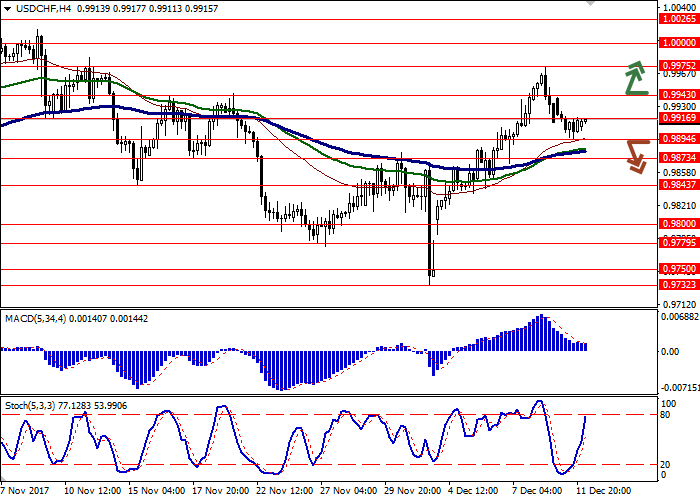
On the daily chart, Bollinger Bands are moderately growing. The price range is widening and reacts to recent instrument’s attempt to reverse poorly. It is better to use channel-trading strategy.
MACD is ready to reverse downwards, keeping buy signal (the histogram is above the signal line). It is better to wait until the signal is formed.
Stochastic reacted to USD fall and rapidly reversed downwards, reflecting the growing possibility of correctional dynamics development in the short or very short term.
Resistance levels: 0.9916, 0.9943, 0.9975, 1.0000.
Support levels: 0.9894, 0.9873, 0.9843, 0.9800.
Trading tips
Long positions can be opened after breakout of the level 0.9943 with the targets at 1.0000–1.0026 and stop loss at 0.9910. Implementation period: 2–3 days.
Short positions can be opened after breakout of the level 0.9894 with the targets at 0.9820–0.9800 and stop loss at 0.9925. Implementation period: 2-3 days.
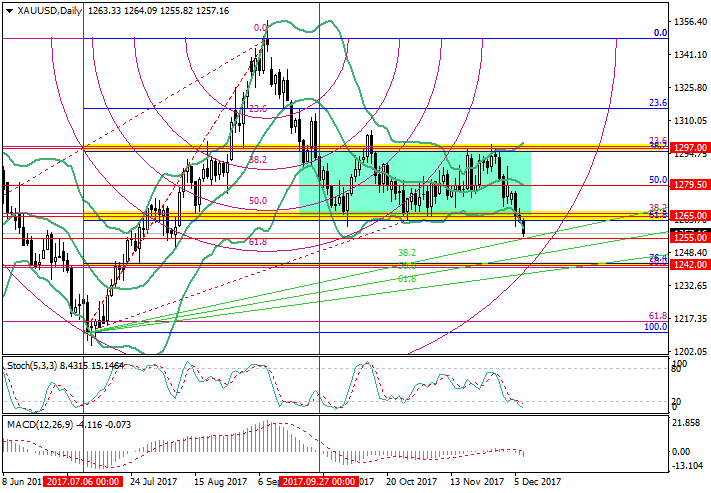
In the H4 chart the price has been showing a downward trend for the second week in a row. By now it has tested the level of 1255.70 and, according to MACD histogram that is increasing in the negative zone and Bollinger Bands directed downwards, it ready to continue reduction. In case of reversal the price may be corrected to the middle line of Bollinger Bands at 1266.00 (correction by 23.6%).
D1 chart is more interesting. The price has broken out the lower border of the horizontal channel (around 1265.00) within which it has been trading since September. By now the quotes have potential for further reduction to the gathering of corrections at 1242.00 (50,0% for W1, 76,4% for D1). However, to do so they would have to break through the upward fan. The key area for the “bulls” is 1265.00 (gathering of 38.2% correction for W1 and 61.8% for D1). In case the price returns to the side channel, growth may continue to 1279.50 (correction 50.0% for D1, middle line of Bollinger Bands) and 1297.00 (gathering of corrections 23.6% for W1 and 38.2% for D1). Indicators show mixed signals. MACD histogram is growing in the negative zone. Bollinger Bands start to diverge confirming the formation of the downward trend. However, Stochastic has entered the oversold area which may cause the formation of a buy signal.
Trading tips
Sell positions should be opened below the level of 1255.00 with target at 1242.00 and stop-loss at 1262.00.
Alternative scenario
Buy positions may be opened if the price consolidates above the level of 1265.00 with targets at 1279.50, 1297.00. Stop-loss should be placed around 1257.00
XAU/USD: анализ уровней Фибоначчи
На 4-часовом графике цена вторую неделю демонстрирует нисходящий тренд. В настоящее время она протестировала отметку 1255.70 и, судя по показаниям гистограммы MACD, увеличивающейся в отрицательной зоне, и полос Боллинджера, направленных вниз, готова продолжить снижение. В случае разворота цена может скорректироваться к средней линии полос Боллинджера в район 1266.00 (коррекция 23,6%).
График D1 более интересен. Здесь цена пробила нижнюю границу горизонтального канала (район 1265.00), в рамках которого торговалась с сентября. В настоящее время котировки имеют потенциал дальнейшего снижения к скоплению коррекций в районе 1242.00 (50,0% для W1, 76,4% для D1). Однако для этого им придется пробиться через встречный восходящий веер. Ключевым для «быков» видится район 1265.00 (скопление коррекций 38,2% для W1 и 61,8% для D1). При возвращении цены в рамки бокового канала возможно продолжение роста к отметкам 1279.50 (коррекция 50,0% для D1, средняя линия полос Боллинджера) и 1297.00 (скопление коррекций 23,6% для W1 и 38,2% для D1). Показания индикаторов неоднозначны. Гистограмма MACD увеличивается в отрицательной зоне. Полосы Боллинджера начитают расхождение, подтверждая формирование нисходящей тенденции. Однако Стохастик вошел в зону перепроданности, что чревато формированием сигнала на покупку.
Торговые сценарии
Продавать стоит ниже уровня 1255.00 с целью 1242.00 и защитным приказом 1262.00.
Альтернативный сценарий
Покупать можно при закреплении цены выше отметки 1265.00 с целями 1279.50, 1297.00. Защитный приказ стоит выставить в районе 1257.00.
Current trend
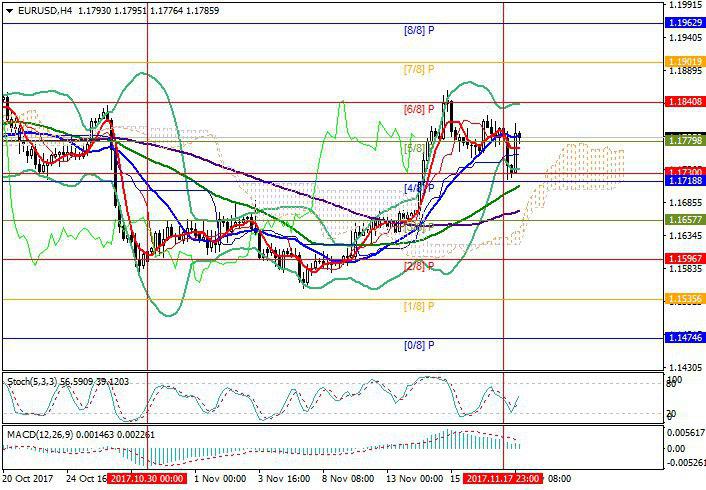
During the current week the pair is trading near the level of 1.1840 (Murrey [1/8]) but is unable to move below it because it is supported by the middle line of Bollinger Bands. In the near future the price may remain within the range of 1.1800-1.1850 although potential of reduction to 1.1718 (Murrey [0/8]) remains. Still, investors are unlikely to take risks before Friday releases from the US labor market (the indicator is about to reduce from 260K to 200K).
Moreover, market is unstable due to the uncertain situation with the US state debt limit. The Congress has to agree on its increase before Friday, otherwise the financing of governmental structures will be reduced, and some of them may stop working.
Today attention should be paid to November employment data by ADP that are considered an early indicator for federal statistics. The indicator is expected to drop from 235K to 185K causing the growth of the price and the weakening of the US currency.
Support and resistance
Technical indicators show possible continuation of the fall. Stochastic is directed downwards, and MACD histogram has crossed the signal line from above. Still, one may speak about the opening of short positions only after the price consolidates below the middle line of Bollinger Bands. In this case it may go down to 1.1718 (Murrey [0/8]) and 1.1657 (Murrey [-2/8] for H4). In case the price consolidates above 1.1840, growth may continue to 1.1962 (Murrey [2/8]).
Support levels: 1.1800, 1.1718, 1.1657.
Resistance levels: 1.1840, 1.1900, 1.1930, 1.1962.
Trading tips
Sell positions may be opened from the level of 1.1800 with targets at 1.1718, 1.1657 and stop-loss at 1.1850. Buy positions should be opened from 1.1870 with target at 1.1962 and stop-loss at 1.1840.
EUR/USD: пара в режиме ожидания
Текущая динамика
На текущей неделе пара торгуется в районе отметки 1.1840 (Мюррей [1/8]), но опуститься значительно ниже неё пока не может, поскольку её поддерживает средняя линия полос Боллинджера. В ближайшее время цена может остаться в диапазоне 1.1800-1.1850, хотя потенциал снижения в район 1.1718 (Мюррей [0/8]) сохраняется. Однако вряд ли инвесторы будут серьёзно рисковать перед публикацией в пятницу данных с американского рынка труда (ожидается уменьшение показателя с 260 до 200 тысяч).
Кроме того, нестабильности рынку придает неопредёленная ситуация с лимитом государственного долга США. До пятницы Конгресс должен договориться о его повышении, иначе фиксирование правительственных структур будет сокращено, и ряд из них может приостановить работу.
Сегодня стоит обратить внимание на ноябрьские данные по занятости от ADP, которые считаются опережающим индикатором для федеральной статистики. Ожидается, что показатель снизится с 235 до 185 тысяч, что может привести к росту цены и ослаблению американской валюты.
Уровни поддержки и сопротивления
Технические индикаторы говорят о возможном продолжении снижения. Стохастик направлен вниз, гистограмма MACD пересекла сверху вниз сигнальную линию. Однако об открытии коротких позиций можно будет говорить только при закреплении цены ниже средней линии полос Боллинджера. В этом случае она может опуститься к уровням 1.1718 (Мюррей [0/8]) и 1.1657 (Мюррей [-2/8] для H4). При закреплении цены выше отметки 1.1840 может последовать рост к уровню 1.1962 (Мюррей [2/8]).
Уровни поддержки: 1.1800, 1.1718, 1.1657.
Уровни сопротивления: 1.1840, 1.1900, 1.1930, 1.1962.
Торговые сценарии
В текущих условиях продавать можно от уровня 1.1800 с целями 1.1718, 1.1657 и защитным приказом 1.1850. Покупать стоит от уровня 1.1870 с целью 1.1962 и защитным приказом 1.1840.
FTSE, D1
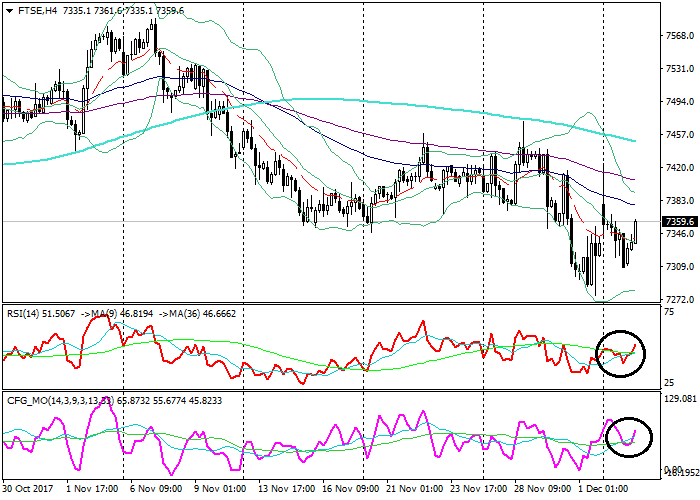
On the daily chart, the instrument is trading in the lower Bollinger band. The price remains just below its moving averages that start turning down. The RSI is growing, having failed its strong support just above the border of the oversold zone. The Composite is testing from below its longer MA.
FTSE, H4
On the 4-hour chart, the instrument is growing to the upper line of the Bollinger Bands. The price remains below the EMA65, EMA130 and SMA200 that are directed down. The RSI is growing, having broken out its longer MA. The Composite turned up as well, having failed its longer MA.
Key levels
Support levels: 7285.0 (August lows), 7200.0 (September lows), 7130.0 (October 2016 highs).
Resistance levels: 7450.0 (March highs), 7516.0 (July highs), 7545.0 (August highs).
Trading tips
The price keeps trading in a long-term sideways channel remaining near the middle of it.
Short positions can be opened from the level of 7285.0 with targets at 7200.0, 7130.0 and stop-loss at 7345.0. Validity – 3-5 days.
Long positions can be opened from the level of 7450.0 with targets at 7516.0, 7545.0 and stop-loss at 7410.0. Validity – 3-5 days.
FTSE: technical analysis
FTSE, D1
On the daily chart, the instrument is trading in the lower Bollinger band. The price remains just below its moving averages that start turning down. The RSI is growing, having failed its strong support just above the border of the oversold zone. The Composite is testing from below its longer MA.
FTSE, H4
On the 4-hour chart, the instrument is growing to the upper line of the Bollinger Bands. The price remains below the EMA65, EMA130 and SMA200 that are directed down. The RSI is growing, having broken out its longer MA. The Composite turned up as well, having failed its longer MA.
Key levels
Support levels: 7285.0 (August lows), 7200.0 (September lows), 7130.0 (October 2016 highs).
Resistance levels: 7450.0 (March highs), 7516.0 (July highs), 7545.0 (August highs).
Trading tips
The price keeps trading in a long-term sideways channel remaining near the middle of it.
Short positions can be opened from the level of 7285.0 with targets at 7200.0, 7130.0 and stop-loss at 7345.0. Validity – 3-5 days.
Long positions can be opened from the level of 7450.0 with targets at 7516.0, 7545.0 and stop-loss at 7410.0. Validity – 3-5 days.
Current trend
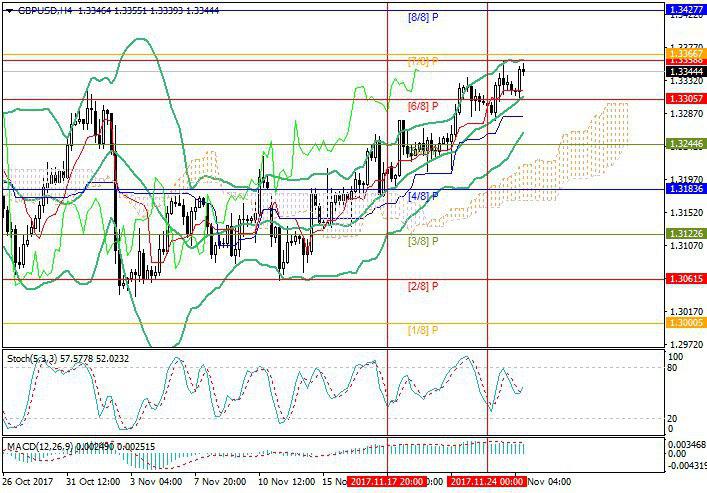
Last week the pair continued to grow and today reached the level of 1.3548 (Murrey [6/8]). By now it has been corrected to the level of 1.3488 (Murrey [5/8]) but may resume growth as the general background is negative for USD. Investors were disappointed that the Senate stopped the discussion of the tax reform and moved the vote from Thursday to Friday. The market is also unstable due to the news about possible dismissal of the US Secretary of State Rex Tillerson due to his recent conflict with President Trump.
On the other hand, the pound is supported by strong data on the UK industrial PMI. In November the indicator grew from 56.6 to 58.2 points which is the best value since 2013. Correction may continue if strong data on ISM industrial PMI are released from the USA. However, the indicator is expected to fall (from 58.7 to 58.4 points).
Support and resistance
Right now the pair is trading around 1.3488 (Murrey [5/8]) and is trying to move upwards. The key level for the “bulls” seems to be 1.3549 (Murrey [6/8]). Breaking through it will open the way for further growth of the pair to 1.3610 (Murrey [7/8]) and 1.3670 (Murrey [8/8]). The consolidation of the price below 1.3488 will lead to further reduction to 1.3427 (Murrey [4/8], middle line of Bollinger Bands) and 1.3366 (Murrey [3/8]). Technical indicators provide for correction. Stochastic is directed downwards, and MACD histogram started to fall in the positive zone and broke down the signal line.
Support levels: 1.3488, 1.3427, 1.3366.
Resistance levels: 1.3550, 1.3610, 1.3671.
Trading tips
In the current situation buy positions may be opened above the level of 1.3550 with targets at 1.3610, 1.3671 and stop-loss at 1.3510.
Sell positions should be opened below the level of 1.43888 with targets at 1.3427, 1.3367 and stop-loss at 1.3520.
GBP/USD: фунт приостановил укрепление
Текущая динамика
На текущей неделе пара продолжала расти и сегодня достигла отметки 1.3548 (Мюррей [6/8]). В настоящее время она скорректировалась к отметке 1.3488 (Мюррей [5/8]), но может возобновить рост, поскольку общий фон негативен для доллара. Инвесторов не устроило, что Сенат приостановил обсуждение налоговой реформы и перенес голосование с четверга на пятницу. Также неуверенности рынку придают сообщении о возможной отставке государственного секретаря США Рекса Тиллерсона из-за недавнего конфликта с президентом Трампом.
С другой стороны фунт поддерживают сильные данные по индексу деловой активности в производственном секторе Великобритании. В ноябре показатель вырос с 56,6 до 58,2 пункта, что является лучшим значением с 2013 года. Продолжение коррекции возможно в случае публикации в США сильных данных по индексу деловой активности в производственном секторе от ISM, однако ожидается снижение показателя (с 58,7 до 58,4 пунктов).
Уровни поддержки и сопротивления
Сейчас пара торгуется в районе 1.3488 (Мюррей [5/8]) и пытается пробиться вверх. Ключевым для «быков» видится уровень 1.3549 (Мюррей [6/8]). Его пробой откроет паре перспективу дальнейшего роста к отметкам 1.3610 (Мюррей [7/8]) и 1.3670 (Мюррей [8/8]). Закрепление цены ниже 1.3488 приведет к дальнейшему снижению в район 1.3427 (Мюррей [4/8], средняя линия полос Боллинджера) и 1.3366 (Мюррей [3/8]). Технические индикаторы предусматривают коррекцию. Стохастик направлен вниз, гистограмма MACD начала снижение в положительной зоне и пересекла сигнальную линию сверху вниз.
Уровни поддержки: 1.3488, 1.3427, 1.3366.
Уровни сопротивления: 1.3550, 1.3610, 1.3671.
Торговые сценарии
В текущих условиях покупать можно выше уровня 1.3550 с целями 1.3610, 1.3671 и защитным приказом 1.3510.
Продавать стоит ниже уровня 1.3488 с целями 1.3427, 1.3367 и защитным приказом 1.3520.

Current trend
Today the pair moved away from the resistance level of 111.65 and dropped to 111.38. This dynamics was caused by yet another launch of a ballistic missile by North Korea. International leaders traditionally criticized the launch. Donald Trump said the missile was a threat to the whole world, and South Korean President Moon Jae-in asked North Korea to stop aggression and embark on negotiations. However, the general reaction of the market was not noticeable. The announcement of North Korean officials that the main tasks of the nuclear program had been completed also gives certain optimism.
Political tension pushed economic data backwards, and they are generally negative for yen. October statistics on retail sales was weak. The indicator made up 0.0% MoM and -0.2% YoY. Retail sales in major stores also dropped by 0.77%. According to a monthly report of the Japanese government, the national economy is moderately restoring, but internal consumption does not grow fast enough due to slower salary increase rates thus putting pressure on GDP.
Support and resistance
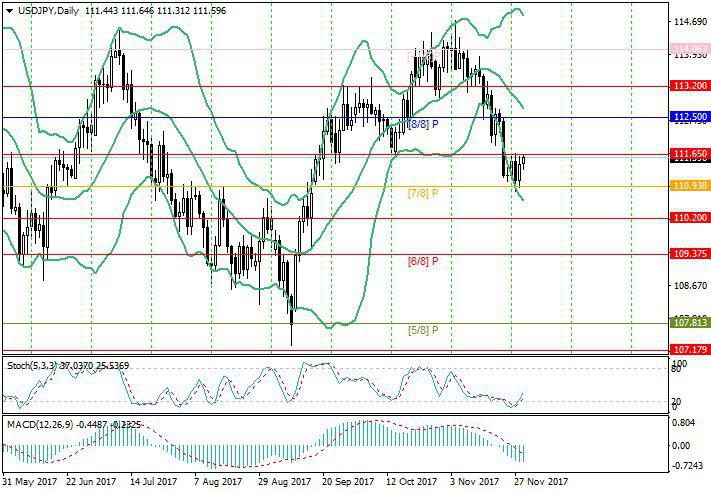
Right now the price is restoring positions after a morning fall. A key level for the “bulls” is 111.65. Its breakout will open the way for further growth to 112.50 (Murrey [8/8], middle line of Bollinger Bands). Breaking down the level of110.93 (Murrey [7/8]) will open the way for further fall to 110.20 and 109.37 (Murrey [6/8]). Technical indicators show possible upward correction. Stochastic is leaving the oversold area, and MACD histogram begins to reduce in the negative zone.
Support levels: 110.93, 110.20, 109.37.
Resistance levels: 111.65, 112.50, 113.20.
Trading tips
Buy positions may be opened above the level of 111.65 with target at 112.50 and stop-loss at 111.10.
The consolidation of the price below 110.93 and the reversal around 111.65 will make short positions relevant with targets at 110.20, 109.37 and stop-loss at 111.30 and 112.00.
USD/JPY: пара скорректировалась
Текущая динамика
Сегодня пара оттолкнулась от уровня сопротивления 111.65 и опустилась в район 111.38. Причиной этого стал очередной запуск Северной Кореей баллистической ракеты. Официальные лица традиционно осудили испытания. Президент США Трамп заявил, что ракета угрожает безопасности всего мира, а президент Южной Кореи Мун Чже Ин призвал КНДР отказаться от провокаций и сесть за стол переговоров. Однако, в целом реакцию рынка нельзя назвать существенной. Также некоторый оптимизм внушает сообщение северокорейских властей, что задачи ядерной программы выполнены.
В условиях внешнеполитической напряженности экономические данные отошли на второй план, а они в целом негативны для иены. Октябрьская статистика по розничным продажам оказалась слабой. Показатель в месячном исчислении составил 0,0%, а в годовом равнялся -0,2%. Розничные продажи в крупных магазинах также снизились на 0,7%. Согласно ежемесячному отчёту японского правительства, национальная экономика умеренно восстанавливается, но в то же время внутреннее потребление из-за слабых темпов повышения заработных плат растёт недостаточно быстро и оказывает давление на ВВП.
Уровни поддержки и сопротивления
Сейчас цена восстанавливает позиции после утреннего отката. Ключевым для «быков» видится уровень 111.65. Его пробой даст перспективу дальнейшего роста к 112.50 (Мюррей [8/8], средняя линия полос Боллинджера). Пробой вниз уровня 110.93 (Мюррей [7/8]) даст перспективу дальнейшего снижения к отметкам 110.20 и 109.37 (Мюррей [6/8]). Технические индикаторы пока говорят о возможности восходящей коррекции. Стохастик покидает зону перепроданности, гистограмма MACD начитает уменьшаться в отрицательной зоне.
Уровни поддержки: 110.93, 110.20, 109.37.
Уровни сопротивления: 111.65, 112.50, 113.20.
Торговые сценарии
В текущих условиях позиции на покупку можно открывать выше отметки 111.65 с целью 112.50 и защитным приказом 111.10.
Закрепление цены ниже уровня 110.93 или разворот в район 111.65 сделает актуальными короткие позиции с целями 110.20, 109.37 и защитными приказами 111.30 и 112.00.
Current trend
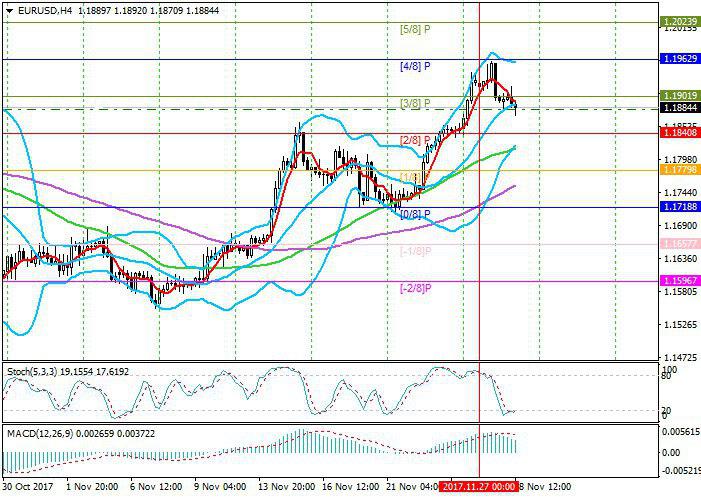
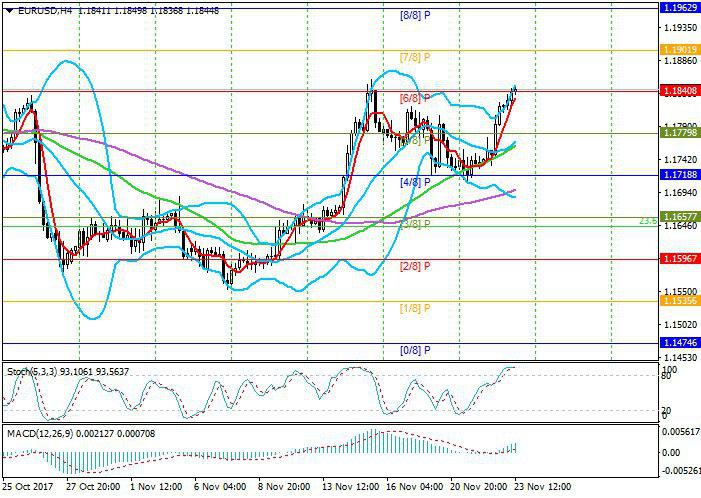
In the beginning of the week the pair was growing to the area of 1.1962 (Murray [4/8]), but was corrected and is now trading around 1.1880.
USD strengthened after Powell’s statements before the Committee on Banking, Housing, and Urban Affairs, U.S. Senate meeting. Today the Committee should make a decision upon the conformation of Fed’s head. Powell noted, that the regulator will maintain the increasing rates and reducing balance-sheets policy and support the employment market and stimulate the inflation. He also supported the banks activity on the stocks markets restriction laws, which will let US financial system be strengthened.
Powell’s statement stimulated the growth of dollar, but it’s unclear, how significant will it be. Today the investors are focused on Trumps meeting with the US Senate Republican Party members, where he will try to persuade them to vote for the tax reform package, but earlier senators Ron Johnson and Bob Corker threatened to vote against the new laws. The result of the negotiations can bring the pair significant volatility.
Support and resistance
The price weakened below the level of 1.1900 (Murray [3/8]) and the middle line of Bollinger Bands and can be corrected to the levels of 1.1840 (Murray [2/8]) and 1.1780 (Murray [1/8]). The growth to the levels of 1.2023 (Murray [5/8]) and 1.2085 (Murray [6/8]) is possible after the breakout of the level of 1.1962 (Murray [4/8]).
Resistance levels: 1.1900, 1.1962, 1.2023, 1.2085.
Support levels: 1.1840, 1.1780, 1.1718.
Trading tips
Short positions can be opened at the current level with the targets at 1.1840, 1.1780 and stop loss at 1.1930.
The consolidation of the price above the level of 1.1962 will make long positions with the targets at 1.2023, 1.2085 and stop loss at 1.1930 relevant.
EUR/USD: Пауэлл укрепил доллар
Текущая динамика
Пара начала неделю ростом в район отметки 1.1962 (Мюррей [4/8]), но затем скорректировалась и в настоящее время торгуется в районе 1.1880.
Доллар укрепился после заявлений Джерома Пауэлла накануне заседания Комитета по вопросам банкового дела Сената США. Сегодня Комитет должен вынести решение об утверждении его в должности нового главы ФРС. Пауэлл отметил, что регулятор будет продолжить политику повышения ставок и сокращения баланса и при этом поддерживать рынок труда и стимулировать инфляцию. Также он выступил в защиту законов об ограничении банковской деятельности на фондовом рынке, которые позволят усилить американскую финансовую систему.
Заявления Пауэлла стимулировали рост доллара, однако насколько он будет значительным, пока непонятно. Сегодня инвесторы ждут встречи президента Трампа с членами Республиканской партии Сената США, на которой он попытается убедить их голосовать за пакет налоговых реформ, но ранее сенаторы Рон Джонсон и Боб Коркер грозились проголосовать против новых законов. Результаты этих переговоров могут придать паре высокую волатильность.
Уровни поддержки и сопротивления
Цена опустилась ниже отметки 1.1900 (Мюррей [3/8]) и средней линии полос Боллинджера и может продолжить коррекцию к уровням 1.1840 (Мюррей [2/8]) и 1.1780 (Мюррей [1/8]). Говорить о росте цены к уровням 1.2023 (Мюррей [5/8]) и 1.2085 (Мюррей [6/8]) можно будет при пробое вверх отметки 1.1962 (Мюррей [4/8]).
Уровни сопротивления: 1.1900, 1.1962, 1.2023, 1.2085.
Уровни поддержки: 1.1840, 1.1780, 1.1718.
Торговые сценарии
Короткие позиции можно открывать от текущего уровня с целями 1.1840, 1.1780 и защитным приказом 1.1930.
Закрепление цены выше отметки 1.1962 сделает актуальными длинные позиции с целями 1.2023, 1.2085 и защитным приказом 1.1930.
Current trend
Last week pound was growing and reached the maximum since the beginning of October at the level of 1.3360 on Friday.
The investors concern more upon the possible slowing of the monetary policy tightening rate in the USA, than the Brexit negotiations of UK and EU difficulties, where the parties still cannot began to discuss trading agreements due to the fact that the Irish border issue is unclear. Irish government wants to get the guarantees from UK government, that the control on the border between North Ireland and Republic Ireland won’t be implied. Otherwise the Irish party, represented by Commissioner for Agriculture Phil Hogan threatens to block further Brexit negotiations.
Intransigence of the parties and the delaying of Brexit negotiations make business community fears that the deal won’ be done at all, and UK will leave EU without any agreements. This has led to the fact that a number of companies decreased its presence in the country, which can result in the Industrial Production and GDP fall in the UK.
Last week British Office for Budget Responsibility decreased the next year GDP growth forecast from 2.0% to 1.5%. The middle term perspectives of the currency are still unclear.
Support and resistance
Technically the price is tending to the level of 1.3366 (Murray [7/8]) and after the breakout can move upwards to the level of 1.3427 (Murray [8/8]). Otherwise the price can return to the levels of 1.3305 (Murray [6/8], the middle line of Bollinger Bands), 1.3244 (Murray [5/8]). Technical indicators reflect the growth. Bollinger Bands are pointed upwards, Stochastic reversed upwards.
Resistance levels: 1.3366, 1.3427, 1.3488.
Support levels: 1.3305, 1.3244, 1.3183.
Trading tips
Long positions can be opened above the level of 1.3366 with the target at 1.3427 and stop loss at 1.3300.
The consolidation of the price below the level of 1.3305 will make short positions with the targets at 1.3244, 1.3183 and stop loss at 1.3340 relevant.
GBP/USD: неясные перспективы
Текущая динамика
На прошедшей неделе фунт укреплялся, и в пятницу достиг максимального значения с начала октября в районе 1.3360.
Инвесторов больше пугает возможное замедление темпов ужесточения монетарной политики в США, чем трудности в переговорах Великобритании и ЕС по Brexit, где стороны по-прежнему не могут приступить к обсуждению торговых соглашений из-за неурегулированного вопроса об ирландской границе. Правительство Ирландии стремится получить от Великобритании гарантии того, что контроль на границе между британской Северной Ирландией и Республикой Ирландия вводиться не будет. В противном случае ирландцы в лице комиссара ЕС по сельскому хозяйству Фила Хогана грозят заблокировать дальнейшие переговоры по Brexit.
Неуступчивость сторон и затягивание переговоров по Brexit заставляет бизнес-сообщество опасаться, что сделка вообще не будет заключена, и Великобритания покинет ЕС без каких либо соглашений. Это уже привело к тому, что ряд компаний стало сокращать в стране своё присутствие, что может привести к падению объёмов производства и ВВП Великобритании.
На прошлой неделе британское Управление по бюджетной ответственности понизило прогноз роста ВВП в текущем году с 2,0% до 1,5%. В среднесрочные перспективы британской валюты остаются неясными.
Уровни поддержки и сопротивления
Технически цена стремится к отметке 1.3366 (уровень Мюррея [7/8]) и при его пробое может пойти вверх к уровню 1.3427 (уровень Мюррея [8/8]). В противном случае цена может вернуться к отметкам 1.3305 (уровень Мюррея [6/8], средняя линия полос Боллинджера), 1.3244 (уровень Мюррея [5/8]). Технические индикаторы пока говорят о росте. Полосы Боллинджера направлены вверх, Стохастик развернулся вверх.
Уровни сопротивления: 1.3366, 1.3427, 1.3488.
Уровни поддержки: 1.3305, 1.3244, 1.3183.
Торговые сценарии
Длинные позиции можно открывать выше уровня 1.3366 с целью 1.3427 и защитным приказом 1.3300.
Закрепление цены ниже отметки 1.3305 сделает актуальными короткие позиции с целями 1.3244, 1.3183 и защитным приказом 1.3340.
Current trend
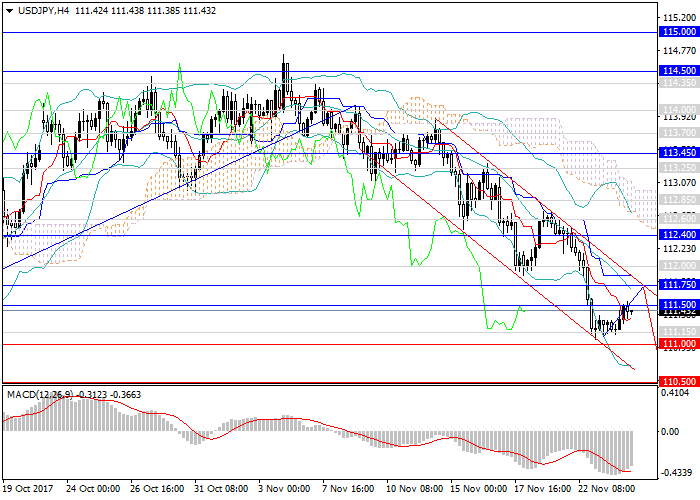
During last few trading weeks USD is rapidly falling against JPY due to the decrease of the investment attractiveness of the US currency after the slowing of the USA Fed’s monetary policy tightening. In addition, the change of the US regulator’s head affected USD negatively.
Last week favorable Q3 economy growth data were released, and yen grew significantly. There were no key macroeconomic data this week, but the momentum strengthened and the demand on Japanese currency increased, as a result the pair fell by more than 150 points. Yesterday the instrument reached the key support level of 111.00 and reversed into consolidation.
Due to US holidays in the end of the week the significant movement of the pair is not expected.
Support and resistance
In the short term the correction within the downward channel is expected, after the end of which the pair can fall to the levels of 110.50, 109.00.
At the moment the demand on yen is high, which draws the pair downwards, and if US Fed will postpone the interest rate rise to 2018, the instrument can reach the levels of 108.15, 107.50.
On the 4-hour chart technical indicators confirms the forecast, MACD short positions volumes are growing, Bollinger Bands are pointed downwards.
Resistance levels: 111.50, 111.75, 112.40, 112.60, 112.85, 113.45, 113.70, 114.00.
Support levels: 111.00, 110.50, 110.20, 109.55, 109.00, 108.15, 107.50.
Trading tips
It’s relevant to increase the volumes of short positions at the current level with the targets at 110.50, 109.00 and stop loss at 112.10.
USD/JPY: общий обзор
Текущая динамика
Последние несколько торговых недель доллар против иены стремительно снижается из-за падения инвестиционной привлекательности американской валюты после замедления ужесточения монетарной политики ФРС США. Дополнительное давление на доллар оказала смена руководства регулятора.
На прошлой неделе в Японии вышли благоприятные данные по темпам роста экономики за третий квартал текущего года, и иена значительно укрепилась. На текущей неделе не было сильных макроэкономических данных, но импульс усилился, спрос на японскую валюту возрос, в результате чего пара USD/JPY упала более чем на 150 пунктов. Вчера инструмент достиг ключевого уровня поддержки 111.00, после чего перешёл в коррекцию.
Из-за праздников в США в конце недели значительного движения пары не предвидится.
Уровни поддержки и сопротивления
В краткосрочной перспективе прогнозируется коррекция в рамках нисходящего канала, после чего пара может упасть к отметкам 110.50, 109.00.
На текущий момент иена пользуется повышенным спросом, что тянет пару вниз, а если ФРС США продолжит затягивать дальнейшее ужесточение монетарной политики и перенесёт повышение ставок на 2018 год, инструмент достигнет уровней 108.15, 107.50.
На 4-часовом графике технические индикаторы подтверждают прогноз: объём коротких позиций MACD растёт, полосы Боллинджера направлены вниз.
Уровни сопротивления: 111.50, 111.75, 112.40, 112.60, 112.85, 113.45, 113.70, 114.00.
Уровни поддержки: 111.00, 110.50, 110.20, 109.55, 109.00, 108.15, 107.50.
Торговые сценарии
Актуально наращивать короткие позиции от текущего уровня с целями 110.50, 109.00 и стоп-лоссом 112.10.
Current trend
The Thanksgiving Day is celebrated today in the USA, but dollar is under the pressure after FOMC Minutes publication. Some of FOMC members expressed their doubts in the rapid increase of the interest rate in unstable inflation growth conditions. Earlier the outgoing Fed’s head Janet Yellen stated the same doubts. On the other hand, EUR is supported by the news than the head of Social-Democratic Party Martin Schulz is ready to negotiate with Chancellor Angela Merkel upon her restricted support in case of minority party creation by her.
In addition, the “bulls” were inspired by strong statistics from EU. Markit Services PMI reached the maximum level of 56.2 points since this May, as Markit Manufacturing PMI reached the record 60.0 points.
Support and resistance
Technically the price is testing the level of 1.1840 (Murray [6/8]) and after consolidation above it can grow to the levels of 1.1900 (Murray [7/8]) and 1.1962 (Murray [8/8]). Stochastic is in the overbought area, so the correction to the level of 1.1780 (Murray [5/8], the middle line of Bollinger Bands) is possible. The growth seems more likely.
Resistance levels: 1.1840, 1.1900, 1.1962.
Support levels: 1.1780, 1.1718, 1.1657.
Trading tips
Long positions can be opened above the level of 1.1840 with the targets at 1.1900, 1.1962 and stop loss at 1.1800.
Short positions can be opened from the level of 1.1820 with the targets at 1.1780 and 1.1718 and stop loss at 1.1850.
EUR/USD: американская валюта под давлением
Текущая динамика
США сегодня празднует День благодарения, но доллар находится под давлением после публикации проколов заседания ФРС. Некоторые члены FOMC высказали сомнения в слишком быстром повышении процентных ставок в условиях, когда рост инфляции нестабилен. Ранее подобные опасения выражала уходящий председатель ФРС Джанет Йеллен. С другой стороны, евро поддерживают данные о том, что глава Социал-демократической партии Германии Мартин Шультц готов начать переговоры с канцлером Ангелой Меркель о её ограниченной поддержке в случае создания последней правительства меньшинства.
Кроме того, «быков» вдохновила сильная европейская статистика. Индекс деловой активности в сфере услуг достиг максимального уровня с мая текущего года на отметке 56,2 пункта, а аналогичный индекс в производственной сфере достиг рекордных 60,0 пункта.
Уровни поддержки и сопротивления
Технически цена тестирует отметку 1.1840 (уровень Мюррея [6/8]) и при закреплении выше неё может продолжить рост к уровням 1.1900 (уровень Мюррея [7/8]) и 1.1962 (уровень Мюррея [8/8]). Стохастик находится в зоне перекупленности, что даёт перспективу коррекции к отметке 1.1780 (уровень Мюррея [5/8], средняя линия полос Боллинджера). Вариант продолжения роста видится более предпочтительным.
Уровни сопротивления: 1.1840, 1.1900, 1.1962.
Уровни поддержки: 1.1780, 1.1718, 1.1657.
Торговые сценарии
Длинные позиции можно открывать выше отметки 1.1840 с целями 1.1900, 1.1962 и защитным приказом 1.1800.
Короткие позиции стоит открывать от отметки 1.1820 с целями 1.1780 и 1.1718 и защитным приказом 1.1850.
Current trend
On Tuesday the pair made an attempt of upward correction and rose to 0.7590. Investors acted upon the statement of the head of RBA Philip Lowe who said that at that time there was no need to increase the interest rates, but it could appear soon. The state of the economy indicates that the regulator is likely to increase the interest rate with its next decision. However, the optimism of the market did not last long, as Lowe gave no hints regarding the time of the increase. Currently the price is aiming at November minimums at 0.7535.
The minutes of the Fed’s November meeting will be released in the evening. Investors will look for confirmations of their expectations regarding one more increase of the interest rate in the USA in December.
Support and resistance
Technically the pair is consolidating around 0.7568 (Murrey level [2/8]) and may remain there until the end of the week. The consolidation of the price below 0.7568 will open the way for reduction to 0.7446 (Murrey level [1/8], lower border of the upward channel). Still, reversal and beginning of growth to 0.7690 (Murrey [3/8]) and 0.7812 (Murrey [4/8]) seem more likely. This is confirmed by the fact that Stochastic starts to reverse in the oversold areas and Bollinger Bands have turned to horizontal movement.
Support levels: 0.7568, 0.7446, 0.7324.
Resistance levels: 0.7690, 0.7812.
Trading tips
Long positions should be opened from 0.7600 with targets at 0.7690, 0.7812 and stop-loss at 0.7560.
Short positions may be opened from the level of 0.7520 with targets at 0.7446, 0.7324 and stop-loss at 0.7560.
AUD/USD: Филипп Лоу остановил снижение пары
Текущая динамика
Во вторник пара предприняла попытку восходящей коррекции, поднявшись в район 0.7590. Инвесторов обнадёжил глава Резервного Банка Австралии Филипп Лоу, который отметил, что в данный момент необходимости в повышении процентных ставок нет, однако в скором времени она может возникнуть. По крайней мере, экономическая конъюнктура такова, что следующим решением регулятора наверняка станет увеличение процентной ставки. Однако оптимизм рынка быстро иссяк, поскольку намёков на сроки повышения не последовало. В настоящее время цена стремится к ноябрьским минимумам в район 0.7535.
Вечером будут опубликованы протоколы ноябрьского заседания ФРС. В них инвесторы могут найди подтверждение своим ожиданиям относительно очередного повышения процентной ставки в США в декабре.
Уровни поддержки и сопротивления
Технически пара консолидируется в районе 0.7568 (уровень Мюррея [2/8]) и может остаться там до конца недели. Закрепление цены ниже уровня 0.7568 даст перспективы снижения к отметке 0.7446 (уровень Мюррея [1/8], нижняя граница восходящего канала). Однако более вероятным видится разворот и начало роста к отметкам 0.7690 (уровень Мюррея [3/8]) и 0.7812 (уровень Мюррея [4/8]). Об этом говорит начало разворота Стохастика в зоне перепроданности и переход полос Боллинджера к горизонтальному движению.
Уровни поддержки: 0.7568, 0.7446, 0.7324.
Уровни сопротивления: 0.7690, 0.7812.
Торговые сценарии
Длинные позиции стоит открывать от уровня 0.7600 с целями 0.7690, 0.7812 и защитным приказом 0.7560.
Короткие позиции можно открывать от уровня 0.7520 с целями 0.7446, 0.7324 и защитным приказом 0.7560.
Current trend
The pair started the week with a fall to 1.1723. The market acted on the data on the termination of negotiations on the formation of a new German government. Free Democratic Party headed by Christian Lindener refused to become a part of the coalition government with CDU/CSU. Now Chancellor Angela Merkel may either create a government of parliamentary minority and reach separate agreements with the opposition on key bills, or hold an extraordinary parliamentary election. Anyway, instability in the German government will put pressure on EUR in the medium term.
After the opening of the European session the pair regained positions and is now trading around 1.1790. During the day the market is waiting for the speech by Mario Draghi in the European Parliament. However, the head of ECB is unlikely to say something new about the monetary policy. He stated several times that despite the success of the European economy stimulation had to be continued.
Support and resistance
Currently the price is located near 1.1780 (Murrey level [5/8]). Its breakdown may return the quotes to 1.1730 (lower line of Bollinger Bands)-1.1718 (Murrey [4/8]). One may speak about considerable growth in case the price consolidates above 1.1840 (Murrey [6/8]). In this case growth may continue to 1.1900 (Murrey [7/8]) and 1.1962 (Murrey [8/8]). Technical indicators don’t give a clear signal. Bollinger Bands are switching to the horizontal movement. MACD histogram is stable in the negative zone. Stochastic is directed upwards.
Support levels: 1.1780, 1.1718, 1.1657.
Resistance levels: 1.1840, 1.1900, 1.1962.
Trading tips
Short positions should be opened below 1.1780 with targets at 1.1718, 1.1657 and stop-loss at 1.1820.
Long positions may be opened above 1.1840 with targets at 1.1900 and 1.1962 and stop-loss at 1.1800.
EUR/USD: нестабильность в Германии давит на евро
Текущая динамика
Пара начала неделю снижением к отметке 1.1723. Рынок отыгрывал данные о срыве переговоров по созданию нового правительства Германии. Свободная демократическая партия во главе c Кристианом Линднером отказалась войти в состав коалиционного правительства вместе с ХДС/ХСС. Теперь канцлер Ангела Меркель может создать правительство парламентского меньшинства и договариваться с оппозицией ситуативно, при голосовании по ключевым законопроектам, или пойти на проведение внеочередных парламентских выборов. В любом случае, нестабильность в немецком правительстве в среднесрочной перспективе будет оказывать давление на евро.
После открытия европейской сессии пара отыграла потери и сейчас торгуется в районе 1.1790. В течение дня рынок ждёт выступления Марио Драги в Европейском парламенте. Однако вряд ли глава ЕЦБ сообщит что-то новое о монетарной политике. Он уже не раз говорил, что стимулирование пока необходимо продолжать, несмотря на успехи европейской экономики.
Уровни поддержки и сопротивления
В настоящее время цена находится в районе 1.1780 (уровень Мюррея [5/8]). Его пробой вниз может вернуть котировки в район 1.1730 (нижняя линия полос Боллинджера)-1.1718 (уровень Мюррея [4/8]). Говорить о значительном росте можно будет в случае закрепления цены выше отметки 1.1840 (уровень Мюррея [6/8]). В этом случае продолжение роста возможно к уровням 1.1900 (уровень Мюррея [7/8]) и 1.1962 (уровень Мюррея [8/8]). Показания технических индикаторов не дают чёткой картины. Полосы Боллинджера переходят к горизонтальному движению. Гистограмма MACD стабильна в отрицательной зоне. Стохастик направлен вверх.
Уровни поддержки: 1.1780, 1.1718, 1.1657.
Уровни сопротивления: 1.1840, 1.1900, 1.1962.
Торговые сценарии
Короткие позиции стоит открывать ниже уровня 1.1780 с целями 1.1718, 1.1657 и защитным приказом 1.1820.
Длинные позиции можно открывать выше уровня 1.1840 с целями 1.1900, 1.1962 и защитным приказом 1.1800.
Current trend
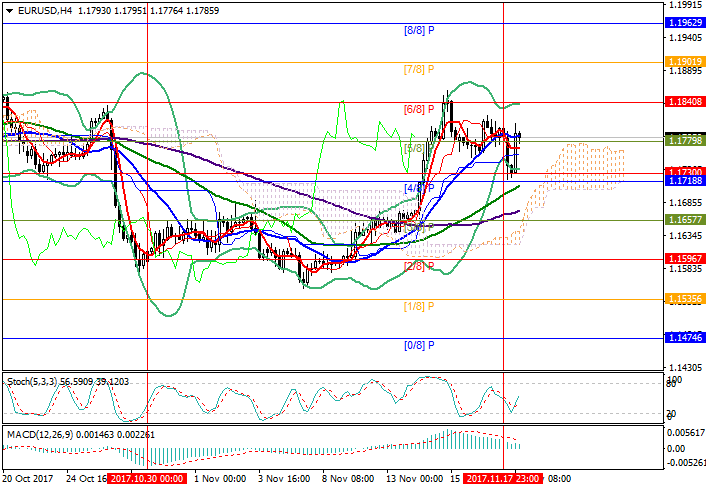
On Wednesday the pair started correction from the level of 1.1840 (Murrey [1/8] for D1). USD was supported by positive data on inflation in the USA. Basic CPI that the Fed uses to make decisions on changes in the interest rate, grew by 1.8% (after remaining on the level of 1.7% for five months). This gave the investors confidence that the regulator would increase the interest rate during its December meeting.
Today’s inflation statistics from Eurozone was negative for euro. CPI remained on the level of 1.4% and its basic variant dropped from 1.1% to 0.9%. Moreover, the European currency is under pressure from the data that German Chancellor Angela Merkel has problems forming the new German government.
Support and resistance
Currently the price is moving towards the level of 1.1718 (Murrey [0/8] for D1) and may well reach it if today’s data on US industrial output prove to be strong (the indicator is expected to grow from 0.3% to 0.5%). Breaking down the level of 1.1718 will open the way for further decrease to 1.1657 (Murrey level [3/8] for Н4) and 1.1596 ([-1/8] for D1). One may speak about considerable growth after the price breaks out the level of 1.1840. In this case the targets of the “bulls” will be 1.1900 (Murrey level [7/8] for H4) and 1.1962 ([2/8] for D1). Technical indicators show opposite signals. Stochastic is leaving the overbought area forming a sell signal. MACD histogram is about to move to the positive zone and form a buy signal.
Support levels: 1.1718, 1.1657, 1.1596.
Resistance levels: 1.1840, 1.1900, 1.1962.
Trading tips
Short positions should be opened at the current price with targets at 1.1718, 1.1657 and stop-loss at 1.1790.
Long positions may be opened above 1.1840 with targets at 1.1900, 1.1962 and stop-loss 1.1800.
EUR/USD: инфляция толкает пару вниз
Текущая динамика
В среду пара начала коррекцию из района 1.1840 (уровень Мюррея [1/8] для D1). Поддержку доллару оказали позитивные данные по инфляции в США. Базовый индекс потребительских цен, на который ФРС опирается при решении вопросов об изменении процентной ставки, в октябре вырос на 1,8% (а до этого пять месяцев составлял 1,7%). Это обстоятельство вновь уверило инвесторов в повышении регулятором процентной ставки на декабрьском заседании.
Сегодня вышла статистика по инфляции в еврозоне, которая оказалась негативной для евро. Индекс потребительских цен остался на уровне 1,4%, а его базовый аналог снизился с 1,1% до 0,9%. Кроме того, на европейскую валюту давят данные о проблемах канцлера Ангелы Меркель в формировании нового правительства Германии.
Уровни поддержки и сопротивления
В настоящее время цена стремится к отметке 1.1718 (уровень Мюррея [0/8] для D1) и вполне может её достигнуть в случае выхода сегодня сильных данных по промышленному производству США (ожидается рост показателя с 0,3% до 0,5%). Пробой отметки 1.1718 даст перспективу дальнейшего снижения к уровням 1.1657 (уровень Мюррея [3/8] для Н4) и 1.1596 (уровень Мюррея [-1/8] для D1). Говорить о значительном росте можно будет при пробое ценой вверх отметки 1.1840. В этом случае целями «быков» могут стать уровни 1.1900 (уровень Мюррея [7/8] для H4) и 1.1962 (уровень Мюррея [2/8] для D1). Технические индикаторы демонстрируют противоположные сигналы. Стохастик выходит из зоны перекупленности, формируя сигнал на продажу. Гистограмма MACD готовится перейти в положительную зону и сформировать сигнал на покупку.
Уровни поддержки: 1.1718, 1.1657, 1.1596.
Уровни сопротивления: 1.1840, 1.1900, 1.1962.
Торговые сценарии
Короткие позиции стоит открывать по текущей цене с целями 1.1718, 1.1657 и защитным приказом 1.1790.
Длинные позиции можно открывать выше отметки 1.1840 с целями 1.1900, 1.1962 и защитным приказом 1.1800.