LiteFinance / プロファイル

The online ECN broker LiteFinance (ex. LiteForex) has been providing its clients access to Tier 1 liquidity in the currency, commodity, and stock market since 2005. All major currency pairs and cross rates, oil, precious metals, stock indexes, blue chips, and the largest set of cryptocurrency pairs can be traded at LiteFinance (ex. LiteForex).

LiteFinance
XAG/USD: consolidation continues
Current trend
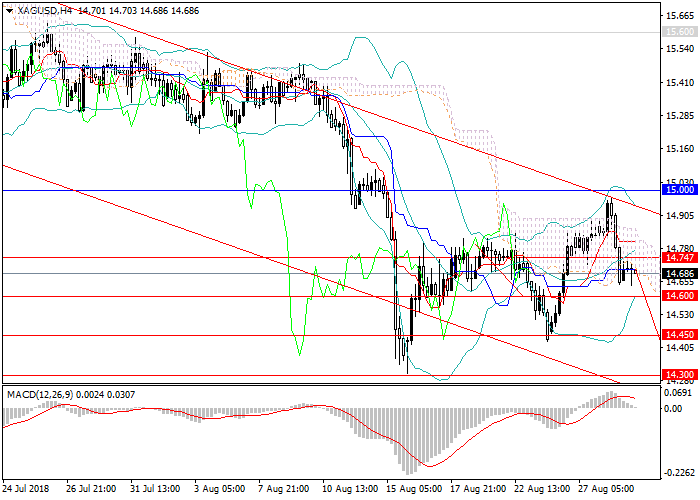
The price of silver keeps a downward trend, having lost 20% over the past few months, and doesn't recover.
Since mid-August, quotes have moved to lateral consolidation but have not yet moved out of the descending channel. At the end of August, the price began to recover, having passed strong resistance levels of 14.75, 14.85. Later, the instrument stopped at the key resistance level of 15.00, after which the price quickly went down amid asset sales. Some recovery is due to the fact that over the past two weeks the dollar has significantly weakened against major currencies. It is the dollar rate and the political background that will be the catalysts for the price.
At the end of the week, there will be revised data on the growth rate of the US economy in Q2 2018.
Support and resistance
In the medium term, lateral consolidation after a significant decline is expected. In the near future, we can see the price at local minima of 14.45, 14.30, after which the upward wave will again form to 15.00. No sharp move down or a significant recovery are expected, therefore, trade from the borders of the lateral range is relevant.
Technical indicators on H4 chart and below confirm the forecast of the formation of the lateral channel: MACD indicates a decrease in the volume of short positions, the signal line is near the zero line, and Bollinger Bands have lined up horizontally.
Support levels: 14.60, 14.45, 14.30, 13.75, 13.50, 13.00.
Resistance levels: 14.75, 14.75, 15.00, 15.60, 15.90, 16.10, 16.40, 16.50, 16.75, 16.85.
Current trend
The price of silver keeps a downward trend, having lost 20% over the past few months, and doesn't recover.
Since mid-August, quotes have moved to lateral consolidation but have not yet moved out of the descending channel. At the end of August, the price began to recover, having passed strong resistance levels of 14.75, 14.85. Later, the instrument stopped at the key resistance level of 15.00, after which the price quickly went down amid asset sales. Some recovery is due to the fact that over the past two weeks the dollar has significantly weakened against major currencies. It is the dollar rate and the political background that will be the catalysts for the price.
At the end of the week, there will be revised data on the growth rate of the US economy in Q2 2018.
Support and resistance
In the medium term, lateral consolidation after a significant decline is expected. In the near future, we can see the price at local minima of 14.45, 14.30, after which the upward wave will again form to 15.00. No sharp move down or a significant recovery are expected, therefore, trade from the borders of the lateral range is relevant.
Technical indicators on H4 chart and below confirm the forecast of the formation of the lateral channel: MACD indicates a decrease in the volume of short positions, the signal line is near the zero line, and Bollinger Bands have lined up horizontally.
Support levels: 14.60, 14.45, 14.30, 13.75, 13.50, 13.00.
Resistance levels: 14.75, 14.75, 15.00, 15.60, 15.90, 16.10, 16.40, 16.50, 16.75, 16.85.
LiteFinance
NZD/USD: the downward tendency remains
Current trend
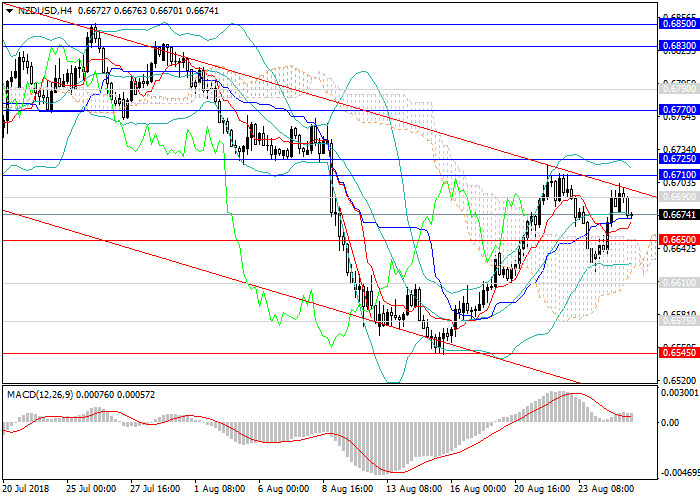
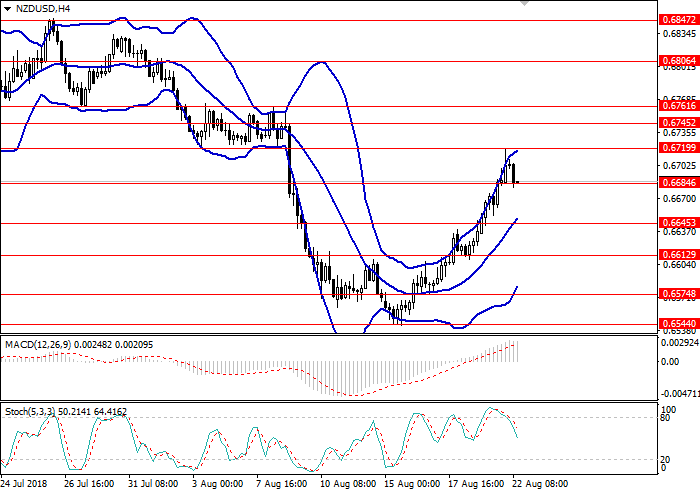
NZD remains in the downward trend against USD. In mid-August, the pair won back a part of losses, having gained more than 150 points and reaching a key resistance level of 0.6710.
The main catalyst for growth was favorable data on retail sales, major indices, and the trade balance of New Zealand. At the same time, the United States published weak releases on orders for durable goods and on Services PMI. Now the pair stopped at the upper border of the descending channel and moved into lateral consolidation.
On Wednesday and Thursday data on the growth rate of the US economy for Q2 2018 and on the labor market will be published.
Support and resistance
In the medium term, the pair is unlikely to change direction and move to an uptrend. Most likely, the current trend will continue: the instrument will go down again with the possibility of testing new local minima. In the medium term, the pair may fall to the low of the beginning of 2016 at the level of 0.6350. An alternative scenario is a transition to the lateral consolidation.
Technical indicators on D1 chart confirm decline forecast: MACD indicates the preservation of the high volume of short positions, and Bollinger Bands are pointing downwards.
Support levels: 0.6650, 0.6610, 0.6575, 0.6545, 0.6510, 0.6490.
Resistance levels: 0.6710, 0.6725, 0.6770, 0.6790, 0.6830, 0.6850, 0.6895.
Current trend
NZD remains in the downward trend against USD. In mid-August, the pair won back a part of losses, having gained more than 150 points and reaching a key resistance level of 0.6710.
The main catalyst for growth was favorable data on retail sales, major indices, and the trade balance of New Zealand. At the same time, the United States published weak releases on orders for durable goods and on Services PMI. Now the pair stopped at the upper border of the descending channel and moved into lateral consolidation.
On Wednesday and Thursday data on the growth rate of the US economy for Q2 2018 and on the labor market will be published.
Support and resistance
In the medium term, the pair is unlikely to change direction and move to an uptrend. Most likely, the current trend will continue: the instrument will go down again with the possibility of testing new local minima. In the medium term, the pair may fall to the low of the beginning of 2016 at the level of 0.6350. An alternative scenario is a transition to the lateral consolidation.
Technical indicators on D1 chart confirm decline forecast: MACD indicates the preservation of the high volume of short positions, and Bollinger Bands are pointing downwards.
Support levels: 0.6650, 0.6610, 0.6575, 0.6545, 0.6510, 0.6490.
Resistance levels: 0.6710, 0.6725, 0.6770, 0.6790, 0.6830, 0.6850, 0.6895.
LiteFinance
AUD/USD: general analysis
Current trend
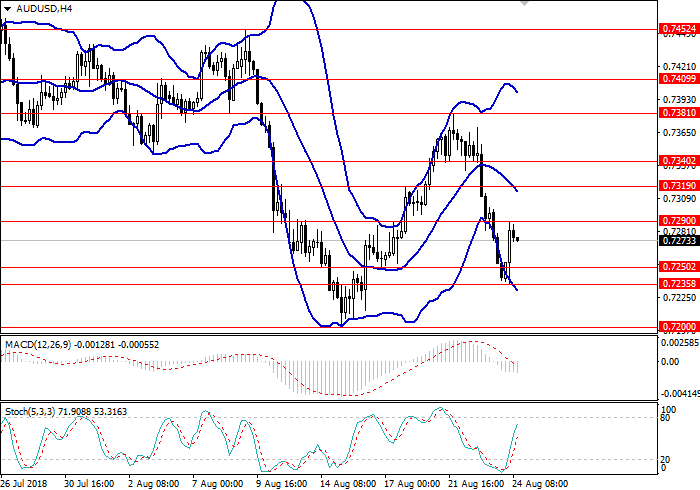
On Thursday, USD strengthened against AUD. Investors are focused on the introduction of additional US-Chinese reciprocal duties by USD 16 billion each. The United States raised tariffs, in particular, on motorcycles produced, railway cars, and steam turbines in China. The PRC responded with duties on American cars, buses, coal, and other goods. The new restrictions came into force amid the negotiations between the countries going in Washington.
AUD is under pressure due to political uncertainty in Australia, where Prime Minister Turnbull has lost the support of his own party.
Today, investors are waiting for Fed's head Jerome Powell speech at the symposium in Jackson Hole. He will make a report on monetary policy in a changing economy. The market also awaits the regulator's comments on the latest critical statements of President Trump.
Support and resistance
On the 4-hour chart, there is a correction of the downward movement, the instrument is traded between the bottom border and the middle line of Bollinger bands. MACD histogram is in the negative area, the signal line is prepared to cross the zero line downwards, after which a signal to open short positions will be received.
Resistance levels: 0.7290, 0.7319, 0.7340, 0.7381, 0.7452.
Support levels: 0.7250, 0.7235, 0.7200.
Trading tips
Short positions can be opened from the current level with the target at 0.7200 and stop loss 0.7319.
Long positions can be opened from the level of 0.7340 with the target at 0.7400 and stop loss 0.7310.
Implementation period: 1–3 days
Current trend
On Thursday, USD strengthened against AUD. Investors are focused on the introduction of additional US-Chinese reciprocal duties by USD 16 billion each. The United States raised tariffs, in particular, on motorcycles produced, railway cars, and steam turbines in China. The PRC responded with duties on American cars, buses, coal, and other goods. The new restrictions came into force amid the negotiations between the countries going in Washington.
AUD is under pressure due to political uncertainty in Australia, where Prime Minister Turnbull has lost the support of his own party.
Today, investors are waiting for Fed's head Jerome Powell speech at the symposium in Jackson Hole. He will make a report on monetary policy in a changing economy. The market also awaits the regulator's comments on the latest critical statements of President Trump.
Support and resistance
On the 4-hour chart, there is a correction of the downward movement, the instrument is traded between the bottom border and the middle line of Bollinger bands. MACD histogram is in the negative area, the signal line is prepared to cross the zero line downwards, after which a signal to open short positions will be received.
Resistance levels: 0.7290, 0.7319, 0.7340, 0.7381, 0.7452.
Support levels: 0.7250, 0.7235, 0.7200.
Trading tips
Short positions can be opened from the current level with the target at 0.7200 and stop loss 0.7319.
Long positions can be opened from the level of 0.7340 with the target at 0.7400 and stop loss 0.7310.
Implementation period: 1–3 days
LiteFinance
USD/JPY: change of tendency
Current trend
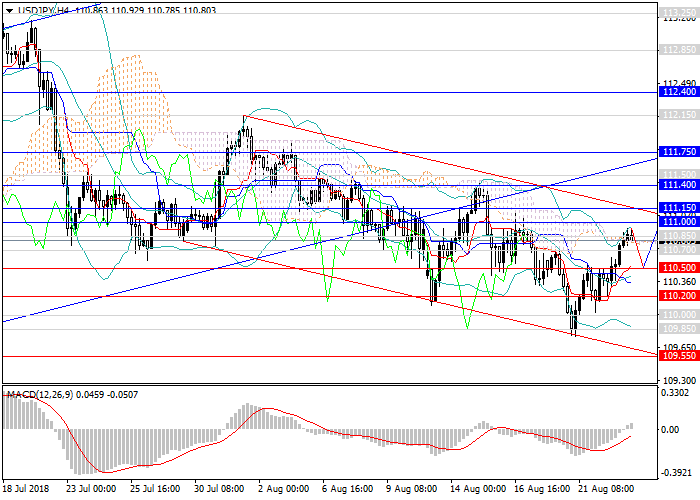
The US dollar again began to dominate against major currencies, including the yen.
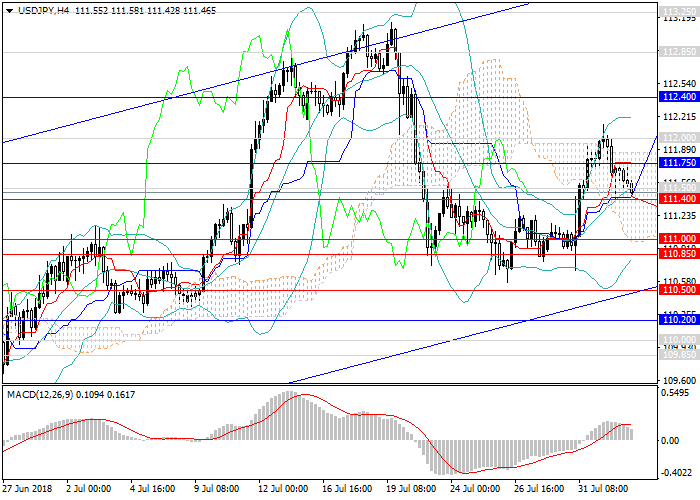
In August, the pair declined within the broad descending channel and lost more than 200 points during that time, reaching a local low of 109.80. Later, the instrument reversed in view of increased demand for USD and the release of weak data from Japan. This week, the pair is growing and has regained more than 100 points.
At the end of the week, a number of key releases for the USA will be published: data on the labor market, the construction market, and orders for durable goods.
Support and resistance
The pair is still in a downward trend, gradually moving to its upper border, the level of 111.15. But this movement can be viewed as a protracted downward correction due to the high potential of the dollar's growth amid the acceleration of the US economic growth and the release of strong data in its main sectors. Therefore, there's a high probability of forming a long ascending wave, taking the upper border of the channel, and returning to an uptrend.
Technical indicators on H4 chart and above confirm the forecast: MACD indicates a rapid decline in the volume of short positions, Bollinger Bands are directed upwards.
Support levels: 110.70, 110.50, 110.20, 110.00, 109.85, 109.55, 109.30.
Resistance levels: 111.00, 111.15, 111.40, 111.50, 111.75, 112.15, 112.40.
Trading tips
In this situation, long positions may be opened from the current level with targets at 111.75, 112.15, 112.40 and stop loss at 110.20.
Current trend
The US dollar again began to dominate against major currencies, including the yen.
In August, the pair declined within the broad descending channel and lost more than 200 points during that time, reaching a local low of 109.80. Later, the instrument reversed in view of increased demand for USD and the release of weak data from Japan. This week, the pair is growing and has regained more than 100 points.
At the end of the week, a number of key releases for the USA will be published: data on the labor market, the construction market, and orders for durable goods.
Support and resistance
The pair is still in a downward trend, gradually moving to its upper border, the level of 111.15. But this movement can be viewed as a protracted downward correction due to the high potential of the dollar's growth amid the acceleration of the US economic growth and the release of strong data in its main sectors. Therefore, there's a high probability of forming a long ascending wave, taking the upper border of the channel, and returning to an uptrend.
Technical indicators on H4 chart and above confirm the forecast: MACD indicates a rapid decline in the volume of short positions, Bollinger Bands are directed upwards.
Support levels: 110.70, 110.50, 110.20, 110.00, 109.85, 109.55, 109.30.
Resistance levels: 111.00, 111.15, 111.40, 111.50, 111.75, 112.15, 112.40.
Trading tips
In this situation, long positions may be opened from the current level with targets at 111.75, 112.15, 112.40 and stop loss at 110.20.
LiteFinance
NZD/USD: general review
Current trend
The New Zealand dollar strengthened yesterday against the US one despite a decline by 3.6% in the index for dairy products, one of the key spheres of the country's economy, which can bear adverse consequences.
On Tuesday, investors were focused on the comments of US President Donald Trump, who again expressed dissatisfaction with the monetary policy of the Fed. Trump also once again accused China of manipulating the national currency, which is not the best start for the beginning of the US-China trade talks. Great results are not expected, but the market keeps hope for the best.
Today, NZD strengthened in view of growth in retail sales by 1.1% in Q2. The index, which is considered an indicator of consumer spending, was above the forecast. Today, investors will focus on the publication of the FOMC minutes (20:00 GMT+2), high volatility is expected on the market.
Support and resistance
On the H4 chart, a correction of upward movement is observed, the pair is traded near the upper border of Bollinger Bands, the price range is widened. MACD histogram is in the positive area; the signal line is crossing the zero mark and the body of the histogram from below giving a signal for opening long positions.
Support levels: 0.6684, 0.6645, 0.6612, 0.6574, 0.6544.
Resistance levels: 0.6719, 0.6745, 0.6761, 0.6806, 0.6847.
Trading tips
Long positions may be opened from the level of 0.6720 with the target at 0.6800 and stop loss at 0.6684.
Short positions may be opened from the level of 0.6640 with the target at 0.6580 and stop loss at 0.6670.
LiteFinance

AUD/USD: the pair rebounded downwards
Current trend
AUD continues to trade in the long-term downward trend against USD.
The pair consolidated in sideways consolidation, showing growth of more than 100 points, then reversed and returned to local lows. Throughout July the instrument left the range of 0.7350-0.7450 only once. The catalyst for this movement was multidirectional data on the main sectors of the US and Australian economies. In addition, the Fed did not raise rates again, which puts pressure on the US currency, not allowing the pair to break through strong support levels.
Today the data on the Unemployment rate, Nonfarm payrolls and PMIs are expected to be published.
Support and resistance
Today, using a strong fundamental background, the pair can break through strong support levels and test a new local low. In case of failure, it will continue to trade in sideways consolidation, which is more likely, judging by the low volatility of the instrument. Technically, the pair remains in the mid-term narrowing sideways channel, reaching its lower limit, after which the probability of forming an upward wave is high. The long-term downtrend is also maintained, which indicates a high probability of getting out of consolidation with a sharp "shot" down.
Indicators on the D1 chart and above confirm the forecast of further decline: MACD shows the preservation of the high volume of short positions, and Bollinger Bands are directed downwards.
Resistance levels: 0.7410, 0.7450, 0.7480, 0.7530, 0.7600.
Support levels: 0.7650, 0.7570, 0.7370, 0.7350, 0.7330, 0.7300.
Trading tips
In this situation short positions may be opened from the current level and from the resistance level of 0.7410 with target at 0.7330 and stop loss at 0.7470.
Australian vs US Dollar
Buy Sell Spread
0.73947 0.73925 22
Scenario
Timeframe Weekly
Recommendations SELL
Entry Point 0.7395
Take Profit 0.7330
Stop Loss 0.7470
Support levels 0.7300, 0.7330, 0.7350, 0.7370, 0.7570, 0.7650, 0.7410, 0.7450, 0.7480, 0.7530, 0.7600
Alternative scenario
Recommendations SELL LIMIT
Entry Point 0.7410
Take Profit 0.7330
Stop Loss 0.7470
Support levels 0.7300, 0.7330, 0.7350, 0.7370, 0.7570, 0.7650, 0.7410, 0.7450, 0.7480, 0.7530, 0.7600
LiteFinance
USD/JPY: the dollar will grow
Current trend
USD against JPY stays within a wide upward trend due to the strength of the American currency. Yesterday, the pair confidently went up before Fed’s interest rate decision, but as the figure remained at the same level, the investment interest in the dollar was reduced and weakened the currency. Today, the downward momentum has increased, and the pair has reached a key support level of 111.40. However, the positions of USD remain strong due to accelerating economic growth, inflation and a reduction in the unemployment rate in the country. Despite a slight decrease in demand, in the medium term, the recovery of the instrument is expected within the current trend.
Today and on Friday, in the US will be published key releases that can change the situation: data on the labor market, including Nonfarm Payrolls, and releases for indexes and production orders.
Support and resistance
The pair can grow from the current level to local highs and test new ones at 113.50, 113.70. However, the correction can reach the levels of 110.85, 111.00, and the instrument will go upward after that.
On the daily chart and above, technical indicators confirm the growth forecast, MACD keeps the high volumes of long positions, and Bollinger bands are directed upwards.
Resistance levels: 111.75, 112.00, 112.40, 112.85, 113.25, 113.70.
Support levels: 111.50, 111.40, 111.00, 110.50, 110.20, 110.00.
Trading tips
It is relevant to increase the volumes of long positions from the current level with the targets at 113.25, 113.50 and stop loss at the level of 111.30.
LiteFinance
USD/CAD: wave analysis
The correction has ended. The pair can grow.
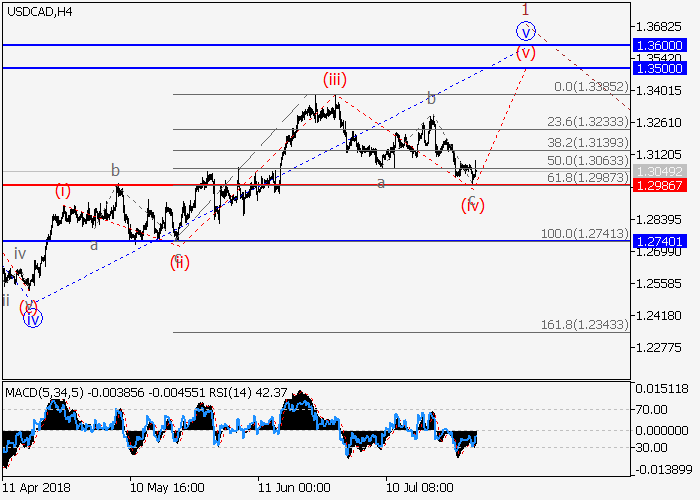
On the 4-hour chart, the fifth wave of the higher level v of 1 is developing. Now the local correction has formed as a fourth wave (iv) of v, and the development of the wave (v) of v begins. If the assumption is correct, the pair may grow to the level of 1.3500. The level of 1.2986 is critical and stop-loss for this scenario.
The correction has ended. The pair can grow.
On the 4-hour chart, the fifth wave of the higher level v of 1 is developing. Now the local correction has formed as a fourth wave (iv) of v, and the development of the wave (v) of v begins. If the assumption is correct, the pair may grow to the level of 1.3500. The level of 1.2986 is critical and stop-loss for this scenario.
LiteFinance

USD/CAD: technical analysis
USD/CAD, D1
On the daily chart, the pair is trading on the middle MA of the Bollinger Bands. The price remains above the EMA65, EMA130 and SMA200 that are directed up. The RSI is falling, having bounced off its longer MA. The Composite is falling as well, having broken down its longer MA.
USD/CAD, H4
On the 4-hour chart, the pair is correcting down from the middle MA of the Bollinger Bands. The price remains just below its moving averages that start turning down. The RSI is falling, having bounced off its longer MA. The Composite is falling as well.
Key levels
Support levels: 1.3065 (local lows), 1.3000 (February 2017 lows), 1.2920 (November 2017 highs).
Resistance levels: 1.3250 (local highs), 1.3380 (June highs), 1.3530 (March 2017 highs).
Trading tips
The price is correcting down towards its previous descending trendline. The correction is likely to continue.
Short positions can be opened from current prices with targets at 1.3065, 1.3000 and stop-loss at 1.3180. Validity – 3-5 days.
Long positions can be opened from the level of 1.3250 with the target at 1.3380 and stop-loss at 1.3200. Validity – 3-5 days.
USD/CAD: технический анализ
USD/CAD, D1
На дневном графике пара торгуется на средней линии Полос Боллинджера. Цена находится выше EMA65, EMA130 и SMA200, направленными вверх. RSI снижается, отскочив от своей долгосрочной MA. Composite также снижается, преодолев свою долгосрочную MA.
USD/CAD, H4
На 4-часовом графике пара корректируется вниз от средней линии Полос Боллинджера. Цена находится прямо под своими скользящими средними, разворачивающимися вниз. RSI снижается, отскочив от своей долгосрочной MA. Composite также движется вниз.
Ключевые уровни
Уровни поддержки: 1.3065 (локальные минимумы), 1.3000 (минимумы февраля 2017 года), 1.2920 (максимумы ноября 2017 года).
Уровни сопротивления: 1.3250 (локальные максимумы), 1.3380 (максимумы июня), 1.3530 (максимумы марта 2017 года).
Торговые сценарии
Цена корректируется вниз к своей предыдущей нисходящей линии тренда. Коррекция, по всей видимости, продолжится.
Короткие позиции можно открывать от текущей цены с целями 1.3065, 1.3000 и стоп-лоссом на отметке 1.3180. Срок реализации — 3-5 дней.
Длинные позиции можно открывать от уровня 1.3250 с целью 1.3380 и стоп-лоссом на отметке 1.3200. Срок реализации — 3-5 дней.
USD/CAD, D1
On the daily chart, the pair is trading on the middle MA of the Bollinger Bands. The price remains above the EMA65, EMA130 and SMA200 that are directed up. The RSI is falling, having bounced off its longer MA. The Composite is falling as well, having broken down its longer MA.
USD/CAD, H4
On the 4-hour chart, the pair is correcting down from the middle MA of the Bollinger Bands. The price remains just below its moving averages that start turning down. The RSI is falling, having bounced off its longer MA. The Composite is falling as well.
Key levels
Support levels: 1.3065 (local lows), 1.3000 (February 2017 lows), 1.2920 (November 2017 highs).
Resistance levels: 1.3250 (local highs), 1.3380 (June highs), 1.3530 (March 2017 highs).
Trading tips
The price is correcting down towards its previous descending trendline. The correction is likely to continue.
Short positions can be opened from current prices with targets at 1.3065, 1.3000 and stop-loss at 1.3180. Validity – 3-5 days.
Long positions can be opened from the level of 1.3250 with the target at 1.3380 and stop-loss at 1.3200. Validity – 3-5 days.
USD/CAD: технический анализ
USD/CAD, D1
На дневном графике пара торгуется на средней линии Полос Боллинджера. Цена находится выше EMA65, EMA130 и SMA200, направленными вверх. RSI снижается, отскочив от своей долгосрочной MA. Composite также снижается, преодолев свою долгосрочную MA.
USD/CAD, H4
На 4-часовом графике пара корректируется вниз от средней линии Полос Боллинджера. Цена находится прямо под своими скользящими средними, разворачивающимися вниз. RSI снижается, отскочив от своей долгосрочной MA. Composite также движется вниз.
Ключевые уровни
Уровни поддержки: 1.3065 (локальные минимумы), 1.3000 (минимумы февраля 2017 года), 1.2920 (максимумы ноября 2017 года).
Уровни сопротивления: 1.3250 (локальные максимумы), 1.3380 (максимумы июня), 1.3530 (максимумы марта 2017 года).
Торговые сценарии
Цена корректируется вниз к своей предыдущей нисходящей линии тренда. Коррекция, по всей видимости, продолжится.
Короткие позиции можно открывать от текущей цены с целями 1.3065, 1.3000 и стоп-лоссом на отметке 1.3180. Срок реализации — 3-5 дней.
Длинные позиции можно открывать от уровня 1.3250 с целью 1.3380 и стоп-лоссом на отметке 1.3200. Срок реализации — 3-5 дней.
LiteFinance

EUR/USD: general analysis
Current trend
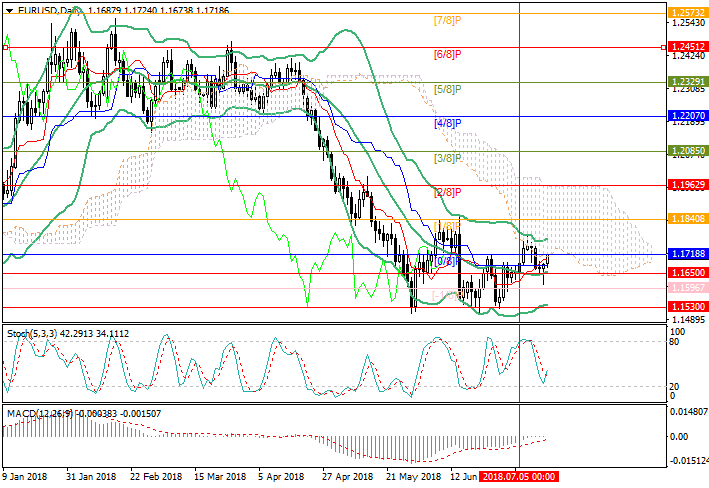
Today, the EUR/USD pair falls again, and the instrument is now trading around 1.1620. USD was supported by Fed Chairman Jerome Powell, who spoke on Wednesday before the Financial Services Committee of the US House of Representatives. According to him, Fed’s balance reaches 4.5 trillion dollars, however, the program of bonds redemption confirmed its effectiveness, and there are no reasons to cut back the purchase so far. The normalizing of the balance can take up to four years. As for the key problems of the American economy, Powell noted the growth rates of the national debt, exceeding GDP growth, which had to be stopped. In general, investors remain confident that the US regulator will raise interest rates this year two more times.
June US construction market data prevents USD strengthening. Building Permits decreased by 2.2%, and Housing Starts – by 12.3%.
Support and resistance
Now the price consolidated below the middle line of Bollinger bands and may continue to fall to the levels of 1.1530 (June lows) and 1.1475 (Murrey [–2/8]). The key "bullish" level is 1.1718 (Murrey [0/8]). Its breakout may lead to an increase to the levels of 1.1840 (Murrey [1/8]) and 1.1962 (Murrey [2/8]). Technical indicators do not give a clear signal. Bollinger bands are moving horizontally. MACD histogram is near the zero line, its volumes are insignificant. Approach Stochastic to the oversold zone suggests the possibility of a price reverse upwards.
Support levels: 1.1530, 1.1475.
Resistance levels: 1.1718, 1.1840, 1.1962.
Trading tips
Short positions can be opened at the level 1.1580 with the targets at 1.1530, 1.1475 and stop loss around 1.1620.
Long positions can be opened above the level 1.1718 with the target at 1.1840 and stop loss 1.1680.
Implementation period: 3–5 days.
EUR/USD: общий обзор
Текущая динамика
Сегодня пара EUR/USD возобновила снижение, и в настоящий момент инструмент торгуется в районе 1.1620. Поддержку американской валюте продолжает оказывать глава ФРС Джером Пауэлл, который выступил в среду перед Комитетом по финансовым услугам Палаты представителей Конгресса США. Сейчас, по его оценкам, баланс ФРС достигает 4,5 трлн долларов, однако сама программа выкупа облигаций показала свою эффективность, и причин резко сокращать покупку пока нет. Процесс нормализации баланса может занять до четырёх лет. Из ключевых проблем американской экономики Пауэлл выделил темпы роста госдолга, превышающий рост ВВП, и отметил необходимость прервать эту тенденцию. В целом, инвесторы сохраняют уверенность в том, что американский регулятор повысит процентные ставки в текущем году ещё два раза.
Несколько сдерживают укрепление доллара слабые июньские данные со строительного рынка США. Количество выданных разрешений на строительство сократилось на 2,2%, а количество новостроек — на 12,3%.
Уровни поддержки и сопротивления
Сейчас цена закрепилась ниже средней линии полос Боллинджера и может продолжить падать к отметкам 1.1530 (июньские минимумы) и 1.1475 (Мюррей [–2/8]). Ключевым для «быков» видится уровень 1.1718 (Мюррей [0/8]). Его пробой вверх может привести к росту цены к уровням 1.1840 (Мюррей [1/8]) и 1.1962 (Мюррей [2/8]). Технические индикаторы не дают чёткого сигнала. Полосы Боллинджера расположены горизонтально. Гистограмма MACD находится у нулевой линии, объёмы её незначительны. Приближение Стохастика к зоне перепроданности говорит о возможности разворота цены вверх.
Уровни поддержки: 1.1530, 1.1475.
Уровни сопротивления: 1.1718, 1.1840, 1.1962.
Торговые сценарии
Короткие позиции можно открывать от уровня 1.1580 с целями 1.1530, 1.1475 и стоп-лоссом в районе 1.1620.
Длинные позиции можно открывать выше уровня 1.1718 целью 1.1840 и стоп-лоссом у отметки 1.1680.
Срок реализации: 3–5 дней.
Current trend
Today, the EUR/USD pair falls again, and the instrument is now trading around 1.1620. USD was supported by Fed Chairman Jerome Powell, who spoke on Wednesday before the Financial Services Committee of the US House of Representatives. According to him, Fed’s balance reaches 4.5 trillion dollars, however, the program of bonds redemption confirmed its effectiveness, and there are no reasons to cut back the purchase so far. The normalizing of the balance can take up to four years. As for the key problems of the American economy, Powell noted the growth rates of the national debt, exceeding GDP growth, which had to be stopped. In general, investors remain confident that the US regulator will raise interest rates this year two more times.
June US construction market data prevents USD strengthening. Building Permits decreased by 2.2%, and Housing Starts – by 12.3%.
Support and resistance
Now the price consolidated below the middle line of Bollinger bands and may continue to fall to the levels of 1.1530 (June lows) and 1.1475 (Murrey [–2/8]). The key "bullish" level is 1.1718 (Murrey [0/8]). Its breakout may lead to an increase to the levels of 1.1840 (Murrey [1/8]) and 1.1962 (Murrey [2/8]). Technical indicators do not give a clear signal. Bollinger bands are moving horizontally. MACD histogram is near the zero line, its volumes are insignificant. Approach Stochastic to the oversold zone suggests the possibility of a price reverse upwards.
Support levels: 1.1530, 1.1475.
Resistance levels: 1.1718, 1.1840, 1.1962.
Trading tips
Short positions can be opened at the level 1.1580 with the targets at 1.1530, 1.1475 and stop loss around 1.1620.
Long positions can be opened above the level 1.1718 with the target at 1.1840 and stop loss 1.1680.
Implementation period: 3–5 days.
EUR/USD: общий обзор
Текущая динамика
Сегодня пара EUR/USD возобновила снижение, и в настоящий момент инструмент торгуется в районе 1.1620. Поддержку американской валюте продолжает оказывать глава ФРС Джером Пауэлл, который выступил в среду перед Комитетом по финансовым услугам Палаты представителей Конгресса США. Сейчас, по его оценкам, баланс ФРС достигает 4,5 трлн долларов, однако сама программа выкупа облигаций показала свою эффективность, и причин резко сокращать покупку пока нет. Процесс нормализации баланса может занять до четырёх лет. Из ключевых проблем американской экономики Пауэлл выделил темпы роста госдолга, превышающий рост ВВП, и отметил необходимость прервать эту тенденцию. В целом, инвесторы сохраняют уверенность в том, что американский регулятор повысит процентные ставки в текущем году ещё два раза.
Несколько сдерживают укрепление доллара слабые июньские данные со строительного рынка США. Количество выданных разрешений на строительство сократилось на 2,2%, а количество новостроек — на 12,3%.
Уровни поддержки и сопротивления
Сейчас цена закрепилась ниже средней линии полос Боллинджера и может продолжить падать к отметкам 1.1530 (июньские минимумы) и 1.1475 (Мюррей [–2/8]). Ключевым для «быков» видится уровень 1.1718 (Мюррей [0/8]). Его пробой вверх может привести к росту цены к уровням 1.1840 (Мюррей [1/8]) и 1.1962 (Мюррей [2/8]). Технические индикаторы не дают чёткого сигнала. Полосы Боллинджера расположены горизонтально. Гистограмма MACD находится у нулевой линии, объёмы её незначительны. Приближение Стохастика к зоне перепроданности говорит о возможности разворота цены вверх.
Уровни поддержки: 1.1530, 1.1475.
Уровни сопротивления: 1.1718, 1.1840, 1.1962.
Торговые сценарии
Короткие позиции можно открывать от уровня 1.1580 с целями 1.1530, 1.1475 и стоп-лоссом в районе 1.1620.
Длинные позиции можно открывать выше уровня 1.1718 целью 1.1840 и стоп-лоссом у отметки 1.1680.
Срок реализации: 3–5 дней.
LiteFinance
Brent Crude Oil: general analysis
Current trend
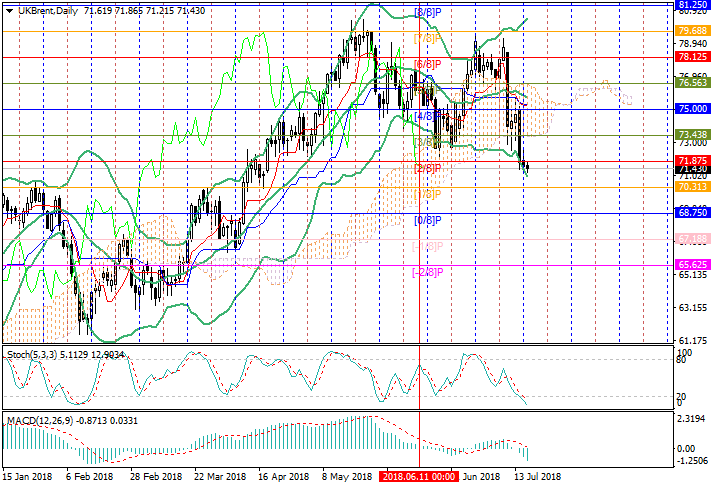
After Monday’s drop, oil prices stabilized. Brent is trading around 72.00–71.50. The decline can resume soon, as the external background remains negative. Investors are concerned about the US-China trade conflict escalation, which can lead to a decrease in the growth of the two leading world economies and undermine the demand for energy. At the same time, the supply deficit due to US anti-Iran sanctions, which could support prices, is balanced by increased production in a number of OPEC countries and their allies. In the first half of July, Russia increased it to 11.22 million barrels per day. By the end of this month, Iraq volumes can grow to 4.7 million barrels per day against the current 4.5 million barrels per day.
Tuesday’s API Weekly Crude Oil Stock release increased unexpectedly: oil by 0.629 million barrels, and gasoline by 0.425 million barrels. In the evening, EIA Weekly Crude Oil Stock will be published, which is expected to reach 3.495 million barrels, but it is unlikely to support the prices significantly.
Support and resistance
The price fell below the level of 71.87 (Murrey [2/8]) and will continue to decline to the levels of 70.31 (Murrey [1/8]) and 68.75 (Murrey [0/8]), which is confirmed by the indicators. Bollinger bands diverge, MACD entered the negative zone. Stochastic entered the oversold zone: correction to 73.43 (Murrey [3/8]) is possible only after the price is set above 71.87.
Resistance levels: 71.87, 73.43, 75.00.
Support levels: 70.31, 68.75.
Trading tips
Short positions can be opened from the current level with the targets at 70.31, 68.75 and stop loss 71.90.
Long positions can be opened from the level of 72.30 with the target at 73.43 and stop loss around 71.90.
Implementation period: 3–5 days.
Brent Crude Oil: общий обзор
Текущая динамика
После значительного падения в понедельник нефтяные цены стабилизировались. В настоящее время Brent торгуется в районе 72.00–71.50. В ближайшее время снижение котировок может возобновиться, поскольку внешний фон остаётся негативным для рынка. Инвесторов беспокоит эскалация торгового конфликта между США и КНР, который может привести к снижению роста двух ведущих мировых экономик и подрыву спроса на энергоноситель. В тоже время дефицит предложения из-за антииранских санкций США, который мог бы поддержать цены, нивелируется увеличением добычи в ряде стран ОПЕК и их союзников. Так, в первой половине июля Россия увеличила нефтедобычу до 11,22 млн баррелей в сутки. Ирак к концу текущего месяца может довести добычу до 4,7 млн баррелей в сутки против нынешних 4,5 млн баррелей в сутки.
Опубликованный во вторник отчёт API по запасам «чёрного золота» в США неожиданно зафиксировал их увеличение. Объёмы нефти выросли на 0,629 млн баррелей, а запасы бензина – на 0,425 млн баррелей. Вечером будет опубликован аналогичный отчёта от EIA. Прогнозируется снижение нефтяных запасов на 3,495 млн баррелей, однако в свете текущих негативных факторов реализация прогноза вряд ли окажет значительную поддержку ценам.
Уровни поддержки и сопротивления
Цена опустилась ниже отметки 71.87 (Мюррей [2/8]) и продолжит снижение к уровням 70.31 (Мюррей [1/8]) и 68.75 (Мюррей [0/8]), что подтверждают индикаторы. Полосы Боллинджера расходятся, MACD перешла в отрицательную зону. Стохастик вошёл в зону перепроданности: коррекция к отметке 73.43 (Мюррей [3/8]) возможна только после закрепления цены выше отметки 71.87.
Уровни сопротивления: 71.87, 73.43, 75.00.
Уровни поддержки: 70.31, 68.75.
Торговые сценарии
Открывать короткие позиции можно от текущего уровня с целями 70.31, 68.75 и стоп-лоссом 71.90.
Открывать длинные позиции можно от уровня 72.30 с целью 73.43 и стоп-лоссом в районе 71.90.
Срок реализации: 3–5 дней.
Current trend
After Monday’s drop, oil prices stabilized. Brent is trading around 72.00–71.50. The decline can resume soon, as the external background remains negative. Investors are concerned about the US-China trade conflict escalation, which can lead to a decrease in the growth of the two leading world economies and undermine the demand for energy. At the same time, the supply deficit due to US anti-Iran sanctions, which could support prices, is balanced by increased production in a number of OPEC countries and their allies. In the first half of July, Russia increased it to 11.22 million barrels per day. By the end of this month, Iraq volumes can grow to 4.7 million barrels per day against the current 4.5 million barrels per day.
Tuesday’s API Weekly Crude Oil Stock release increased unexpectedly: oil by 0.629 million barrels, and gasoline by 0.425 million barrels. In the evening, EIA Weekly Crude Oil Stock will be published, which is expected to reach 3.495 million barrels, but it is unlikely to support the prices significantly.
Support and resistance
The price fell below the level of 71.87 (Murrey [2/8]) and will continue to decline to the levels of 70.31 (Murrey [1/8]) and 68.75 (Murrey [0/8]), which is confirmed by the indicators. Bollinger bands diverge, MACD entered the negative zone. Stochastic entered the oversold zone: correction to 73.43 (Murrey [3/8]) is possible only after the price is set above 71.87.
Resistance levels: 71.87, 73.43, 75.00.
Support levels: 70.31, 68.75.
Trading tips
Short positions can be opened from the current level with the targets at 70.31, 68.75 and stop loss 71.90.
Long positions can be opened from the level of 72.30 with the target at 73.43 and stop loss around 71.90.
Implementation period: 3–5 days.
Brent Crude Oil: общий обзор
Текущая динамика
После значительного падения в понедельник нефтяные цены стабилизировались. В настоящее время Brent торгуется в районе 72.00–71.50. В ближайшее время снижение котировок может возобновиться, поскольку внешний фон остаётся негативным для рынка. Инвесторов беспокоит эскалация торгового конфликта между США и КНР, который может привести к снижению роста двух ведущих мировых экономик и подрыву спроса на энергоноситель. В тоже время дефицит предложения из-за антииранских санкций США, который мог бы поддержать цены, нивелируется увеличением добычи в ряде стран ОПЕК и их союзников. Так, в первой половине июля Россия увеличила нефтедобычу до 11,22 млн баррелей в сутки. Ирак к концу текущего месяца может довести добычу до 4,7 млн баррелей в сутки против нынешних 4,5 млн баррелей в сутки.
Опубликованный во вторник отчёт API по запасам «чёрного золота» в США неожиданно зафиксировал их увеличение. Объёмы нефти выросли на 0,629 млн баррелей, а запасы бензина – на 0,425 млн баррелей. Вечером будет опубликован аналогичный отчёта от EIA. Прогнозируется снижение нефтяных запасов на 3,495 млн баррелей, однако в свете текущих негативных факторов реализация прогноза вряд ли окажет значительную поддержку ценам.
Уровни поддержки и сопротивления
Цена опустилась ниже отметки 71.87 (Мюррей [2/8]) и продолжит снижение к уровням 70.31 (Мюррей [1/8]) и 68.75 (Мюррей [0/8]), что подтверждают индикаторы. Полосы Боллинджера расходятся, MACD перешла в отрицательную зону. Стохастик вошёл в зону перепроданности: коррекция к отметке 73.43 (Мюррей [3/8]) возможна только после закрепления цены выше отметки 71.87.
Уровни сопротивления: 71.87, 73.43, 75.00.
Уровни поддержки: 70.31, 68.75.
Торговые сценарии
Открывать короткие позиции можно от текущего уровня с целями 70.31, 68.75 и стоп-лоссом 71.90.
Открывать длинные позиции можно от уровня 72.30 с целью 73.43 и стоп-лоссом в районе 71.90.
Срок реализации: 3–5 дней.
LiteFinance
EUR/USD: general review
Current trend
Last week, the pair was trading near the level of 1.1718 (Murrey [0/8]), but could not get away from it significantly.
This week, investors are waiting for a number of key events, mainly, for the Fed's head Jerome Powell Congress speeches, which will be held on Tuesday and Wednesday. Probably, they will be about monetary policy in the face of the complications of trade relations between China, the EU, and the USA. On the one hand, the inflation reaching the target level and a stable labor market push the regulator to raise rates. On the other hand, trade wars make the future of the American economy vague. Recently, representatives of the FRB of St. Louis noted that the reciprocal trade duties could lead to job losses and the shutdown of production in several US states. In these circumstances, the Fed may well begin to be cautious in monetary policy.
Support and resistance
Now, the instrument is testing the level of 1.1718 and, after consolidating above it, can continue rising to 1.1840 (Murrey [1/8]). This is confirmed by Stochastic, which is reversing upwards, as well as negative forecasts of the retail sales indicator, which will be published today (it is expected to decrease from 0.8% to 0.5%). The level of 1.1650 (the center line of Bollinger Bands) is seen as key for the "bears". Its breakdown will give a prospect of a return to 1.1530 (the bottom line of Bollinger Bands).
Support levels: 1.1650, 1.1530.
Resistance levels: 1.1718, 1.1840, 1.1962.
Trading tips
Buy positions may be opened from the level of 1.1718 with the target at 1.1840 and stop loss at 1.1680.
Sell positions may be opened below 1.1650 with the target at 1.1530 and stop loss at 1.1690.
Implementation time: 3-5 days.
EUR/USD: общий обзор
Текущая динамика
На прошедшей неделе пара торговалась возле отметки 1.1718 (Мюррей [0/8]), но не смогла существенно от неё оторваться.
На текущей неделе инвесторы ждут ряда ключевых событий, прежде всего – выступлений главы ФРС Джерома Пауэлла перед Конгрессом, которые состоятся во вторник и среду. Вероятно, речь пойдёт о денежно-кредитной политике в условиях осложнения торговых отношений между Китаем, ЕС и США. С одной стороны, выход инфляции на целевой уровень и устойчивая ситуация на рынке труда толкают регулятор к повышению ставок. С другой – торговые войны делают будущее американской экономики неопределённым. Недавно представители ФРБ Сент-Луиса отмечали, что введение взаимных торговых пошлин может привести к сокращению рабочих мест и остановке производств в ряде американских штатов. В этих условиях ФРС вполне может начать проявлять осторожность в ужесточении монетарной политики.
Уровни поддержки и сопротивления
Сейчас инструмент тестирует уровень 1.1718 и, в случае закрепления выше неё, может продолжить рост к отметке 1.1840 (Мюррей [1/8]). Это сценарий подтверждается Стохастиком, который разворачивается вверх, а также негативными прогнозами показателя розничных продаж, который будет опубликован сегодня (ожидается снижение индекса с 0,8% до 0,5%). Ключевым для «медведей» видится уровень 1.1650 (средняя линия полос Боллинджера). Его пробой вниз даст перспективу возвращения цены к отметке 1.1530 (нижняя линия полос Боллинджера).
Уровни поддержки: 1.1650, 1.1530.
Уровни сопротивления: 1.1718, 1.1840, 1.1962.
Торговые сценарии
Покупать можно от уровня 1.1718 с целью 1.1840 и стоп-лоссом у отметки 1.1680.
Продавать стоит ниже уровня 1.1650 с целью 1.1530 и стоп-лоссом в районе 1.1690.
Срок реализации: 3-5 дней.
LiteFinance
GBP/USD: the pair is falling
Current trend
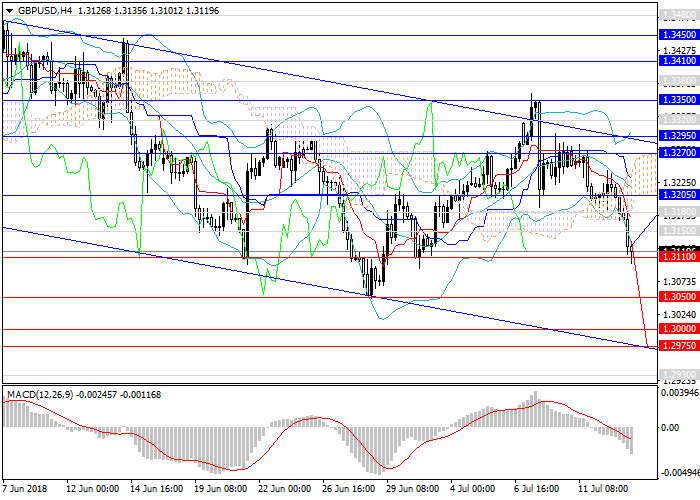
After the growth by more than 300 points in 10 trading days in early June, the pair GBP/USD could not break the key support level of 1.3350, reversed and again began to fall again. Now it is trading at the level of 1.3120. The main catalyst for the movement was positive data from the US, due to which the demand for USD significantly increased. Poor UK Industrial Production and Manufacturing Production data affected the price negatively.
On Friday, the pair continues to decline due to the trading mood. The next trading week, there are a lot of important releases, and the instrument can continue falling and test new local lows.
Today the traders are focused on UK MPC Member Cunliffe Speech and US indices releases.
Support and resistance
The pair is in a downward broad trend and is moving to the levels of 1.2975, 1.2930 in the short term. Technical indicators confirm the forecast, on the 4-hour chart and above, MACD volumes of short positions are high, and Bollinger bands are directed downward.
Resistance levels: 1.3150, 1.3180, 1.3205, 1.3270, 1.3295, 1.3320, 1.3350.
Support levels: 1.3110, 1.3050, 1.3000, 1.2975, 1.2930.
Trading tips
It is relevant to increase the volume of short positions from the current level and open pending orders from the levels of 1.3205, 1.3270 with the targets at 1.2975, 1.2930 and stop loss 1.3310.
GBP/USD: пара снижается
Текущая динамика
После роста в начале июня на более чем 300 пунктов за 10 торговых дней пара GBP/USD не смогла преодолеть ключевой уровень поддержки 1.3350, развернулась и вновь устремилась вниз. Сейчас фунт против доллара торгуется на уровне 1.3120. Основным катализатором движения стали позитивные данные из США, за счёт чего спрос на американскую валюту существенно усилился. Дополнительное давление оказали негативные релизы по промышленному производству и производству в обрабатывающей промышленности Великобритании.
В пятницу пара продолжает снижаться на торговых настроениях. На следующей торговой неделе экономический календарь будет наполнен важными релизами, и инструмент может продолжить падение и протестировать новые локальные минимумы.
Сегодня стоит обратить внимание на выступление члена Комитета по монетарной политике Банка Англии Канлиффа и данные по индексам США.
Уровни поддержки и сопротивления
Технически пара находится в нисходящем широком тренде и движется к уровням 1.2975, 1.2930 в краткосрочной перспективе. Технические индикаторы подтверждают прогноз, MACD указывает на рост объёма коротких позиций на 4-часовом графике и выше, полосы Боллинджера направлены вниз.
Уровни сопротивления: 1.3150, 1.3180, 1.3205, 1.3270, 1.3295, 1.3320, 1.3350.
Уровни поддержки: 1.3110, 1.3050, 1.3000, 1.2975, 1.2930.
Торговые сценарии
Актуально наращивать короткие позиции от текущего уровня и выставлять отложенные ордера от уровней 1.3205, 1.3270 с целями 1.2975, 1.2930 и стоп-лоссом 1.3310.
Current trend
After the growth by more than 300 points in 10 trading days in early June, the pair GBP/USD could not break the key support level of 1.3350, reversed and again began to fall again. Now it is trading at the level of 1.3120. The main catalyst for the movement was positive data from the US, due to which the demand for USD significantly increased. Poor UK Industrial Production and Manufacturing Production data affected the price negatively.
On Friday, the pair continues to decline due to the trading mood. The next trading week, there are a lot of important releases, and the instrument can continue falling and test new local lows.
Today the traders are focused on UK MPC Member Cunliffe Speech and US indices releases.
Support and resistance
The pair is in a downward broad trend and is moving to the levels of 1.2975, 1.2930 in the short term. Technical indicators confirm the forecast, on the 4-hour chart and above, MACD volumes of short positions are high, and Bollinger bands are directed downward.
Resistance levels: 1.3150, 1.3180, 1.3205, 1.3270, 1.3295, 1.3320, 1.3350.
Support levels: 1.3110, 1.3050, 1.3000, 1.2975, 1.2930.
Trading tips
It is relevant to increase the volume of short positions from the current level and open pending orders from the levels of 1.3205, 1.3270 with the targets at 1.2975, 1.2930 and stop loss 1.3310.
GBP/USD: пара снижается
Текущая динамика
После роста в начале июня на более чем 300 пунктов за 10 торговых дней пара GBP/USD не смогла преодолеть ключевой уровень поддержки 1.3350, развернулась и вновь устремилась вниз. Сейчас фунт против доллара торгуется на уровне 1.3120. Основным катализатором движения стали позитивные данные из США, за счёт чего спрос на американскую валюту существенно усилился. Дополнительное давление оказали негативные релизы по промышленному производству и производству в обрабатывающей промышленности Великобритании.
В пятницу пара продолжает снижаться на торговых настроениях. На следующей торговой неделе экономический календарь будет наполнен важными релизами, и инструмент может продолжить падение и протестировать новые локальные минимумы.
Сегодня стоит обратить внимание на выступление члена Комитета по монетарной политике Банка Англии Канлиффа и данные по индексам США.
Уровни поддержки и сопротивления
Технически пара находится в нисходящем широком тренде и движется к уровням 1.2975, 1.2930 в краткосрочной перспективе. Технические индикаторы подтверждают прогноз, MACD указывает на рост объёма коротких позиций на 4-часовом графике и выше, полосы Боллинджера направлены вниз.
Уровни сопротивления: 1.3150, 1.3180, 1.3205, 1.3270, 1.3295, 1.3320, 1.3350.
Уровни поддержки: 1.3110, 1.3050, 1.3000, 1.2975, 1.2930.
Торговые сценарии
Актуально наращивать короткие позиции от текущего уровня и выставлять отложенные ордера от уровней 1.3205, 1.3270 с целями 1.2975, 1.2930 и стоп-лоссом 1.3310.
LiteFinance
USD/JPY: general analysis
Current trend
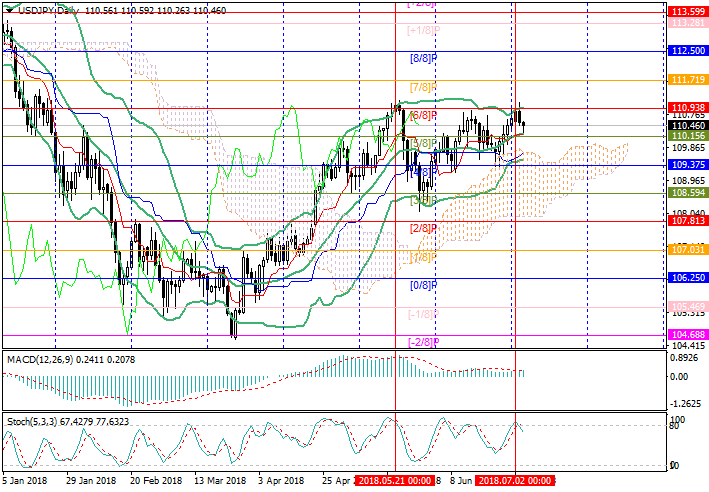
This week the pair was growing, and by now it has reached the level of 112.40. The investors are focused on the US-China trade war. The government of Japan, represented by Cabinet Secretary Yoshihide Suga, has already expressed concern about its escalation. China and the United States are the largest trading partners of the country, and last year the export of Japanese goods in these directions amounted to $300 billion. The decline in the economic growth of the US and China could affect Japanese exporters negatively. According to experts, the consequences of the trade war are likely to come in the next year, and the country's economy may lose 0.6%.
On Thursday, investors are waiting for the publication of June inflation data in the US. It is expected that the Consumer Price Index (YoY) may reach 2.9%, and Consumer Price Index Ex Food & Energy (YoY) will reach 2.3%. Thus, the basic indicator of inflation may remain above the target level (2.0%) for the fourth consecutive month. However, despite good economic results, FOMC members can reduce the number of rate increases this year, primarily due to the deepening trade US-China crisis.
Support and resistance
The price is now reaching the level of 112.50 (the upper border of the Murrey range [8/8]), where a reversal and correction to the levels 111.72 (Murrey [7/8]) and 110.93 (Murrey [6/8]) are possible. The price breaking the upper line of Bollinger bands and Stochastic entering the overbought zone confirm the forecast. The further growth is possible only if the price consolidates above the level of 112.50, in this case, the “bullish” targets will be 114.06 (Murrey [+2/8]).
Resistance levels: 112.50, 114.06.
Support levels: 111.72, 110.93, 110.15.
Trading tips
Short positions can be opened at the level of 112.50 with the targets at 111.72, 110.93 and stop loss at the level of 112.80.
Long positions can be opened from the level of 113.00 with the target at 114.06 and stop loss around 112.70.
Implementation period: 3–5 days.
Current trend
This week the pair was growing, and by now it has reached the level of 112.40. The investors are focused on the US-China trade war. The government of Japan, represented by Cabinet Secretary Yoshihide Suga, has already expressed concern about its escalation. China and the United States are the largest trading partners of the country, and last year the export of Japanese goods in these directions amounted to $300 billion. The decline in the economic growth of the US and China could affect Japanese exporters negatively. According to experts, the consequences of the trade war are likely to come in the next year, and the country's economy may lose 0.6%.
On Thursday, investors are waiting for the publication of June inflation data in the US. It is expected that the Consumer Price Index (YoY) may reach 2.9%, and Consumer Price Index Ex Food & Energy (YoY) will reach 2.3%. Thus, the basic indicator of inflation may remain above the target level (2.0%) for the fourth consecutive month. However, despite good economic results, FOMC members can reduce the number of rate increases this year, primarily due to the deepening trade US-China crisis.
Support and resistance
The price is now reaching the level of 112.50 (the upper border of the Murrey range [8/8]), where a reversal and correction to the levels 111.72 (Murrey [7/8]) and 110.93 (Murrey [6/8]) are possible. The price breaking the upper line of Bollinger bands and Stochastic entering the overbought zone confirm the forecast. The further growth is possible only if the price consolidates above the level of 112.50, in this case, the “bullish” targets will be 114.06 (Murrey [+2/8]).
Resistance levels: 112.50, 114.06.
Support levels: 111.72, 110.93, 110.15.
Trading tips
Short positions can be opened at the level of 112.50 with the targets at 111.72, 110.93 and stop loss at the level of 112.80.
Long positions can be opened from the level of 113.00 with the target at 114.06 and stop loss around 112.70.
Implementation period: 3–5 days.
LiteFinance
GBP/USD: general review
Current trend
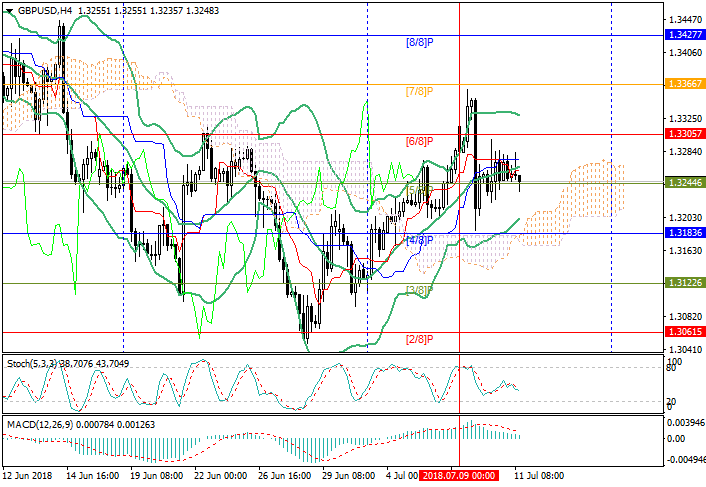
At the beginning of the week, the pair sharply corrected to the area of 1.3183 (Murrey [4/8]), as a result of permutations in the British government.
Brexit Secretary David Davis and Foreign Secretary Boris Johnson left office. They protested against the new plan by Theresa May, according to which a free trade area with uniform rules for industrial and agricultural goods, subject to European trade rules, should be established between the EU and Great Britain.
Currently, the pair has ambiguous dynamics. GBP is under pressure by weak statistics on the volume of industrial production. The value of the indicator YoY grew by 0.8% with the forecast of 1.9%, and MoM it dropped by 0.4%.
USD is under pressure after the US administration announced plans to introduce a new 10% duty on Chinese goods totaling USD 200B, which may enter into force on August 30. The Chinese authorities called this step of the US totally unacceptable and threatened with retaliatory measures and proceedings within the WTO.
Support and resistance
The price is testing the level of 1.3244 (Murrey [5/8]), the breakdown of which will give the prospect of price growth to 1.3183 (Murrey [4/8]), 1.3122 (Murrey [3/8]). The key for the "bulls" is the level of 1.3305 (Murrey [6/8]). If it is broken out, the growth to 1.3366 (Murrey [7/8]) and 1.3427 (Murrey [8/8]) is possible.
Technical indicators show the decline development. Stochastic has reversed downwards, and MACD histogram is reducing in the positive zone.
Support levels: 1.3244, 1.3183, 1.3122.
Resistance levels: 1.3305, 1.3366.
Trading tips
Sell positions may be opened below 1.3244 with targets at 1.3183, 1.3122 and stop-loss at 1.3280.
Buy positions can be opened above the level of 1.3305 with target at 1.3366, 1.3427 and stop-loss at 1.3260.
Implementation period: 3-5 days.
GBP/USD: общий обзор
Текущая динамика
В начале недели пара резко скорректировалась в район 1.3183 (Мюррей [4/8]), что стало следствием перестановок в британском правительстве.
Свои посты покинули министр по делам Brexit Дэвид Дэвис и глава МИД Борис Джонсон. Они выразили протест против нового плана Терезы Мэй, согласно которому между ЕС и Великобританией должна быть создана область свободной торговли с едиными правилами для промышленных и сельскохозяйственных товаров, подчинённая европейским торговым нормам. При этом британским банкам будет ограничен доступ к европейскому финансовому рынку, а британские суды должны будут считаться с решениями Европейского суда по торговле.
В настоящее время пара имеет смешанную динамику. Давление на фунт оказывает слабая статистика по объёму промышленного производства. Показатель в годовом исчислении вырос на 0,8%, но существенно не дотянул до прогнозов (1,9%), а в месячном исчислении — снизился на 0,4%.
Доллар США находится под давлением после того, как американская администрация огласила планы ввести новые 10% пошлины на китайские товары общей суммой в 200 миллиардов долларов, которые могут вступить в силу 30 августа. Китайские власти назвали такой шаг США совершенно неприемлемым и пригрозили ответными мерами и разбирательством в рамках ВТО.
Уровни поддержки и сопротивления
Сейчас цена тестирует отметку 1.3244 (Мюррей [5/8]), пробой которой даст перспективу снижения цены к уровню 1.3183 (Мюррей [4/8]) и 1.3122 (Мюррей [3/8]). Ключевым для «быков» видится уровень 1.3305 (Мюррей [6/8]). При его пробое возможно продолжение роста к отметкам 1.3366 (Мюррей [7/8]) и 1.3427 (Мюррей [8/8]).
Технические индикаторы пока говорят о развитии снижения. Стохастик развернулся вниз, а гистограмма MACD уменьшается в положительной зоне.
Уровни поддержки: 1.3244, 1.3183, 1.3122.
Уровни сопротивления: 1.3305, 1.3366.
Торговые сценарии
Продавать можно ниже отметки 1.3244 с целями 1.3183, 1.3122 и стоп-лоссом на уровне 1.3280.
Покупать можно выше отметки 1.3305 с целями 1.3366, 1.3427 и стоп-лоссом на уровне 1.3260.
Срок реализации 3-5 дней.
Current trend
At the beginning of the week, the pair sharply corrected to the area of 1.3183 (Murrey [4/8]), as a result of permutations in the British government.
Brexit Secretary David Davis and Foreign Secretary Boris Johnson left office. They protested against the new plan by Theresa May, according to which a free trade area with uniform rules for industrial and agricultural goods, subject to European trade rules, should be established between the EU and Great Britain.
Currently, the pair has ambiguous dynamics. GBP is under pressure by weak statistics on the volume of industrial production. The value of the indicator YoY grew by 0.8% with the forecast of 1.9%, and MoM it dropped by 0.4%.
USD is under pressure after the US administration announced plans to introduce a new 10% duty on Chinese goods totaling USD 200B, which may enter into force on August 30. The Chinese authorities called this step of the US totally unacceptable and threatened with retaliatory measures and proceedings within the WTO.
Support and resistance
The price is testing the level of 1.3244 (Murrey [5/8]), the breakdown of which will give the prospect of price growth to 1.3183 (Murrey [4/8]), 1.3122 (Murrey [3/8]). The key for the "bulls" is the level of 1.3305 (Murrey [6/8]). If it is broken out, the growth to 1.3366 (Murrey [7/8]) and 1.3427 (Murrey [8/8]) is possible.
Technical indicators show the decline development. Stochastic has reversed downwards, and MACD histogram is reducing in the positive zone.
Support levels: 1.3244, 1.3183, 1.3122.
Resistance levels: 1.3305, 1.3366.
Trading tips
Sell positions may be opened below 1.3244 with targets at 1.3183, 1.3122 and stop-loss at 1.3280.
Buy positions can be opened above the level of 1.3305 with target at 1.3366, 1.3427 and stop-loss at 1.3260.
Implementation period: 3-5 days.
GBP/USD: общий обзор
Текущая динамика
В начале недели пара резко скорректировалась в район 1.3183 (Мюррей [4/8]), что стало следствием перестановок в британском правительстве.
Свои посты покинули министр по делам Brexit Дэвид Дэвис и глава МИД Борис Джонсон. Они выразили протест против нового плана Терезы Мэй, согласно которому между ЕС и Великобританией должна быть создана область свободной торговли с едиными правилами для промышленных и сельскохозяйственных товаров, подчинённая европейским торговым нормам. При этом британским банкам будет ограничен доступ к европейскому финансовому рынку, а британские суды должны будут считаться с решениями Европейского суда по торговле.
В настоящее время пара имеет смешанную динамику. Давление на фунт оказывает слабая статистика по объёму промышленного производства. Показатель в годовом исчислении вырос на 0,8%, но существенно не дотянул до прогнозов (1,9%), а в месячном исчислении — снизился на 0,4%.
Доллар США находится под давлением после того, как американская администрация огласила планы ввести новые 10% пошлины на китайские товары общей суммой в 200 миллиардов долларов, которые могут вступить в силу 30 августа. Китайские власти назвали такой шаг США совершенно неприемлемым и пригрозили ответными мерами и разбирательством в рамках ВТО.
Уровни поддержки и сопротивления
Сейчас цена тестирует отметку 1.3244 (Мюррей [5/8]), пробой которой даст перспективу снижения цены к уровню 1.3183 (Мюррей [4/8]) и 1.3122 (Мюррей [3/8]). Ключевым для «быков» видится уровень 1.3305 (Мюррей [6/8]). При его пробое возможно продолжение роста к отметкам 1.3366 (Мюррей [7/8]) и 1.3427 (Мюррей [8/8]).
Технические индикаторы пока говорят о развитии снижения. Стохастик развернулся вниз, а гистограмма MACD уменьшается в положительной зоне.
Уровни поддержки: 1.3244, 1.3183, 1.3122.
Уровни сопротивления: 1.3305, 1.3366.
Торговые сценарии
Продавать можно ниже отметки 1.3244 с целями 1.3183, 1.3122 и стоп-лоссом на уровне 1.3280.
Покупать можно выше отметки 1.3305 с целями 1.3366, 1.3427 и стоп-лоссом на уровне 1.3260.
Срок реализации 3-5 дней.
LiteFinance

GBP/USD: general review
Current trend
GBP continues strengthening due to positive economic statistics and is testing the level of 1.3244 (Murrey [5/8]).
Wednesday's data on the Services PMI in the UK proved to be strong and strengthened GBP. In June, the indicator reached the 8-month maximum at 55.1 points. According to experts, this could lead to GDP growth by 0.4% in the UK in Q2 2018 and push the Bank of England to increase the interest rate at an August meeting. However, for such a decision, inflation in the country should be above the target level of 2.0%. Currently, this indicator continues to decline and has already reached the level of 2.4%.
The situation with Brexit remains controversial. Theresa May's Cabinet developed a new plan for customs cooperation with the EU. According to it, after leaving the EU, Britain will be able to set its own tariffs on imported goods while transit products going to the EU through the UK territory will have to be taxed by the EU duties.
Support and resistance
The price is testing the level of 1.3244 (Murrey [5/8]), the breakdown of which will give the prospect of growth to 1.3305 (Murrey [6/8]), 1.3366 (Murrey [7/8]). The key level for the "bears" seems to be 1.3183 (Murrey [2/8]), midline of Bollinger Bands). If it is broken down, the price may decline to 1.3122 (Murrey [3/8]) and 1.3061 (Murrey [2/8]). Technical indicators don’t provide a clear signal. Stochastic has reversed downwards, and MACD histogram is reducing in the positive zone.
Support levels: 1.3366, 1.3305.
Resistance levels: 1.3061, 1.3122, 1.3183.
Trading tips
Buy positions may be opened from 1.3260 with targets at 1.3305, 1.3366 and stop-loss at 1.3220. Sell positions may be opened from 1.3183 with targets at 1.3122, 1.3061 and stop-loss at 1.3220.
Implementation time: 3-5 days.
GBP/USD: общий обзор
Текущая динамика
Британский фунт продолжает укрепляться на фоне позитивной экономической статистики и в настоящее время тестирует отметку 1.3244 (Мюррей [5/8]).
Опубликованные в среду данные по индексу деловой активности в сфере услуг Великобритании оказались сильными и укрепили позиции фунта. В июне показатель достиг восьмимесячного максимума на отметке 55,1 пункта. По оценкам экспертов, это может привести к росту ВВП Великобритании во втором квартале текущего года на 0,4% и подтолкнуть Банк Англии к увеличению процентной ставки уже на заседании в августе. Однако для такого решения инфляция в стране должна стабильно находиться выше целевого уровня 2,0%. В настоящее время этот показатель продолжает снижаться и уже достиг отметки 2,4%.
Ситуация с Brexit остаётся противоречивой и может серьёзно надавить на британскую валюту. Кабинет Терезы Мэй разработал новый план таможенного взаимодействия с ЕС. Суть его в том, что после выхода из Евросоюза Великобритания сможет устанавливать собственные тарифы на импортируемые товары. При этом транзитная продукция, идущая в ЕС через территорию королевства, должна будет облагаться пошлинами Евросоюза. Однако перспективы реализации этого плана туманны, главный британский переговорщик Дэвид Дэвис уже назвал его неработоспособным.
Уровни поддержки и сопротивления
Сейчас цена тестирует отметку 1.3244 (Мюррей [5/8]), пробой которой даст перспективу роста цены к уровням 1.3305 (Мюррей [6/8]), 1.3366 (Мюррей [7/8]). Ключевой для «медведей» видится отметка 1.3183 (Мюррей [2/8], средняя линия полос Боллинджера). При её пробое вниз вероятно снижение цены к отметкам 1.3122 (Мюррей [3/8]) и 1.3061 (Мюррей [2/8]). Технические индикаторы единого сигнала не дают. Стохастик развернулся вниз, а гистограмма MACD растёт в положительной зоне.
Уровни поддержки: 1.3305, 1.3366.
Уровни сопротивления: 1.3183, 1.3122, 1.3061.
Торговые сценарии
Покупать можно от уровня 1.3260 целями 1.3305, 1.3366 и стоп-лоссом у отметки 1.3220.
Продавать стоит ниже отметки 1.3183 с целями 1.3122, 1.3061 и стоп-лоссом на уровне 1.3220.
Срок реализации: 3-5 дней.
LiteFinance
USD/JPY: general review
Current trend
This week, the pair is corrected downwards due to weak economic statistics from Japan.
Tankan Large Manufacturing Index in Q2 2018 dropped from 24 to 21 points and Manufacturing PMI in June dropped from 53.1 to 53.0 points.
Also, JPY is under pressure of the decision of the People's Bank of China not to use the yuan as a weapon in the trade war with the US. This was announced by the head of the Chinese regulator Yi Gang. In general, the potential to strengthen JPY as a safe haven asset remains, especially if the US-China trade conflict continues to worsen.
In addition, on Wednesday, the Japanese Bank of Japan board member Yutaka Harada addressed the leaders of Japanese business. The official noted that the current level of unemployment in the country (2.2%) is too high and to achieve inflation level of 2.0% it is necessary to further reduce it. Therefore, the Bank of Japan intends to continue soft monetary policy.
Support and resistance
The price has fallen to the midline of Bollinger Bands to 110.15. The breakdown of this level will give the prospect of further decline to 109.37 (Murrey [4/8], the bottom line of Bollinger Bands) and 108.59 (Murrey [5/8]). This possibility is indicated by Stochastic which has left the overbought area. The key to the "bulls" is 110.93 (Murrey [6/8]), which was tested unsuccessfully in May. Consolidation of the price above it will cause an increase to 111.72 (Murrey [7/8]) and 112.50 (Murrey [8/8]).
Support levels: 110.15, 109.37, 108.59.
Resistance levels: 110.93, 111.72, 112.50.
Trading tips
Buy positions can be opened above 110.93 with targets at 111.72, 112.50 and stop-loss at 110.50.
Sell positions may be opened below 110.15 with targets at 109.37, 108.59 and stop-loss at 110.40.
Implementation period: 3-5 days.
USD/JPY: общий обзор
Текущая динамика
На текущей неделе пара корректируется вниз из-за слабой экономической статистики из Японии.
Индекс деловой активности крупнейших производителей Японии Tankan во втором квартале текущего года снизился с 24 до 21 пункта, а июньский индекс деловой активности в производственном секторе Японии снизился с 53,1 до 53,0 пункта.
Также давление на японскую валюту оказывает решение Народного банка Китая не использовать юань как оружие в торговой войне с США и сохранять его стабильность. Об этом накануне заявил глава китайского регулятора Йи Ганг. В целом, потенциал укрепления иены как актива-убежища по-прежнему сохраняется, особенно в случае продолжения обострения американо-китайского торгового конфликта.
Отметим также, что в среду перед лидерами японского бизнеса выступил член правления Банка Японии Ютака Харада. Чиновник отметил, что нынешний уровень безработицы в стране (2,2%) слишком высок и для достижения инфляцией уровня 2,0% необходимо его дальнейшее снижение. Поэтому Банк Японии намерен в ближайшее время продолжать мягкую денежно-кредитную политику.
Уровни поддержки и сопротивления
В настоящее время цена опустилась к средней линии полос Боллинджера в район 110.15. Пробой этой отметки вниз даст перспективу дальнейшего снижения к уровням 109.37 (Мюррей [4/8], нижняя линия полос Боллинджера) и 108.59 (Мюррей [5/8]). О такой возможности говорит Стохастик, который вышел из зоны перекупленности. Ключевой для «быков» видится отметка 110.93 (Мюррей [6/8]), которую пара безуспешно тестировала в мае. Закрепление цены выше неё вызовет рост к уровням 111.72 (Мюррей [7/8]) и 112.50 (Мюррей [8/8]).
Уровни поддержки: 110.15, 109.37, 108.59.
Уровни сопротивления: 110.93, 111.72, 112.50.
Торговые сценарии
Покупать можно выше отметки 110.93 с целями 111.72, 112.50 и стоп-лоссом у отметки 110.50.
Продавать стоит ниже отметки 110.15 с целями 109.37 и 108.59 и стоп-лоссом в районе 110.40.
Срок реализации 3-5 дней.
LiteFinance
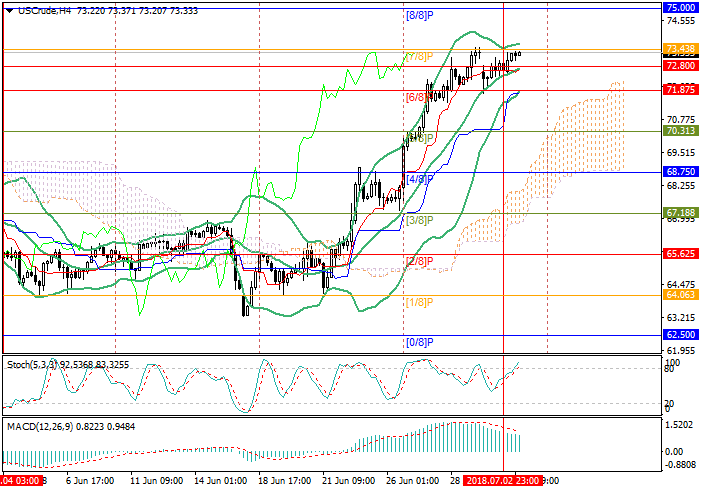
WTI Crude Oil: general analysis
Current trend
On Tuesday, oil prices grew and reached 73.35, but the market is influenced by ambiguous factors.
The risks of Libya oil supply interruptions support the instrument. Yesterday, the representatives of the Libyan National Oil Corp announced that the shipment from a number of ports is unavailable, so the reduction of production in the country by 850,000 barrels per day is expected. On the other hand, the price is under pressure of the United Arab Emirates government's statement that the country has the opportunity to significantly increase production to prevent a supply shortage in the market. Previously, Saudi Arabia said the same thing. Thus, the expected by the end of the year, Iran "black gold" export decrease will be balanced by other OPEC members’ production growth.
In the evening, investors are waiting for API Crude Oil Stocks change release. If the index falls, it will affect the price negatively.
Support and resistance
The key "bullish" level is 73.43 (Murrey [7/8]). After the breakout, the price can grow to 75.00 (Murrey [8/8]). Otherwise, a downward correction to 71.87 (the lower line of Bollinger bands, Murrey [6/8]) and 70.31 (Murrey [5/8]) is expected.
Technical indicators do not exclude the fall possibility. Bollinger bands are directed upwards. Stochastic entered the overbought zone and can reverse. MACD decreases in the positive zone.
Resistance levels: 73.43, 75.00.
Support levels: 71.87, 70.31.
Trading tips
Short positions can be opened at the level 72.80 with the targets at 71.87, 70.31 and stop loss 73.40.
Long positions can be opened when the price is set above the level of 73.43 with the target at 75.00 and stop loss around 72.80.
Implementation period: 3–5 days.
WTI Crude Oil: общий обзор
Текущая динамика
Во вторник цены на нефть росли, достигнув отметки 73.35, но рынок находится под влиянием разнонаправленных факторов.
Поддержку котировкам оказывают риски перебоев с поставками «чёрного золота» из Ливии. Вчера представители ливийской Национальной нефтяной компании заявили о невозможности отгрузки продукции из ряда портов, из-за чего ожидается снижение добычи в стране на 850 тысяч баррелей в сутки. С другой стороны, на котировки давит заявление правительства ОАЭ о том, что страна имеет возможность значительно нарастить добычу, чтобы не допустить дефицита предложения на рынке. Ранее об этом же заявляли представители Саудовской Аравии. Таким образом, ожидаемое к концу года снижение экспорта «чёрного золота» из Ирана будет компенсировано увеличением производства другими членами ОПЕК.
Вечером инвесторы ждут публикации еженедельных данных по запасам нефти в США от API. Продолжение снижения показателя может привести к дополнительному давлению на цены.
Уровни поддержки и сопротивления
Ключевой для «быков» выступает отметка 73.43 (Мюррей [7/8]), при её пробое цена может вырасти к уровню 75.00 (Мюррей [8/8]). В противном случае ожидается нисходящая коррекция к отметкам 71.87 (нижняя линия полос Боллинджера, Мюррей [6/8]) и 70.31 (Мюррей [5/8]).
Технические индикаторы не исключают возможность снижения цен. Полосы Боллинджера направлены вверх. Стохастик вошёл в зону перекупленности, что грозит разворотом, гистограмма MACD уменьшается в положительной зоне.
Уровни сопротивления: 73.43, 75.00.
Уровни поддержки: 71.87, 70.31.
Торговые сценарии
Короткие позиции можно открывать от уровня 72.80 с целями 71.87, 70.31 и стоп-лоссом 73.40.
Длинные позиции можно открывать при закреплении цены выше уровня 73.43 с целью 75.00 и стоп-лоссом в районе 72.80.
Срок реализации: 3–5 дней.
LiteFinance
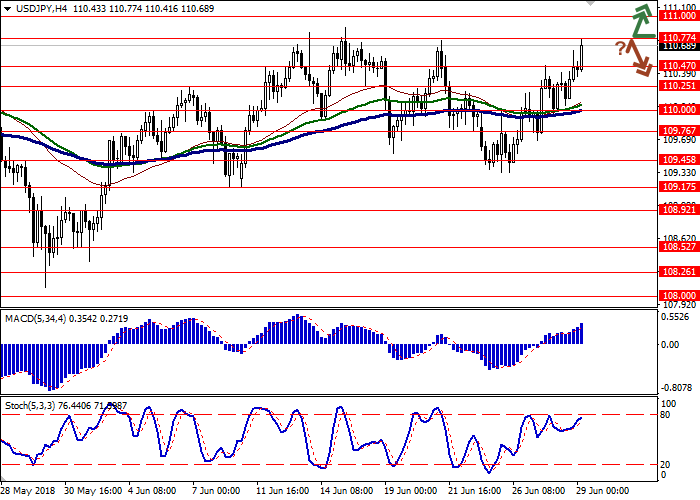
USD/JPY: the dollar is growing
Current trend
USD moderately rose against JPY on Thursday, continuing to develop an uptrend formed earlier this week. The instrument was strengthened due to technical factors, as well as weakened JPY at the backdrop of pessimistic statistics from Japan.
MoM Retail Trade fell to –1.7% in May from 1.4% a month earlier. YoY index fell to 0.6% in May from 1.5% a month earlier.
Today, the pair is also declining, despite the publication of optimistic statistics from Japan. Tokyo CPI ex Fresh Food (YoY) grew by 0.7% in June after the growth to 0.5% a month earlier, with the forecast of +0.6%. At the same time, the unemployment rate fell to a record 2.2% in May against 2.5% earlier. Industrial production (YoY) grew by 4.2% which turned out to be significantly better than previous value of +2.6% and the forecast of +1.1%.
Support and resistance
Bollinger Bands in D1 chart demonstrate flat dynamics. The price range slightly widens from above and limiting the further development of "bullish" trend. MACD indicator is growing keeping a new buy signal (located above the signal line). Stochastic keeps its upward direction, but is approaching its maximum values, which signals an overbought dollar.
Current indicators do not contradict the further development of the "bullish" trend in the short term.
Resistance levels: 110.77, 111.00, 111.38.
Support levels: 110.47, 110.25, 110.00, 109.76.
Trading tips
To open long positions, one can rely on the breakout of 110.77. Take-profit — 111.38 or 111.50. Stop-loss — 110.50. Implementation period: 2 days.
A rebound from the level of 110.77, as from resistance, followed by a breakdown of 110.50 or 110.47, may become a signal for corrective sales with the target at 110.00. Stop-loss — 110.70 or 110.80. Implementation period: 2-3 days.
USD/JPY: доллар показывает рост
Текущая динамика
Американский доллар умеренно вырос против японской иены в четверг, продолжив развитие восходящего тренда, сформированного в начале недели. Укреплению инструмента, помимо технических факторов, способствовало снижение иены на фоне слабой макроэкономической статистики из Японии.
Розничные продажи в месячном выражении снизились до –1,7% в мае с 1,4% месяцем ранее. В годовом выражении значение показателя упало до 0,6% в мае с 1,5% месяцем ранее.
Сегодня пара также снижается, несмотря на публикацию оптимистичной статистики из Японии. Так, индекс потребительских цен Токио без учета цен на свежие продукты питания в июне вырос на 0,7% г/г после роста на 0,5% г/г месяцем ранее, при прогнозе +0,6% г/г. При этом уровень безработицы в мае рухнул до рекордных значений в 2,2% против 2,5% ранее. Объёмы промышленного производства в мае выросли на 4,2% г/г, что также оказалось заметно лучше прошлых данных в +2,6% г/г и прогноза +1,1% г/г.
Уровни поддержки и сопротивления
Полосы Боллинджера на дневном графике демонстрируют флэтовую динамику. Ценовой диапазон незначительно расширяется сверху и пока ограничивает дальнейшее развитие «бычьей» динамики. Индикатор MACD растёт, сформировав новый сигнал на покупку (гистограмма располагается выше сигнальной линии). Стохастик сохраняет восходящую направленность, но приближается к своим максимальным значениям, что сигнализирует о перекупленности доллара.
Текущие показания индикаторов не противоречат дальнейшему развитию «бычьего» тренда в краткосрочной перспективе.
Уровни сопротивления: 110.77, 111.00, 111.38.
Уровни поддержки: 110.47, 110.25, 110.00, 109.76.
Торговые сценарии
Для открытия длинных позиций можно опираться на пробой отметки 110.77 вверх. Тейк-профит — 111.38 или 111.50. Стоп-лосс — 110.50. Срок реализации 2 дня.
Отскок от уровня 110.77, как от сопротивления, с последующим пробоем отметки 110.50 или 110.47 вниз, может стать сигналом к началу коррекционных продаж с целью 110.00. Стоп-лосс — 110.70 или 110.80. Срок реализации 2-3 дня.
LiteFinance
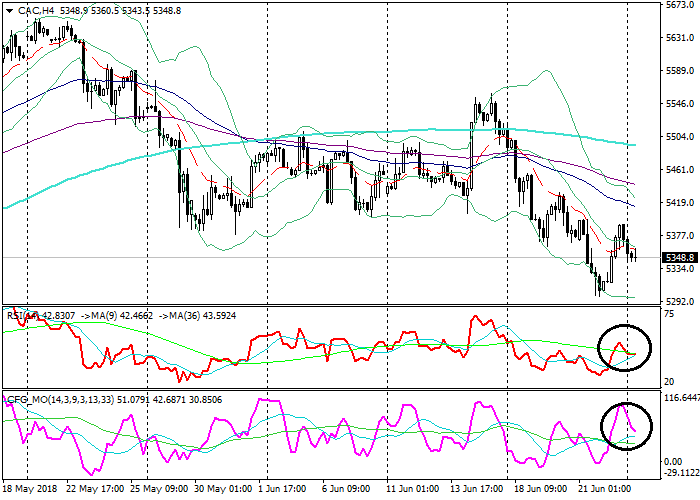
CAC: technical analysis
CAC, D1
On the daily chart, the instrument is trading on the lower line of the Bollinger Bands. The price remains just below its moving averages that start turning down. The RSI is approaching the border of the oversold zone. The Composite is about to test from below its longer MA.
CAC, H4
On the 4-hour chart, the instrument is correcting down from the middle MA of the Bollinger Bands. The price remains below its moving averages that are directed down. The RSI is testing from above its longer MA. The Composite is about to test its longer MA as well.
Key levels
Support levels: 5300.0 (local lows), 5285.0 (local lows), 5265.0 (November 2017 lows).
Resistance levels: 5400.0 (local highs), 5435.0 (local highs), 5500.0 (local highs).
Trading tips
The fall is likely to continue.
Short positions can be opened from current prices with targets at 5300.0, 5285.0, 5265.0 and stop-loss at 5375.0. Validity – 3-5 days.
Long positions can be opened from the level of 5435.0 with the target at 5500.0 and stop-loss at 5400.0. Validity – 3-5 days.
CAC: технический анализ
CAC, D1
На дневном графике инструмент торгуется на нижней линии Полос Боллинджера. Цена находится прямо под своими скользящими средними, разворачивающимися вниз. RSI приближается к границе области перепроданности. Composite готовится снизу протестировать свою долгосрочную MA.
CAC, H4
На 4-часовом графике инструмент корректируется вниз от средней линии Полос Боллинджера. Цена находится ниже своих скользящих средних, направленных вниз. RSI сверху тестирует свою долгосрочную MA. Composite также готовится протестировать свою долгосрочную MA.
Ключевые уровни
Уровни поддержки: 5300.0 (локальные минимумы), 5285.0 (локальные минимумы), 5265.0 (минимумы ноября 2017 года).
Уровни сопротивления: 5400.0 (локальные максимумы), 5435.0 (локальные максимумы), 5500.0 (локальные максимумы).
Торговые сценарии
Снижение, по всей видимости, продолжится.
Короткие позиции можно открывать от текущей цены с целями 5300.0, 5285.0, 5265.0 и стоп-лоссом на отметке 5375.0. Срок реализации — 3-5 дней.
Длинные позиции можно открывать от уровня 5435.0 с целью 5500.0 и стоп-лоссом на отметке 5400.0. Срок реализации — 3-5 дней.
CAC, D1
On the daily chart, the instrument is trading on the lower line of the Bollinger Bands. The price remains just below its moving averages that start turning down. The RSI is approaching the border of the oversold zone. The Composite is about to test from below its longer MA.
CAC, H4
On the 4-hour chart, the instrument is correcting down from the middle MA of the Bollinger Bands. The price remains below its moving averages that are directed down. The RSI is testing from above its longer MA. The Composite is about to test its longer MA as well.
Key levels
Support levels: 5300.0 (local lows), 5285.0 (local lows), 5265.0 (November 2017 lows).
Resistance levels: 5400.0 (local highs), 5435.0 (local highs), 5500.0 (local highs).
Trading tips
The fall is likely to continue.
Short positions can be opened from current prices with targets at 5300.0, 5285.0, 5265.0 and stop-loss at 5375.0. Validity – 3-5 days.
Long positions can be opened from the level of 5435.0 with the target at 5500.0 and stop-loss at 5400.0. Validity – 3-5 days.
CAC: технический анализ
CAC, D1
На дневном графике инструмент торгуется на нижней линии Полос Боллинджера. Цена находится прямо под своими скользящими средними, разворачивающимися вниз. RSI приближается к границе области перепроданности. Composite готовится снизу протестировать свою долгосрочную MA.
CAC, H4
На 4-часовом графике инструмент корректируется вниз от средней линии Полос Боллинджера. Цена находится ниже своих скользящих средних, направленных вниз. RSI сверху тестирует свою долгосрочную MA. Composite также готовится протестировать свою долгосрочную MA.
Ключевые уровни
Уровни поддержки: 5300.0 (локальные минимумы), 5285.0 (локальные минимумы), 5265.0 (минимумы ноября 2017 года).
Уровни сопротивления: 5400.0 (локальные максимумы), 5435.0 (локальные максимумы), 5500.0 (локальные максимумы).
Торговые сценарии
Снижение, по всей видимости, продолжится.
Короткие позиции можно открывать от текущей цены с целями 5300.0, 5285.0, 5265.0 и стоп-лоссом на отметке 5375.0. Срок реализации — 3-5 дней.
Длинные позиции можно открывать от уровня 5435.0 с целью 5500.0 и стоп-лоссом на отметке 5400.0. Срок реализации — 3-5 дней.
: