Aleksey Ivanov / プロファイル
- 情報
|
6+ 年
経験
|
32
製品
|
140
デモバージョン
|
|
0
ジョブ
|
0
シグナル
|
0
購読者
|
----------------------------------------------------------------------
💰 生産された製品:
1) 🏆 市場ノイズの最適なフィルタリングを備えたインジケーター(開始位置と終了位置のポイントを選択するため)。
2) 🏆 統計的指標(世界的な傾向を決定するため)。
3) 🏆 市場調査指標(価格の微細構造を明確にし、チャネルを構築し、トレンドの逆転と引き戻しの違いを特定するため)。
---------------------------------------------------------------------
☛ ブログの詳細 https://www.mql5.com/en/blogs/post/741637
The Velocity of price change indicator shows the average rate of price change at those characteristic time intervals where this rate was approximately constant. The robust algorithm used in Velocity of price change to smooth out the price from its random jumps, ensures the reliability of the indicator reading, which does not react to simple price volatility and its insignificant movements.
✔️The algorithms of this indicator are unique and developed by their author
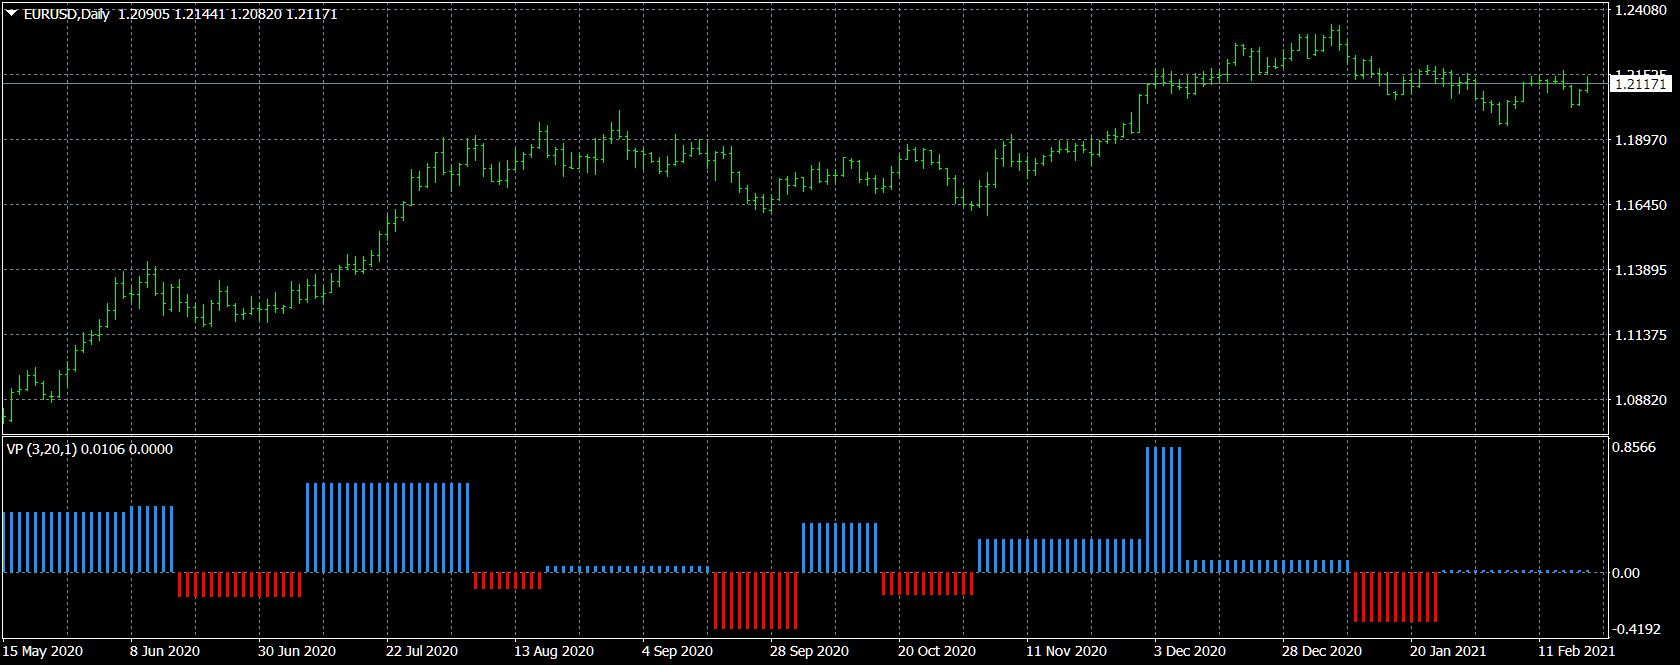
The Velocity of price change ( VP ) indicator shows the average rate of price change at those characteristic time intervals where this rate was approximately constant. The robust algorithm used in VP to smooth out the price from its random jumps, ensures the reliability of the indicator reading, which does not react to simple price volatility and its insignificant movements
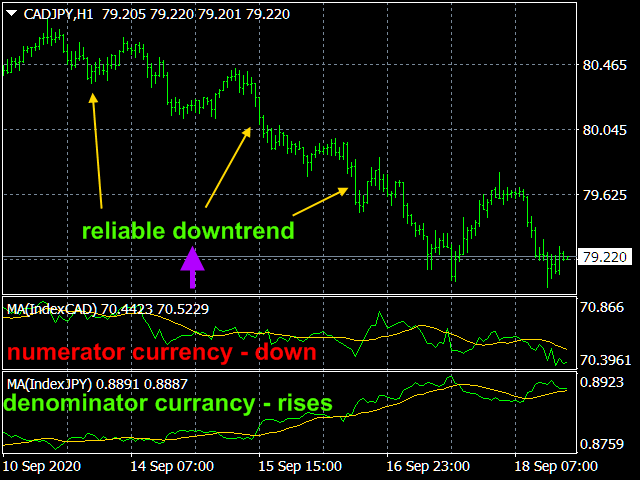
✔️ This indicator is intended for professionals assessing fundamental market trends. This indicator calculates the index of any instrument and analyzes it.
✔️ The indicator has modes for analyzing the indices themselves, namely: Moving Average; Relative Strength Index; Momentum; Commodity Channel Index; Bollinger Bands; Envelopes.
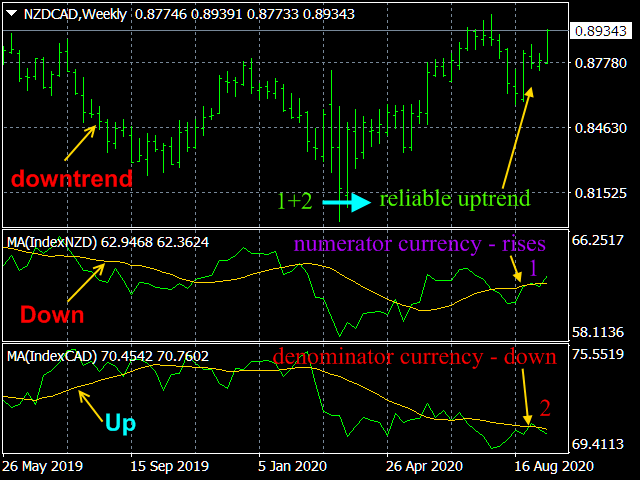
This indicator is intended for professionals assessing fundamental market trends. This indicator calculates the index of any instrument and analyzes it. The index of the state currency shows the real purchasing power of this currency, and the dynamics of this index shows the dynamics of the economic state of the corresponding state
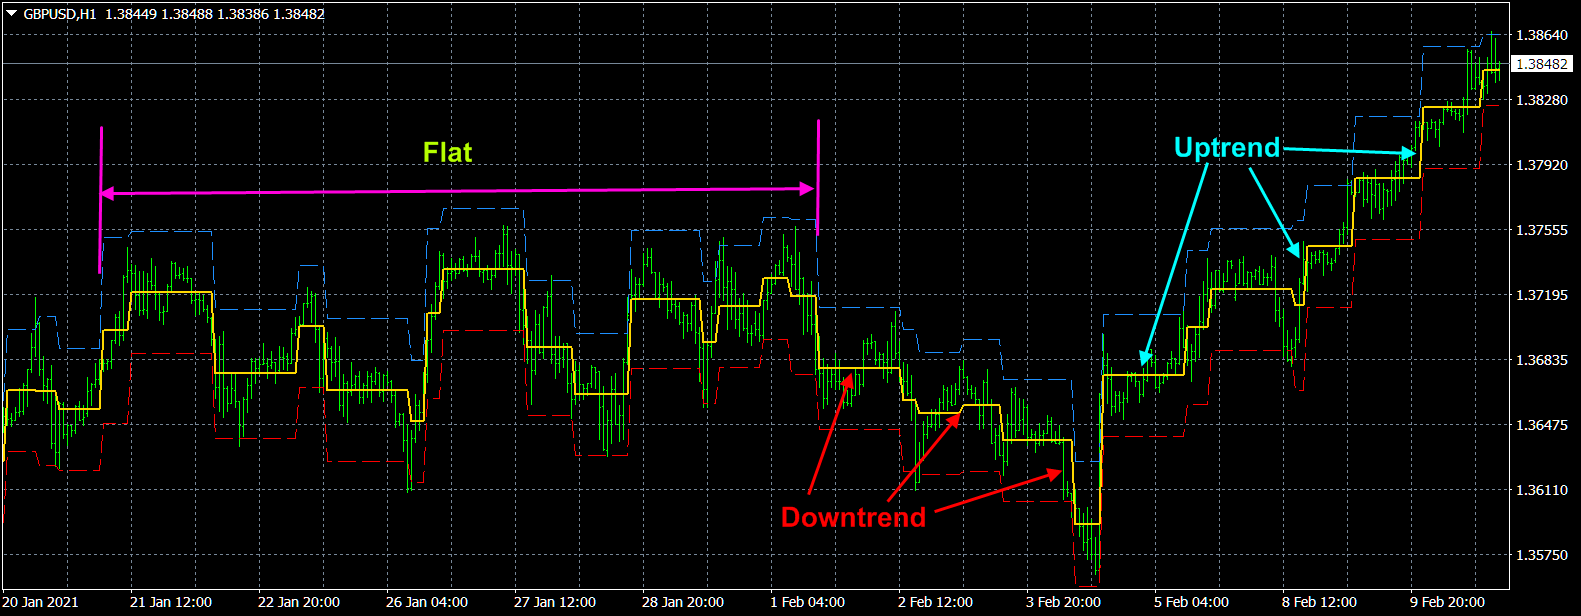
The TrueChannel indicator shows us the true price movement channels. This indicator resembles Donchian Channel in its appearance, but is built on the basis of completely different principles and gives (in comparison with Donchian Channel, which is better just to use to assess volatility) more adequate trading signals.
✔️The algorithms of this indicator are unique and developed by their author
Part 2 https://www.mql5.com/en/articles/11158 and
the author of the well-known Identify Trend indicator https://www.mql5.com/en/market/product/36336 .
✔️The algorithms of most indicators (Modern profitable indicators https://www.mql5.com/en/blogs/post/741637 ) are unique and developed by their author.
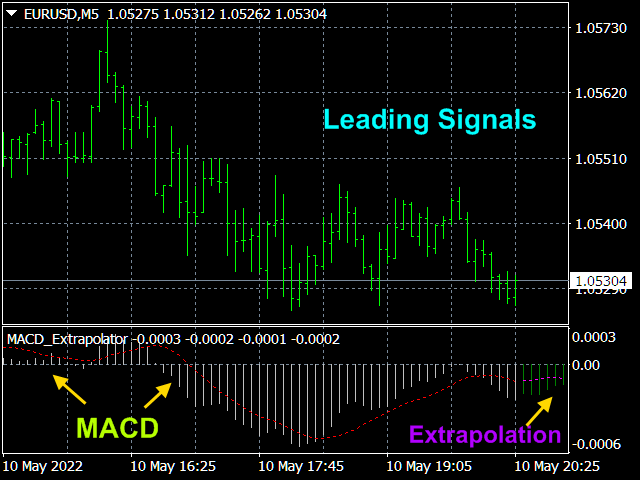
The indicator predicts the future values of the MACD indicator, which allows you to use this indicator much more efficiently.
The market has a very short memory; in any case, the information that formally describes it quickly becomes obsolete and loses its weight in the formation of the current price. Therefore, wavelet analysis is the most promising for predicting future market parameters. The author uses a number of wavelet functions (including the Morlet wavelet and a somewhat modified Gaussian function, which are shown in the last screenshot), the expansion by which, with a sufficient degree of reliability, allows extrapolating future values of oscillator indicators.
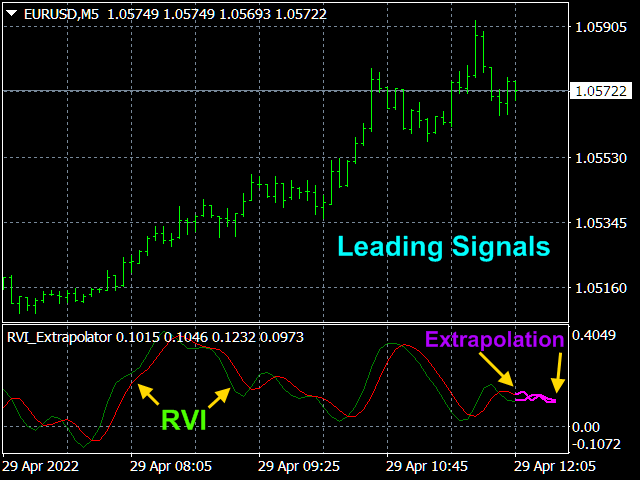
The indicator predicts the future values of the Relative Vigor Index indicator, which allows you to use this indicator much more efficiently.
The market has a very short memory; in any case, the information that formally describes it quickly becomes obsolete and loses its weight in the formation of the current price. Therefore, wavelet analysis is the most promising for predicting future market parameters. The author uses a number of wavelet functions (including the Morlet wavelet and a somewhat modified Gaussian function, which are shown in the last screenshot), the expansion by which, with a sufficient degree of reliability, allows extrapolating future values of oscillator indicators.
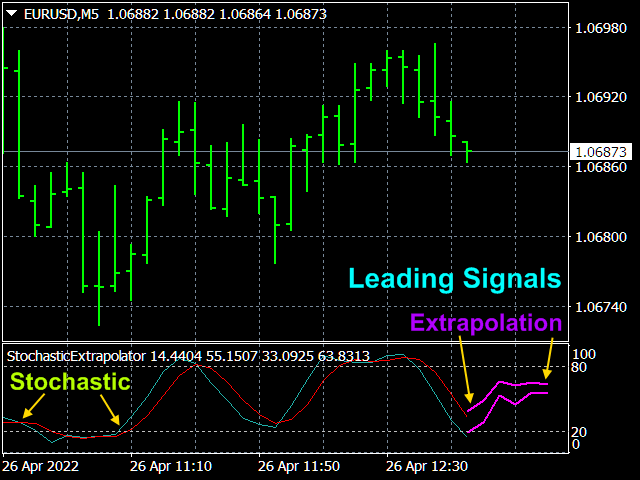
The indicator predicts the future values of the Stochastic indicator, which allows you to use this indicator much more efficiently.
The market has a very short memory; in any case, the information that formally describes it quickly becomes obsolete and loses its weight in the formation of the current price. Therefore, wavelet analysis is the most promising for predicting future market parameters. The author uses a number of wavelet functions (including the Morlet wavelet and a somewhat modified Gaussian function, which are shown in the last screenshot), the expansion by which, with a sufficient degree of reliability, allows extrapolating future values of oscillator indicators.
Signal Bands is a sensitive and convenient indicator, which performs deep statistical processing of information. It allows to see on one chart (1) the price trend, (2) the clear price channel and (3) latent signs of trend change. The indicator can be used on charts of any periods, but it is especially useful for scalping due to its high sensitivity to the current market state.
✔️The indicator has all types of alerts.
✔️The indicator does not redraw.
✔️The algorithms of this indicator are unique and developed by their author

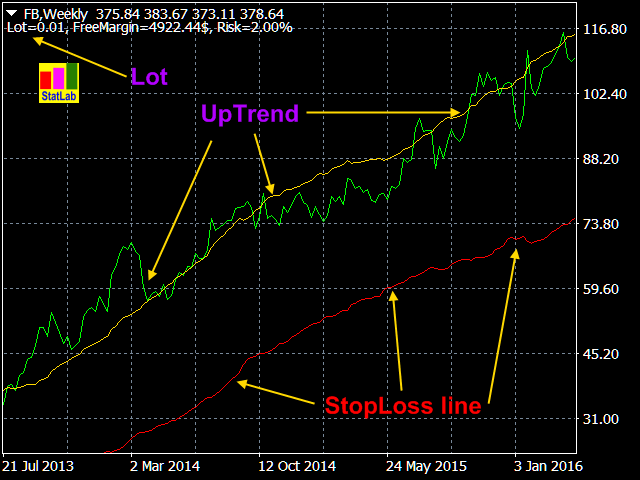
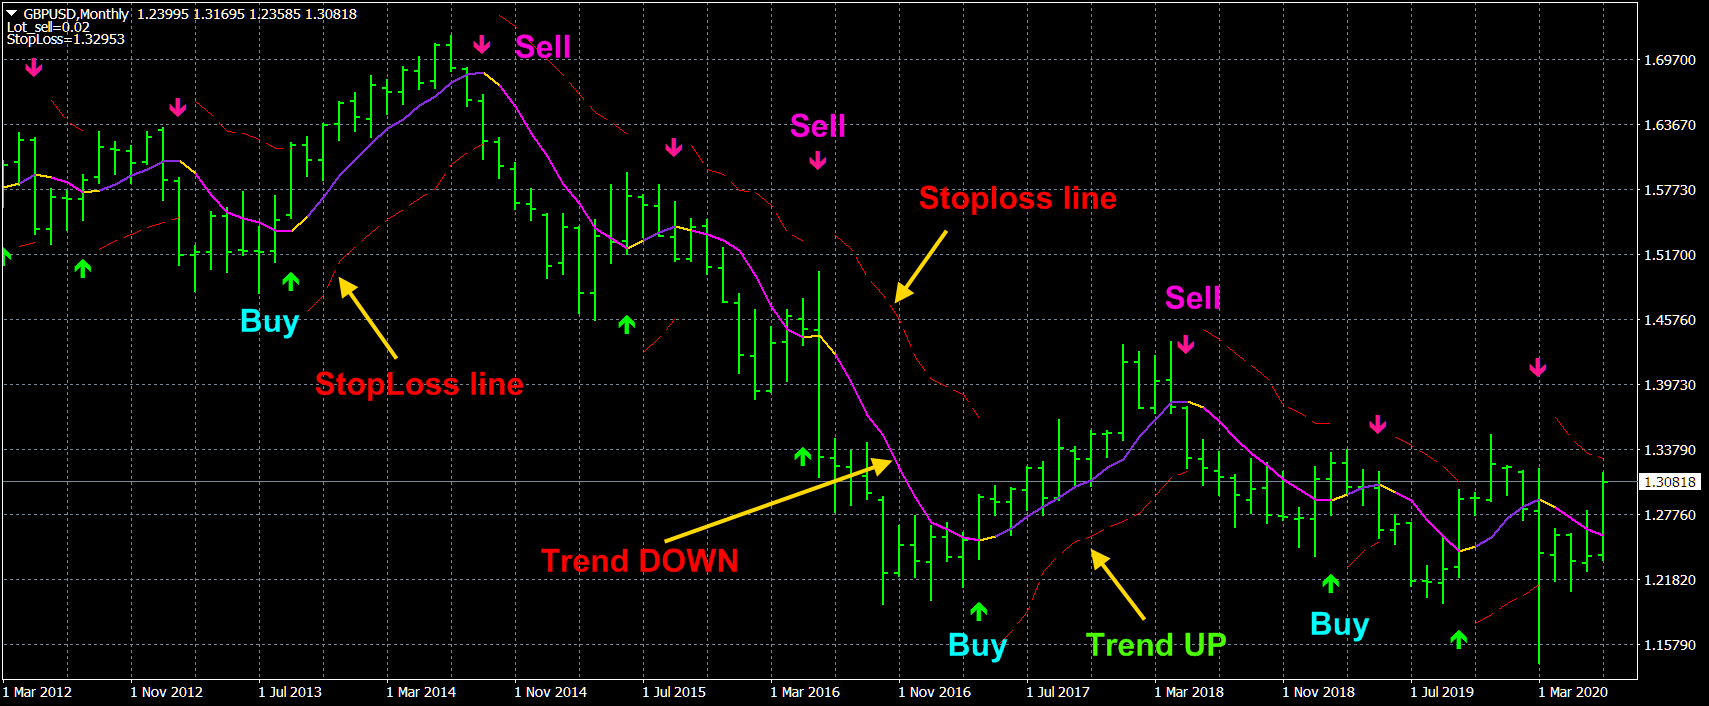
The Robust filter indicator is based on the robust filtering algorithm developed by the author using the multi-period averaged moving median.
The indicator calculates and shows:
✔️1. The direction of the trend;
✔️2. Entry and exit points of positions;
✔️3. StopLoss lines calculated from current price probability distributions and selected probability of closing an order by StopLoss before the trend reversal;
✔️4. Lot sizes based on the accepted risk level, deposit size and StopLoss position.
============================================================
✔️The indicator has all kinds of alerts.
✔️The indicator does not redraw.
✔️The indicator can be used both for trading scalper strategies and for long-term trading strategies.
Indicator is used for:
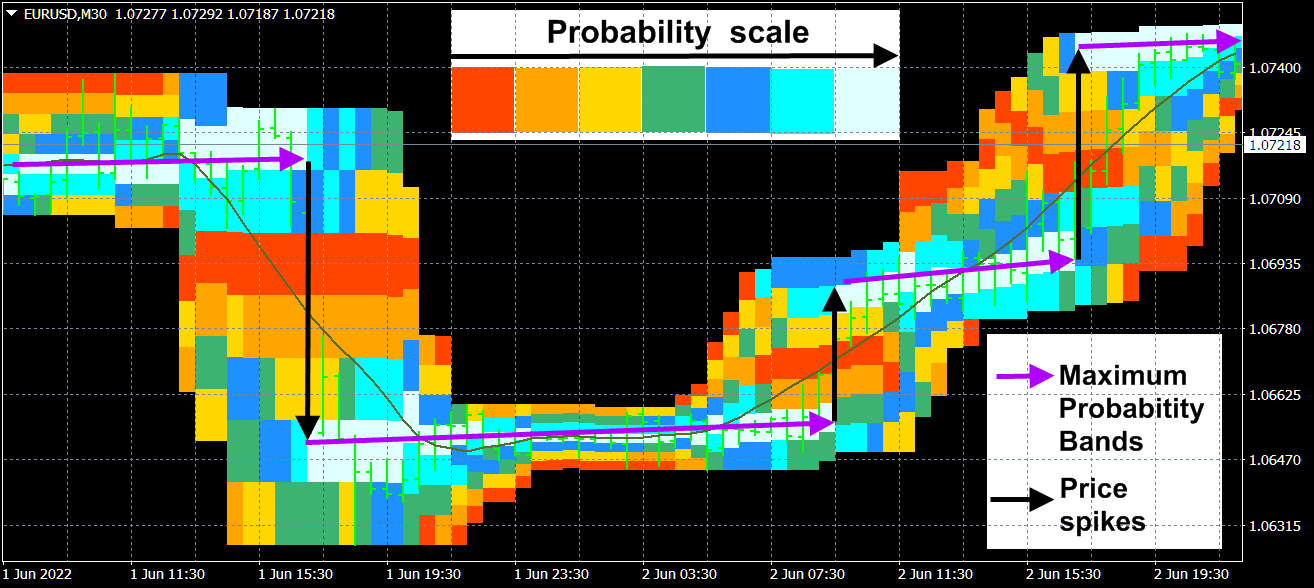
1. defining price probability distributions. This allows for a detailed representation of the channel and its borders and forecast the probability of a price appearing at each segment of its fluctuations;
2. defining the channel change moment.
✔️The algorithms of this indicator are unique and developed by their author
✔️ It has built-in management
The Quality trend indicator expresses the ratio of the strength of a trend or the speed of its growth (fall) to the degree of its noisiness or a certain norm of amplitudes of chaotic fluctuations of a growing (falling) price. The position of the indicator line above zero shows an increasing trend, below zero - a falling trend, the fluctuation of the indicator line near zero shows a flat.
If the indicator line begins to fluctuate rapidly around zero and approach it, then this indicates the imminent beginning of a trend movement. Quite often, an increase in the noise of even a rapidly growing trend or an increase in volatility indicates upcoming changes in the market, in particular, the end of the corresponding trend movement. Consequently, if the readings of an indicator with a high quality factor value suddenly start to decrease, then this indicates the imminent end of the corresponding trend movement. Therefore, the indicator readings are often leading and show the near end of a trend movement with a transition to a flat or even a change in the direction of the trend movement.
✔️The indicator does not lag behind and does not redraw.
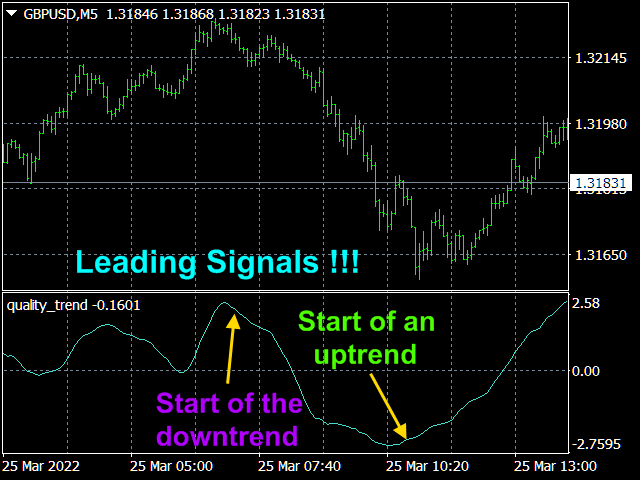
The Quality trend indicator expresses the ratio of the strength of a trend or the speed of its growth (fall) to the degree of its noisiness or a certain norm of amplitudes of chaotic fluctuations of a growing (falling) price. The position of the indicator line above zero shows an increasing trend, below zero - a falling trend, the fluctuation of the indicator line near zero shows a flat. If the indicator line begins
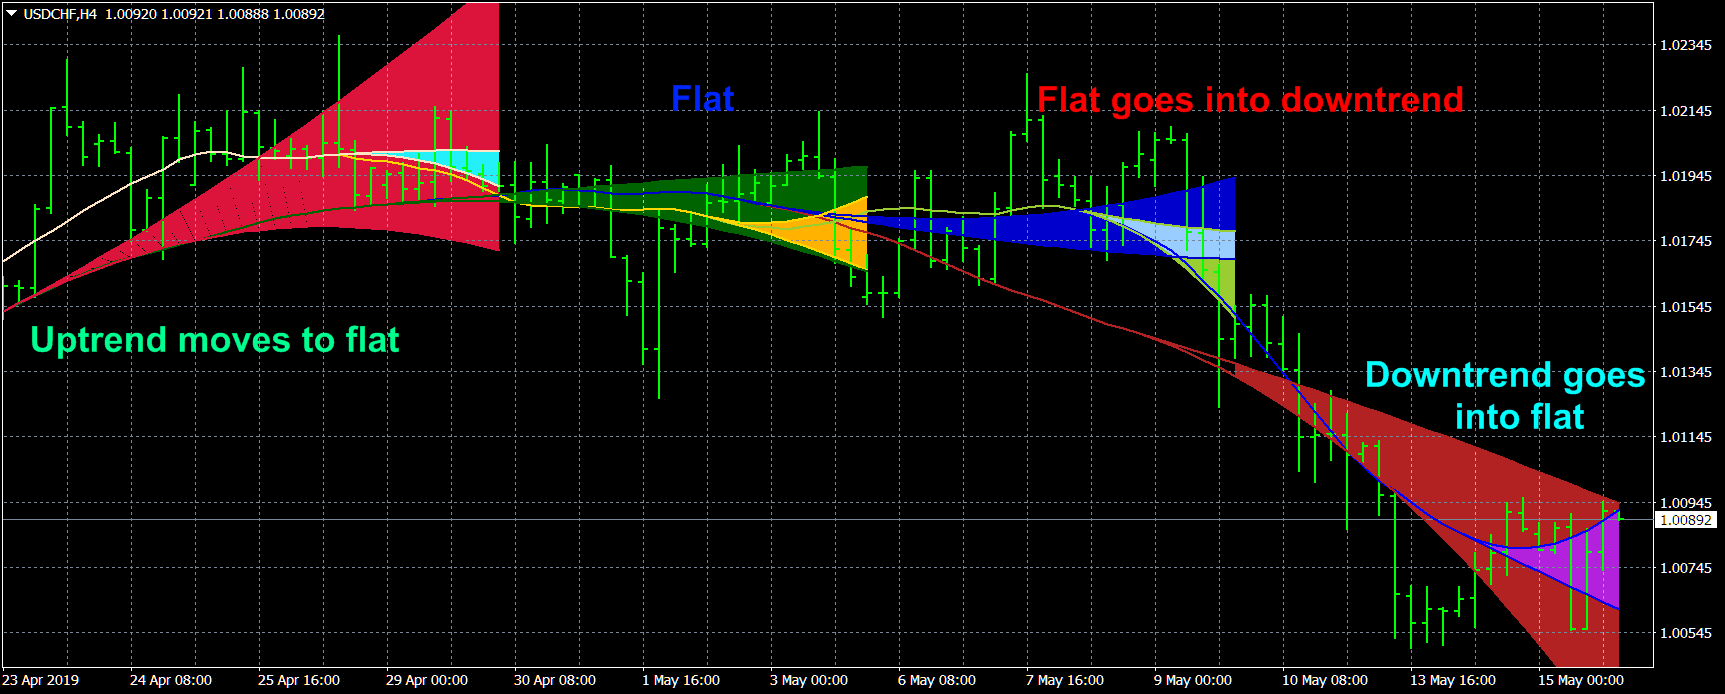
The Strong Trend Flat Signal indicator is the intersection of two, developed by the author, non-lagging moving averages with averaging periods 21 and 63.
✔️The algorithms of this indicator are unique and developed by their author
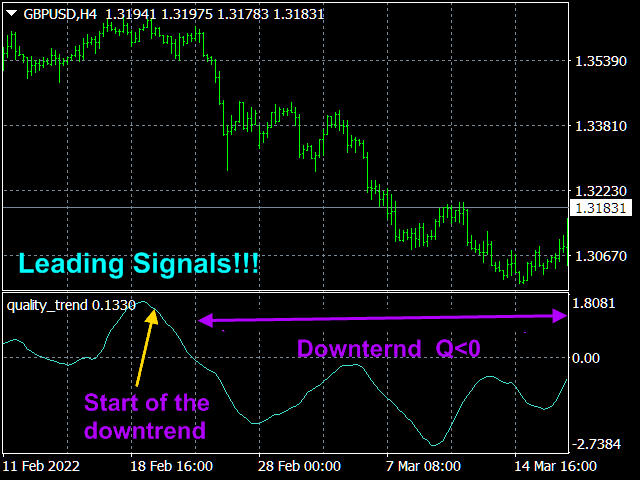
The Quality trend indicator expresses the ratio of the strength of a trend or the speed of its growth (fall) to the degree of its noisiness or a certain norm of amplitudes of chaotic fluctuations of a growing (falling) price. The position of the indicator line above zero shows an increasing trend, below zero - a falling trend, the fluctuation of the indicator line near zero shows a flat.
If the indicator line begins to fluctuate rapidly around zero and approach it, then this indicates the imminent beginning of a trend movement. Quite often, an increase in the noise of even a rapidly growing trend or an increase in volatility indicates upcoming changes in the market, in particular, the end of the corresponding trend movement. Consequently, if the readings of an indicator with a high quality factor value suddenly start to decrease, then this indicates the imminent end of the corresponding trend movement. Therefore, the indicator readings are often leading and show the near end of a trend movement with a transition to a flat or even a change in the direction of the trend movement.
✔️The indicator does not lag behind and does not redraw.
✔️ This indicator is intended for professionals assessing fundamental market trends. This indicator calculates the index of any instrument and analyzes it.
✔️ The indicator has modes for analyzing the indices themselves, namely: Moving Average; Relative Strength Index; Momentum; Commodity Channel Index; Bollinger Bands; Envelopes.
✔️The algorithms of this indicator are unique and developed by their author
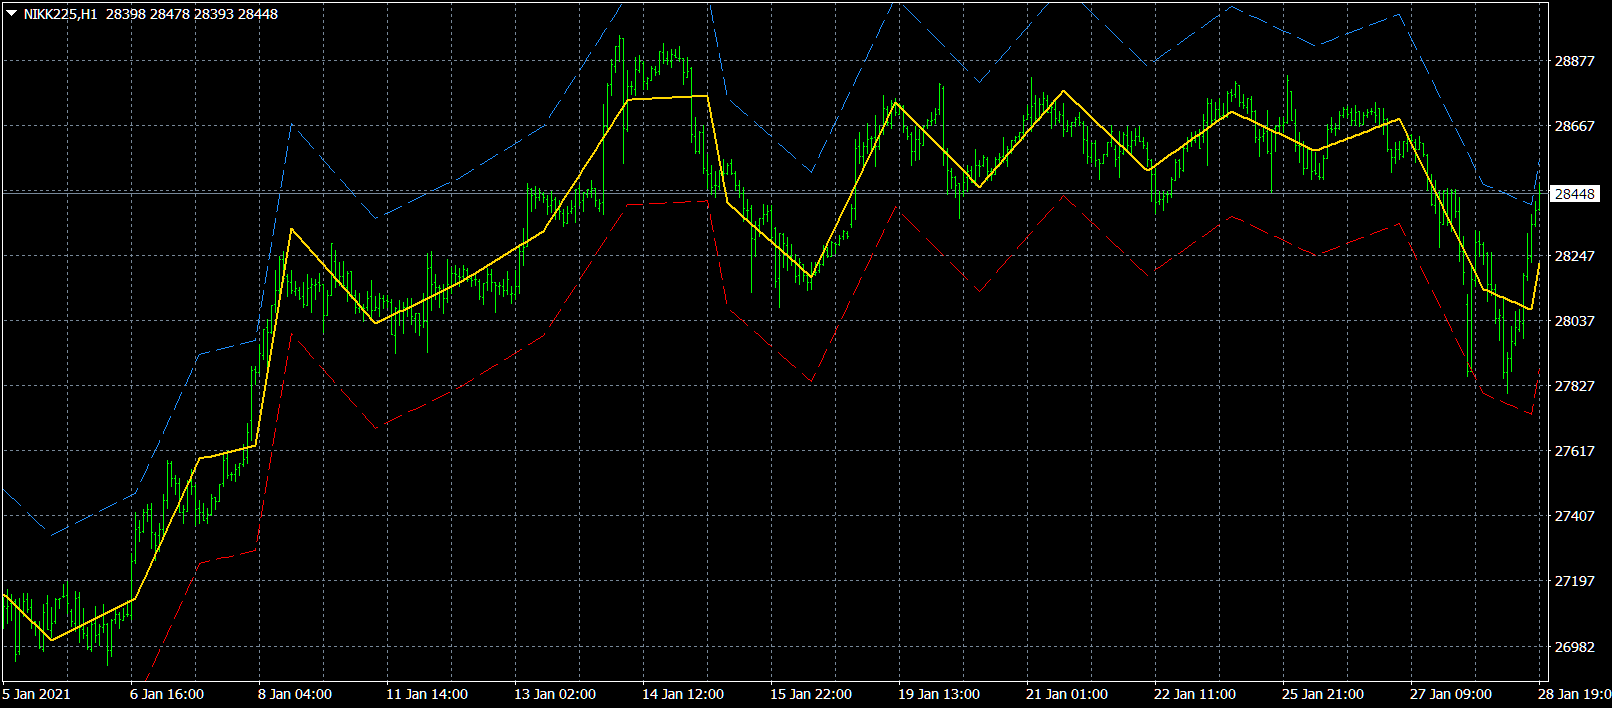
✔️ The StatZigZag indicator also builds a channel of maximum price fluctuations around the broken regression line, on the lower (red) line of which you can set StopLoss for buy orders, and on the upper (blue) line - StopLoss for sell orders.
The trends that you see on the charts are not always trends or, more precisely, trends on which you can make money. The point is that there are two kinds of trends: 1) true trends that are caused by fundamental economic reasons that are stable and, therefore, can provide a reliable profit for the trader; 2) and there are false trend sections that only look like a trend and arise due to chains of random events - moving the price (mainly) in one direction. It is impossible to make money on false trends. («True and illusory currency market trends» https://www.mql5.com/en/blogs/post/740838)
✔️Casual Channel indicator allows you to distinguish a true trend from a false one.
✔️The indicator has a built-in money management function.
✔️The algorithms of this indicator are unique and developed by their author
