• 概要
  • レビュー
  • コメント

ABCD Harmonic Patterns

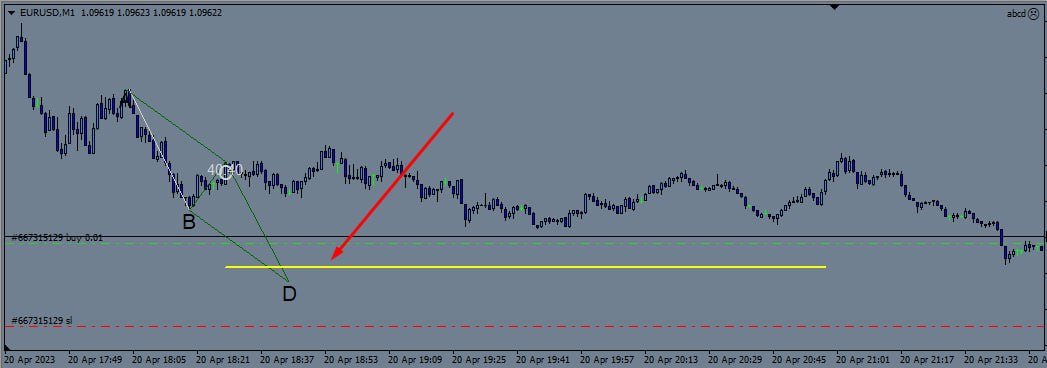
Thanks to this indicator, you can easily see the new ABCD harmonic patterns in the chart.

If the two price action lengths are equal, the system will give you a signal when it reaches the specified level.

You can set the limits as you wish.
For example,
You can get the signal of the price, which occurs in the Fibonaci 38.2 and 88.6 retracements, and then moves for the same length, at the level you specify. For example, it will alarm you when the price reaches 80% as a percentage.

In vertical exits, you can use 23.6 and 45 levels to catch price reversal movements.

In addition, you can turn the Work Abcd part on and off in the settings to see the movements that worked before.
おすすめのプロダクト
Elliott Wave Trend was designed for the scientific wave counting. This tool focuses to get rid of the vagueness of the classic Elliott Wave Counting using the guideline from the template and pattern approach. In doing so, firstly Elliott Wave Trend offers the template for your wave counting. Secondly, it offers Wave Structural Score to assist to identify accurate wave formation. It offers both impulse wave Structural Score and corrective wave Structure Score. Structural Score is the rating to sh
これはほぼ間違いなく、MetaTraderプラットフォームで見つけることができる最も完全な調和価格形成自動認識インジケーターです。 19種類のパターンを検出し、フィボナッチプロジェクションをあなたと同じように真剣に受け止め、潜在的逆転ゾーン(PRZ)を表示し、適切なストップロスとテイクプロフィットレベルを見つけます。 [ インストールガイド | 更新ガイド | トラブルシューティング | よくある質問 | すべての製品 ] 19の異なる調和価格形成を検出します プライマリ、派生および補完フィボナッチ投影(PRZ)をプロットします 過去の価格行動を評価し、過去のすべてのパターンを表示します この指標は、独自の品質とパフォーマンスを分析します 適切なストップロスとテイクプロフィットのレベルを表示します ブレイクアウトを使用して適切な取引を通知します すべてのパターン比をグラフにプロットします 電子メール/音声/視覚アラートを実装します スコット・M・カーニーの本に着想を得て、この指標は最も純粋で急を要するトレーダーのニーズを満たすように設計されています。ただし、トレードを容易にする
Introduction to X3 Chart Pattern Scanner X3 Cherart Pattern Scanner is the non-repainting and non-lagging indicator detecting X3 chart patterns including Harmonic pattern, Elliott Wave pattern, X3 patterns, and Japanese Candlestick patterns. Historical patterns match with signal patterns. Hence, you can readily develop the solid trading strategy in your chart. More importantly, this superb pattern scanner can detect the optimal pattern of its kind. In addition, you can switch on and off individu
This indicator Super Channel Pro indicator.Indicator displays trend movement. Indicator calculates automatically line. Features FiltPer - displays indicator channel period. deviation - displays indicator channel deviation. deviation2 - displays indicator channel deviation. How to understand the status: If the arrow is green, trend is up. If the arrow is red, trend is down. ///////////////////////////////////////////////////////////////////////////////////////////////////////////////////////////
Introduction Harmonic Patterns are best used to predict potential turning point. Traditionally, Harmonic Pattern was identified manually connecting peaks and troughs points in the chart. Manual harmonic pattern detection is painfully tedious and not suitable for everyone. You are often exposed under subjective pattern identification with manual pattern detection. To avoid these limitations, Harmonic Pattern Plus was designed to automate your harmonic pattern detection process. The functionality
Introduction to Harmonic Volatility Indicator Harmonic Volatility Indicator is the first technical analysis applying the Fibonacci analysis to the financial volatility. Harmonic volatility indicator is another level of price action trading tool, which combines robust Fibonacci ratios (0.618, 0.382, etc.) with volatility. Originally, Harmonic Volatility Indicator was developed to overcome the limitation and the weakness of Gann’s Angle, also known as Gann’s Fan. We have demonstrated that Harmonic
A top-quality implementation of the famous  Zig Zag  indicator, which needs no introduction. It is completely coming from original algorithm.  After you have this indicator, you will no need any more indicator for opposite direction of trend. Trading direction of TREND Very easy to understand and set  It implements a multi-timeframe dashboard Buy and Sell signals on same chart  Working M5-M15-M30-H1-H4 and D1  After the purchase, please contact me for to learn how to use it. 
The Penta-O is a 6-point retracement harmonacci pattern which usually precedes big market movements. Penta-O patterns can expand and repaint quite a bit. To make things easier this indicator implements a twist: it waits for a donchian breakout in the right direction before signaling the trade. The end result is an otherwise repainting indicator with a very reliable trading signal. The donchian breakout period is entered as an input. [ Installation Guide | Update Guide | Troubleshooting | FAQ | A
harmonic patterns   Harmonic patterns can be used to spot new trading opportunities and pricing trends – but only if you know exactly what you are looking for. Harmonic patterns are formed by combining geometric shapes and Fibonacci levels. As a result, Fibonacci levels are the key concept of these patterns. Identifying harmonic patterns requires more practice than other market classical patterns. But by learning these patterns, you can recognize the future trend of the price chart. These patter
I just sell my products in Elif Kaya Profile , any other websites are stolen old versions, So no any new updates or support. - Lifetime update free -   Real price is 80$   - 40% Discount ( It is 49$ now ) Contact me for instruction, any questions! Related Product:  Gold Expert  ,  Professor EA - Non-repaint Introduction Flag patterns are an important tool for technical traders in the stock market. When interpreting a flag pattern, it is important to wait for the pattern to pick a direction b
Gartley Projection D
Oleksandr Medviediev
3.71 (7)
このインジケーターは、H.M.Gartley (「株式市場の利益」、1935 年) の開発に従って調和パターン (XABCD) を識別します。 D 点を透視投影の点として投影します (設定で ProjectionD_Mode = true を指定します)。 再描画はしません。 作業時間枠のバーが閉じるとき、特定されたパターン ポイントが Patterns_Fractal_Bars バーの間に移動していない場合、チャート上に (予想される価格変動の方向に) 矢印が表示されます。 この瞬間から、矢印はチャート上に永久に残ります。 連続した 2 ~ 3 つ以上の矢印 - これは市場状況の変化であり、再描画/再描画ではありません (時間枠を前後に切り替えてはなりません)。 注: 2 ~ 3 つ以上の矢印が連続している場合 - これは市況の変化であり、再描画ではありません。 パターンの総数は 85 です (Gartley-222 と Gartley-222WS を含む。完全なリストはコメント セクションにあります)。 識別されたすべてのパターンのうち、最後に識別されたパターンのみがベ
The Sensitive Volume indicator is an indicator designed to generate trading signals. The purpose of this indicator is to generate signals from the highest probability of trading. Using a number of price movements and a set of indicator properties to generate these signals.  Easy to use, simple and understandable to the user. With alert features, user signals can be reached quickly.  Visually the user can easily recognize the signals. This indicator will not repaint. Parameters Trend_Period - pe
The principle of this indicator is very simple: detecting the trend with Moving Average, then monitoring the return point of graph by using the crossing of Stochastic Oscillator and finally predicting BUY and SELL signal with arrows, alerts and notifications. The parameters are fixed and automatically calculated on each time frame. Example: If you install indicator on EURUSD, timeframe M5: the indicator will detect the main trend with the Moving Average on this timeframe (for example the Moving
Introduction to Chart Pattern MT Chart Pattern MT is a chart pattern scanner to detect the triangle pattern, falling wedge pattern, rising wedge pattern, channel pattern and so on. Chart Pattern MT uses highly sophisticated chart pattern detection algorithm. However, we have designed it in the easy to use with intuitive user interface. Chart Pattern MT will show all the patterns in your chart in the most efficient format for your trading. You do not have to do tedious manual pattern detection an
NO REPAINT ADVANCED CHART PATTERN INDICATOR By definition, a price ( chart)  pattern is a recognizable configuration of price movement that is identified using a series of  trendlines  and/or curves. When a price pattern signals a change in trend direction, it is known as a reversal pattern; a continuation pattern occurs when the trend continues in its existing direction following a brief pause. Advanced Chart Pattern Tracker is designed to find the MOST ACCURATE patterns. A special script is a
This indicator works on MT4 and is very easy to use. When you receive a signal from it, you wait for that candle with the signal to close and you enter your trade at the beginning of the next new candle . A red arrow means sell and a green arrow means buy. All arrows comes with Alert  like for easy identification of trade signal. Are you okay with that? 1 minute candle 1 minute expire
Monster Harmonics Indicator is a harmonic pattern indicator. It recognizes Gartley, Bat, Crab, Butterfly, Cypher, White Swan, Black Swan, Shark and several other patterns. Projected patterns that are not yet completed are recognized, too. Monster even shows the PRZ (Potential Reversal Zone). Users can add their own user defined patterns to Monster. Besides the current pattern, Monster also shows all patterns in the symbols history. Monster will provide alerts for developing patterns. Introduced
Contact me for instruction, any questions! Introduction Chart patterns   are an essential tool traders and investors use to analyze the future price movements of securities. One such pattern is the triple bottom or the triple top pattern, which can provide valuable insights into potential price reversals. This pattern forms when a security reaches a low   price level   three times before reversing upward or reaches a high price level three times before reversing downward.   Triple Top Bottom P
Crypto_Forex MT4 用インジケーター「ハンギングマンパターン」 - インジケーター「ハンギングマンパターン」は、プライスアクション取引に非常に強力なインジケーターです。再描画なし、遅延なし。 - インジケーターはチャート上で弱気なハンギングマンパターンを検出します。チャート上の赤い矢印信号 (画像を参照)。 - PC、モバイル、および電子メールアラート付き。 - インジケーター「ハンギングマンパターン」は、サポート/レジスタンスレベルと組み合わせるのに最適です。 // 優れたトレーディングロボットとインジケーターは、こちらで入手できます: https://www.mql5.com/en/users/def1380/seller これは、この MQL5 ウェブサイトでのみ提供されるオリジナル製品です。
Reversal Pattern Pro
Boonyapagorn Rodvattanajinda
Reversal Patterns Pro Reversal Patterns Pro is a Price Action (PA) analytical tool that scans the reversal patterns.  - Finds and marks the most dependable Japanese candlestick patterns in real-time. - Supports all time frames (Best for Scalping) - Doesn't repaint making it an exceptional indicator for Expert Advisors. Input parameters : - Support & Resistance Mode ( true or false ) for enabling advanced filtering - Donchian Period - RSI Period - RSI Oversold Level - RSI Overbought Level - Al
The indicator is the advanced form of the MetaTrader 4 standard Fibonacci tool. It is unique and very reasonable for serious Fibonacci traders. Key Features Drawing of Fibonacci retracement and expansion levels in a few seconds by using hotkeys. Auto adjusting of retracement levels once the market makes new highs/lows. Ability to edit/remove any retracement & expansion levels on chart. Auto snap to exact high and low of bars while plotting on chart. Getting very clear charts even though many ret
EARLY REMINDER: The Starting price is 65 price will rise soon up to 365$ and then 750$ after first 10 copies of sales. Grab this offer now! Introduction Hello, traders! Welcome to the demonstration of the Forex Beast Indicator , a comprehensive tool designed to assist aspiring traders in navigating the complexities of the forex market. This indicator incorporates seven essential components to provide a well-rounded trading experience: Moving Averages Colored Zones Support and Resistance Levels
If you are using volume spread analysis, whether your are a beginner or an expert, this system will give you a lot of features and help in your analysis. Please watch the video to see all the features. Features With one click you will find all the VSA patterns on your chart . Bars without opening price. Easy to read volume indicator. Bar reader (Bar type - Close type - Volume type - Spread type). Daily and weekly levels (Pivot - Camarilla - Fibo). Very light on the trading platform and moving b
This indicator guides you like a hunter. Tacheprofit and StopLoss levels. See the difference in the experiment. Works in all periods. Works at all rates. You can win with this system. The crossing of the mean and the re-test were done according to the rule. You can see the transactions by moving backwards on the strategy test screen. The whole system is automatically calculated.
The   Fibonacci Confluence Toolkit   is a technical analysis tool designed to help traders identify potential price reversal zones by combining key market signals and patterns. It highlights areas of interest where significant price action or reactions are anticipated, automatically applies Fibonacci retracement levels to outline potential pullback zones, and detects engulfing candle patterns. Its unique strength lies in its reliance solely on price patterns, eliminating the need for user-define
POWER TO GET WEALTHY TRADING SYSTEMS.  NON REPAINT REVERSAL ARROW AND CHANNEL  Intra-Day trading and Scalping Strategy:   Designed for fast and accurate day trading and short-term trades. Day and Swing Trading Strategy:   Can be used as a reliable tool for day and swing traders who aim for the big moves of the price. Multi Currencies and Markets:   Works on different instruments and markets with its reliable precision. Multi Timeframes:   Can be used on multiple timeframes with good performanc
First of all, it is worth highlighting here that this Trading Indicator is Non Repainting, Non Redrawing and Non Lagging, which makes it ideal for manual trading. Never repaint and recalculate Once an arrow appears it never disappears, the signal comes at the opening of the new candle You will now be more profitable with this indicator The indicator will alert you when an arrow appears You can do swing trading or scalping trading The indicator helps you identify the trend Can be optimized acros
Fair value gap (FVG) = Imbalance zone Fair value gap Indicator MT4 is the most accurate and customizable indicator on the market. It was developed to facilitate the analysis of operations based on candlestick patterns and supply-demand zones. These zones are possible movement reversal points. For this indicator is generated by the order block of smart money concept. High Time Frame (HTF) To Find High Quality Order Block Low Time Frame (LTF) To Find a secure Entry W1 D1, H4 D1 H4, H1, M30 H4 H1
Pattern Trader No Repaint Indicator MT5 Version of the indicator:  https://www.mql5.com/en/market/product/57462 Advanced Chart Patterns Tracker MT4:  https://www.mql5.com/en/market/product/68550 I ndicator searches for 123 Pattern, 1234 Pattern, Double Top, Double Bottom Patterns , Head and Shoulders, Inverse Head and Shoulders and ZigZag 1.618 Pattern. Pattern Trader indicator uses Zig Zag Indicator and Improved Fractals to determine the patterns. Targets and Stop Loss Levels are defined by
The arrows are calculated with: -     2 Parabolic  parameters -     2 ADX parameters -     4 Stochastic parameters We recommend to combine it with Parabolic, ZigZag or Elliot waves indicator. Always trade the trend! If you make sure to draw your trend lines and support/resistance zones you will just have to wait for the signal to appear. Take the trade. For Binary Options it is advisable to set the expiry time to 5-15 min in M1 chart. THIS INDICATOR IS ZERO REPAINT Best assets to trade: - EUR
このプロダクトを購入した人は以下も購入しています
現在20%OFF! 初心者やエキスパートトレーダーのためのベストソリューション! このダッシュボードソフトウェアは、28の通貨ペアで動作しています。それは私達の主要な指標(高度な通貨の強さ28と高度な通貨インパルス)の2に基づいています。それは全体の外国為替市場の大きい概観を与えます。それは、すべての(9)時間枠で28の外国為替ペアのための高度な通貨の強さの値、通貨の動きの速度と信号を示しています。チャート上で1つのインディケータを使用して市場全体を観察し、トレンドやスキャルピングの機会をピンポイントで見つけることができたら、あなたのトレードがどのように改善されるか想像してみてください。 このインディケータには、強い通貨と弱い通貨の識別、潜在的な取引の識別と確認がより簡単になるような機能が搭載されています。このインディケータは、通貨の強さや弱さが増加しているか減少しているか、また、すべての時間枠でどのように機能しているかをグラフィカルに表示します。 新機能として、現在の市場環境の変化に適応するダイナミックなマーケットフィボナッチレベルが追加され、すでに当社のAdvanced
Gold Stuff
Vasiliy Strukov
4.86 (254)
Gold Stuff は、金専用に設計されたトレンド指標であり、あらゆる金融商品にも使用できます。 インジケーターは再描画せず、遅れません。 推奨時間枠 H1. それインディケータでフルオートExpert Advisor EA Gold Stuffが動作します。 あなたは私のプロフィールでそれを見つけることができます. 設定と個人的なボーナスを得るために、購入後すぐに私に連絡してください! トレンド スキャナーの強力なサポートを利用して、無料のインジケーターを入手し、プライバシーを守ります。あーみー!   設定 矢印を描く - オンオフ。 チャートに矢印を描く。 アラート - 可聴アラートのオンオフ。 メール通知 - オンオフ。 電子メール通知。 プチ通知 - オンオフ。 プッシュ通知。 次に、色域を調整します。 Gold Stuff は、金専用に設計されたトレンド指標であり、あらゆる金融商品にも使用できます。 インジケーターは再描画せず、遅れません。 推奨時間枠 H1. それインディケータでフルオートExpert Advisor EA Gold Stuffが動作します。
Dynamic Forex28 Navigator - 次世代の Forex 取引ツール。 現在 49% オフ。 Dynamic Forex28 Navigator は、長年人気のインジケーターを進化させたもので、3 つの機能を 1 つにまとめています。 Advanced Currency Strength28 インジケーター (レビュー 695 件)  + Advanced Currency IMPULSE with ALERT (レビュー 520 件) + CS28 コンボ シグナル (ボーナス)。 インジケーターの詳細 https://www.mql5.com/en/blogs/post/758844 次世代の Strength インジケーターが提供するもの  オリジナルで気に入っていたすべての機能が、新機能と精度の向上によって強化されました。 主な機能: 独自の通貨強度計算式。 すべての時間枠でスムーズかつ正確な強度ライン。 トレンドの特定と正確なエントリーに最適です。 ダイナミックマーケットフィボナッチレベル (マーケットフィボナッチ)。 このインジケーターに固有
Enigmera
Ivan Stefanov
5 (7)
ENIGMERA: 市場の中心 重要:MQL5.comのデモはStrategy Testerで実行されており、Enigmeraの機能を完全には反映していない場合があります。詳細については、説明、スクリーンショット、ビデオをご確認ください。質問があれば、遠慮なくメッセージを送ってください! インジケーターのコードは完全に書き直されました。バージョン3.0は新機能を追加し、インジケーターの開始以来蓄積されたバグを修正しました。 紹介 このインジケーターとトレーディングシステムは、金融市場への注目すべきアプローチです。ENIGMERAはフラクタルサイクルを使用して、サポートとレジスタンスのレベルを正確に計算します。真の蓄積フェーズを示し、方向と目標を提供します。トレンドでも修正でも機能するシステムです。 動作方法 インジケーターのほとんどの機能は、チャートの左側にあるボタンで制御され、市場の状況に迅速に対応できるようになっています。 ボタン ON/OFF – インジケーター全体を表示または非表示にします。 Channel – サポートチャネルを有効にし、許容範囲の偏差を示します。 Dev
VERSION MT5        —        ИНСТРУКЦИЯ RUS           —        INSTRUCTIONS  ENG 主な機能: レンダリングなしで正確な入力信号! シグナルが表示された場合、それは関連性を維持します。これは、シグナルを提供してからそれを変更する可能性があり、入金時の資金の損失につながる可能性があるリドローインジケーターとの重要な違いです。より高い確率と精度で市場に参入できるようになりました。矢印が表示された後、ターゲットに達する (利益確定) か反転シグナルが表示されるまで、ローソク足を色付けする機能もあります。 STOP LOSS / TAKE PROFITゾーンの表示 エントリーポイントを検索する際の視覚的な明瞭さを改善するために、市場に参入するための最適なポイントが検索される買い/売りゾーンを最初に表示するモジュールが作成されました。ストップロスレベルを操作するための追加のインテリジェントロジックは、時間の経過とともにそのサイズを縮小するのに役立ち、その結果、取引を開始するとき(move sl)の初期リスクを軽減しま
Volatility Trend System - a trading system that gives signals for entries. The volatility system gives linear and point signals in the direction of the trend, as well as signals to exit it, without redrawing and delays. The trend indicator monitors the direction of the medium-term trend, shows the direction and its change. The signal indicator is based on changes in volatility and shows market entries. The indicator is equipped with several types of alerts. Can be applied to various trading ins
このインディケータは、当社の2つの製品 Advanced Currency IMPULSE with ALERT  +   Currency Strength Exotics . のスーパーコンビネーションです。 このインジケーターは全ての時間枠で作動し、8つの主要通貨と1つのシンボルの強弱のインパルスをグラフで表示します。 このインジケータは、金、エキゾチックペア、商品、インデックス、先物など、あらゆるシンボルの通貨強度の加速度を表示することに特化されています。金、銀、原油、DAX、US30、MXN、TRY、CNHなどの通貨強度の加速度(インパルスまたは速度)を表示するために、任意のシンボルを9行目に追加できる、この種の最初のものです。 新しいアルゴリズムに基づいて構築され、潜在的な取引の特定と確認がさらに容易になりました。これは、通貨の強さや弱さが加速しているかどうかをグラフィカルに表示し、その加速の速度を測定するためです。加速すると物事は明らかに速く進みますが、これはFX市場でも同じです。つまり、反対方向に加速している通貨をペアリングすれば、潜在的に利益を生む取引を特定
[ MT5 Version ]  [ Kill Zones ]  [ SMT Divergences ] How to trade using Order Blocks:  Click here User Interface Performance:  During testing in the strategy tester, the UI may experience lag. Rest assured, this issue is specific to the testing environment and does not affect the indicator's performance in live trading. Elevate your trading strategy with the  Order Blocks ICT Multi TF  indicator, a cutting-edge tool designed to enhance your trading decisions through advanced order block analys
Wave Synchronizer は、波動分析の視覚的なインジケーターです。ローソク足の動きのシーケンスを組み合わせて方向性のある波を構築し、市場と同期した動きを生み出します。 各波の始まりはシグナル矢印で始まり、アラートもあります。 インジケーターは、以前の履歴の矢印を再描画したり移動したりすることはありません。 シグナル矢印は、ローソク足の終値に表示されます。 あらゆる取引商品や時間枠で動作するように適応します。 使いやすく設定も簡単で、入力パラメーターは 2 つだけです。選択したパラメーターで使用する時間枠の選択と、MA ラインの計算方法です。 推奨パラメーターは 1 ~ 2 期間シフトできます。 取引資産を購入する場合は矢印の方向が赤になります。 取引資産を売却する場合は矢印の方向が青になります。
シンプルでありながら効果的なポジション取引戦略であるオーダーブロックの個人的な実装。価格範囲がブレイクアウトの反対方向に違反されていない場合、トレーダーは市場に参入するか、最後の注文ブロックの方向で取引を探す必要があります。わかりやすくするために、開いたブロックは描かれていません。 【 インストールガイド】 アップデートガイド | トラブルシューティング | FAQ | すべての製品 ] 強気のオープンブロックは、新鮮な市場の安値の後の最初の強気のバーです 弱気のオープンブロックは、新鮮な市場の高値の後の最初の弱気のバーです 開いているブロックが壊れるとシグナルが表示され、オーダーブロックになります オーダーブロックが反対側に折れると、反転ブロックになります インジケーターはすべての種類のアラートを実装します 塗り直しや裏塗りはしません 入力パラメータ 期間:新鮮な高値または安値を作成するために必要なバーの量。値が小さいほど、信号が多くなります。 最小ATRフィルター:ATRの乗数として表される、オーダーブロックバーの最小ボディサイズ。 最大ATRフィルター:ATRの乗数として表さ
KT Asian Breakout インジケーターは、アジア市場の重要な時間帯を分析し、価格のブレイクアウト方向に基づいた双方向の売買シグナルを生成します。価格がセッション高値を超えると買いシグナルが発生し、セッション安値を下回ると売りシグナルが発生します。 注意事項 セッションボックスが縦に広すぎる場合、新たな取引は避けるべきです。すでにセッション内で価格の動きが完了している可能性が高いためです。 ブレイクアウトのローソク足が大きすぎる場合、価格は一時的に反転した後に、シグナルの方向へ進むことがよくあります。 機能 買い/売りシグナルには、ストップロスと利益目標が含まれています。 KT Asian Breakout インジケーターは、第一、第二、第三の利益目標を成功基準として継続的にパフォーマンスをチェックします。 勝敗シグナル数、成功率、1シグナルあたりの平均ピップスなど、3つの主要なパフォーマンス指標を表示します。 ブレイクアウトのローソク足が大きすぎる場合、チャート上に警告メッセージを表示します。 推奨設定 時間足: 15分。 通貨ペア: すべての JPY ペア。 入力
取引を再定義し、チャート分析のベンチマークとなり、取引の新しい基準を確立したインジケーターです。 反転ゾーン / ピークボリュームゾーン / 大規模プレーヤーのアクティブゾーン   手順 RUS         説明書 ENG   / インジケーターと併用することをお勧めします -   TPSpro TREND PRO このインジケーターを購入したすべての購入者は、さらに以下を無料で受け取ります: RFI SIGNALS サービスからの取引シグナルへの 6 か月間のアクセス - TPSproSYSTEM アルゴリズムに従った既製のエントリ ポイント。 定期的に更新されるトレーニング資料 - 戦略に没頭し、プロフェッショナル レベルを高めます。 平日は 24 時間 365 日サポート、非公開のトレーダー チャットへのアクセス - コミュニケーション、サポート、市場状況の分析。 著者の設定ファイル - 余分な労力をかけずに最大の結果を達成するための自動インジケーター設定。 -   バージョン MT4 主な機能: 売り手と買い手のアクティブなゾーンを表示します。 このインジケ
CONTACT US  after purchase to get the Indicator Manual. Download Now!  Offer valid only for next 10 Buyers.  Price   will   increase  gradually !  Download the  Metatrader 5 Version Read the product description carefully before purchasing the product.  Due to regulatory restrictions, our service is unavailable in certain countries such as India, Pakistan, and Bangladesh. Disclaimer: • Our products are available only on mql5.com. • We never contact anyone or sell our products privately. • We d
Bomb Signal : 100% does not repaint Bonus: when you buy an indicator, you get any indicator for free (optional) . (Write in a private message or in telegram in your profile to receive a bonus) Bomb Signal is a powerful indicator for MetaTrader 4 designed to identify the most relevant trends in the financial market. If you are looking for a tool that accurately predicts movements, Bomb Signal is your ally. How does this work: This indicator combines three different methods – volume analysis, can
NAM Order Blocks
NAM TECH GROUP, CORP.
5 (1)
MT4マルチタイムフレームオーダーブロック検出インジケーター。 特徴 -チャートコントロールパネルで完全にカスタマイズ可能で、完全な相互作用を提供します。 -必要な場所でコントロールパネルを表示および非表示にします。 -複数の時間枠でOBを検出します。 -表示するOBの数量を選択します。 -さまざまなOBユーザーインターフェイス。 -OBのさまざまなフィルター。 -OB近接アラート。 -ADRの高線と低線。 -通知サービス(画面アラート|プッシュ通知)。 概要 注文ブロックは、金融機関や銀行からの注文収集を示す市場行動です。著名な金融機関と中央銀行が外国為替市場を牽引しています。したがって、トレーダーは市場で何をしているのかを知る必要があります。市場が注文ブロックを構築するとき、それは投資決定のほとんどが行われる範囲のように動きます。 注文の構築が完了すると、市場は上向きと下向きの両方に向かって急激に動きます。注文ブロック取引戦略の重要な用語は、機関投資家が行っていることを含むことです。それらは主要な価格ドライバーであるため、機関投資家の取引を含むあらゆる戦
現在20%OFF! 初心者やエキスパートトレーダーに最適なソリューションです。 このインディケータは、エキゾチックペア・コモディティ・インデックス・先物など、あらゆるシンボルの通貨の強さを表示することに特化したインディケータです。金、銀、原油、DAX、US30、MXN、TRY、CNHなどの通貨の強さを表示するために、9行目にどのシンボルでも追加することができます。独自の機能を多数搭載し、新しい計算式を採用したため、ユニークで高品質、かつ手頃な価格のトレーディングツールとなっています。新しいトレンドやスキャルピングチャンスのトリガーポイントを正確に把握することができるため、あなたのトレードがどのように改善されるか想像してみてください。 ユーザーマニュアル:ここをクリック   https://www.mql5.com/en/blogs/post/708876 すべての時間枠に対応します。あなたはすぐにトレンドを見ることができるようになります! 新しいアルゴリズムに基づいて設計されているため、潜在的な取引の特定と確認がより簡単になります。これは、8つの主要通貨と1つのシンボルの強弱
取引レベルインジケーターは、エントリーポイント、ポジションの保持、トレンドの方向を決定するために設計された取引システムです。 1 つの複合体で動作する複数のメカニズム、トレンド方向の波動分析、シグナル構築時のレベル分析が含まれており、考えられる TP および SL ターゲットを示します。 インジケーターの機能 シグナル矢印は現在のローソク足に表示されますが、色は変更されません。 特別なアルゴリズムを使用して、価格が跳ね返るレベルを検索します。 トレンドに合わせた働きをします。 このシステムは汎用的であり、さまざまな取引商品に適用できます。 矢印アラートにはいくつかの種類があります。 信号矢印の入力パラメータは自動モードで設定され、動作します。 時間枠に基づいて「トレンド波期間」パラメータを変更します 「ターゲットレベル SL TP」パラメータは主要通貨ペアに対して定義されており、他の取引商品で使用する場合は 10 以上の増加が可能です。 インジケーターの仕組み トレンドを判断するには、インジケーターに波線があり、価格を下回っている場合はトレンドが弱気であり、価格を下回っている場
Was: $299  Now: $149   Supply Demand uses previous price action to identify potential imbalances between buyers and sellers. The key is to identify the better odds zones, not just the untouched ones. Blahtech Supply Demand indicator delivers functionality previously unavailable on any trading platform. This 4-in-1 indicator not only highlights the higher probability zones using a multi-criteria strength engine, but also combines it with multi-timeframe trend analysis, previously confirmed swings
Cycle Sniper
Elmira Memish
4.39 (36)
NEW YEAR SALE PRICE FOR LIMITED TIME!!! Please contact us after your purchase and we will send you the complimentary indicators to complete the system Cycle Sniper is not a holy grail but when you use it in a system which is explained in the videos, you will feel the difference. If you are not willing to focus on the charts designed with Cycle Sniper and other free tools we provide, we recommend not buying this indicator. We recommend watching the videos about the indiactor and system before pu
Bonus: when you buy  the indicator, any indicator for free (optional) .(Write in a private message or in telegram in the profile to receive a bonus) Quantum Entry is a powerful price action trading system built on one of the most popular and widely known strategies among traders: the Breakout Strategy! This indicator produces crystal clear buy and sell signals based on breakouts of key support and resistance zones. Unlike typical breakout indicators, it uses advanced calculations to accurately
Advanced Currency Strength Indicator The Advanced Divergence Currency Strength Indicator. Not only it breaks down all 28 forex currency pairs and calculates the strength of individual currencies across all timeframes , but, You'll be analyzing the WHOLE forex market in 1 window (In just 1 minute) . This indicator is very powerful because it reveals the true movements of the market.  It is highly recommended to  analyze charts knowing the performance of individual currencies or the countries eco
MTF Supply Demand Zones
Georgios Kalomoiropoulos
4.82 (22)
次世代の自動化された需要と供給のゾーン。どのチャートでも機能する新しい革新的なアルゴリズム。すべてのゾーンは、市場の価格行動に従って動的に作成されています。 2種類のアラート --> 1) 価格がゾーンに達したとき 2) 新しいゾーンが形成されたとき もう 1 つの役に立たない指標はありません。実績のある完全な取引戦略を手に入れることができます。     新機能:     価格が需給ゾーンに達したときにアラートを出す     新しい需給ゾーンが作成されたときにアラートを発します     プッシュ通知アラート     ピップ単位のゾーン幅ラベル     MTF のもう 1 つのタイムフレーム。したがって、現在より 2 時間足高いのではなく、現在より 3 時間足し上に見えるようになります。     アラート/ゾーン/MTF 機能を有効/無効にするボタン あなたが得る利点:     取引から感情を取り除きます。     取引エントリをオブジェクト化します。     確率の高いセットアップで利益を上げましょう。     描画ゾーンから時間を節約します。
ECM Elite Channel is a volatility-based indicator, developed with a specific time algorithm, which consists of finding possible corrections in the market. This indicator shows two outer lines, an inner line (retracement line) and an arrow sign, where the channel theory is to help identify overbought and oversold conditions in the market. The market price will generally fall between the boundaries of the channel. If prices touch or move outside the channel, it's a trading opportunity. The ind
ご紹介   クォンタム トレンド スナイパー インジケーターは 、トレンド反転を特定して取引する方法を変革する画期的な MQL5 インジケーターです。 13年以上の取引経験を持つ経験豊富なトレーダーのチームによって開発されました。     クォンタムトレンドスナイパーインジケーター   は、非常に高い精度でトレンドの反転を識別する革新的な方法で、あなたのトレーディングの旅を新たな高みに押し上げるように設計されています。 ***Quantum Trend Sniper Indicatorを購入すると、Quantum Breakout Indicatorを無料で入手できます!*** クォンタム ブレイクアウト インジケーターは、トレンドの反転を特定するとアラートを発し、矢印を示し、3 つのテイクプロフィットレベルを提案します。 初心者トレーダーにもプロのトレーダーにも適しています。 量子EAチャネル:       ここをクリック MT5のバージョン:       ここをクリック 推奨事項: 期間: すべての時間枠。最良の結果を得るには、M15、M30、H1 のタイム
Royal Scalping Indicator M4
Vahidreza Heidar Gholami
4.17 (6)
Royal Scalping Indicator is an advanced price adaptive indicator designed to generate high-quality trading signals. Built-in multi-timeframe and multi-currency capabilities make it even more powerful to have configurations based on different symbols and timeframes. This indicator is perfect for scalp trades as well as swing trades. Royal Scalping is not just an indicator, but a trading strategy itself. Features Price Adaptive Trend Detector Algorithm Multi-Timeframe and Multi-Currency Trend Low
System Trend Pro - This is the best trend trading indicator!!! The indicator no repaint!!!  The indicator has   MTF   mode, which adds confidence to trading on the trend (   no repaint   ). How to trade? Everything is very simple, we wait for the first signal (big arrow), then wait for the second signal (small arrow) and enter the market in the direction of the arrow. (See screens 1 and 2.) Exit on the opposite signal or take 20-30 pips, close half of it, and keep the rest until the opposite s
トレンドオシレーター:スムーズで信頼性の高いトレンド識別ツール トレンドオシレーターは、トレーダーがトレンドの方向と反転ポイントを正確に特定するのをサポートするために設計された、MT4向けの高度なインジケーターです。直感的なビジュアルで、相場が上昇トレンドにあるのか下降トレンドにあるのかを明確に示し、分析を簡素化し、チャートの視認性を向上させます。幅広い市場と時間枠に対応しており、さまざまな取引ニーズに柔軟に対応します。 トレンドオシレーターの主な特徴と利点 トレンドの簡素化されたビジュアライゼーション : トレンドオシレーターは、色が変わるラインでトレンドの動きを表現します。青色は上昇トレンド、黄色は下降トレンドを示し、即座にトレンド方向が分かります。 信頼性の高い反転シグナル : 高度なアルゴリズムを使用して、インジケーターは反転ポイントを示すカラフルな矢印を生成します。緑色の矢印は買いシグナル、赤色の矢印は売りシグナルを示し、トレーダーがエントリーやエグジットを評価するための重要なゾーンを特定するのに役立ちます。 あらゆる市場と時間枠に対応可能 : トレンドオシレーターは、さまざ
Volume Profile, Footprint and Market Profile TPO (Time Price Opportunity). Volume and TPO histogram bar and line charts. Volume Footprint charts. TPO letter and block marker collapsed and split structure charts. Static, dynamic and flexible range segmentation and compositing methods with relative and absolute visualizations. Session hours filtering and segment concatenation with Market Watch and custom user specifications. Graphical layering, positioning and styling options to suit the user's a
StalkeR Arrow
Abdulkarim Karazon
5 (3)
StalkeR Arrow は、バーオープン/バー内で売買シグナルを与える矢印インジケーターです。このインジケーターは価格行動パターンとフラクタルに基づいています。 このインジケーターは、各買いシグナルと売りシグナルの tp と sl を与えます。tp と sl は各シグナルの上下の線の形式であり、新しいシグナルが形成されるまで延長されます。 このインジケーターには、履歴シグナルの勝敗統計を提供するバックテスト パネル/ダッシュボードがありますが、このインジケーターは再ペイントやバックペイントを行いません。 パラメーター : StalkeR 周期 : 矢印周期、数値が大きいほど信号が少なくなります スプレッド: ポイント単位のスプレッド値を使用して、パネル上の勝敗を計算します。 ストップロス ATR x : atr 乗算における SL 値 Takeprofit ATR x : atr乗算のTP値 ATR 期間 : に基づいて tp と sl を計算するために使用する atr 期間 TP/SL ラインの色と幅 矢印の色と幅 パネル/ダッシュボードの位置。 ア
TrendMaestro
Stefano Frisetti
5 (3)
note: this indicator is for METATRADER4, if you want the version for METATRADER5 this is the link:  https://www.mql5.com/it/market/product/108106 TRENDMAESTRO ver 2.4 TRENDMAESTRO recognizes a new TREND in the bud, he never makes mistakes. The certainty of identifying a new TREND is priceless. DESCRIPTION TRENDMAESTRO identifies a new TREND in the bud, this indicator examines the volatility, volumes and momentum to identify the moment in which there is an explosion of one or more of these data a
作者のその他のプロダクト
This system is currently set for a multi time period. Examines the candles with a formula. The right time also notifies you. You can gain earnings using this system. Re-painting, feature is not available. Several indicator data, channel width and candlestick shadows are calculated. You can adjust the settings according to different time periods by trying the settings. The green line is the "take profit" level.
With this automatic trading software, the transaction is entered into when conditions comply with the rules of the algorithm (settings that can be changed by you). When a certain profit occurs, the system automatically takes profit and closes the transactions. You can benefit from many unique features of the control panel. Detailed information about its use will be shared with people who purchase it.
With this indicator, you can easily make price regions in all time zones. In addition, with the automatic supply demand finder, you can ensure that the new regions are found automatically. You can increase your transaction quality by reaching more accurate operations with this auxiliary Tool and indicator. I share your trial version of EURUSD for free with you. If you want to buy the working version in all parities, you can contact me. +New version Gap Bar Add ( Press G keyboard )  Default con
FREE
With this app you can find the stop out level live or without opening a transaction. The application consists of 3 boxes, you can enter the amount of money in your Balance box account or it will automatically calculate the current account amount. SELL lot size and BUY lot size can be entered, or trades that are currently open will be calculated automatically. Hedge transactions are calculated automatically. If you press the S key of the keyboard, you can access the boxes with the values entere
FREE
Risk Reward Tool , It is easy to use. With this tool you can see the rates of profit loss profit. You can see your strategy and earnings reward status of your goals.Double calculation can be done with single tool. Move with drag and drop.  You can adjust the lot amount for calculations. The calculation results are shown in the comment section. There may sometimes be graphical errors during movements. Calculations works at all currency. Calculations All CFD works. Updates and improvements will co
専門家が技術分析を行い、分析を見ることができます。 分析は、日中に更新されます。 メタトレーダーによるワンクリック分析が画面に表示されます。 これらの分析の保留中の注文がある場合は、ワンクリックでトランザクションを開きます。 それは非常に簡単で使いやすいです。 関連の分析、期間および情報はあなたのコンピュータに型板として救われる。 きをダウンロードしてからファイルフォルダです。 それは非常に教育的であり、あなたがお金を稼ぐのに役立つ製品です。 専門家が技術分析を行い、分析を見ることができます。 分析は、日中に更新されます。 メタトレーダーによるワンクリック分析が画面に表示されます。 これらの分析の保留中の注文がある場合は、ワンクリックでトランザクションを開きます。 それは非常に簡単で使いやすいです。 関連の分析、期間および情報はあなたのコンピュータに型板として救われる。 きをダウンロードしてからファイルフォルダです。 それは非常に教育的であり、あなたがお金を稼ぐのに役立つ製品です。
As a result of our four-year research, we were able to make such a perfect robot. We weren't thinking about selling it, but we wanted everybody to take advantage of it. You will see the difference in quality between the experiment. This Robot was made for US30 only. We do not recommend that you use it in other currencies. Transactions are much more successful in the rising market. Expert Configration :  SymbolUS30 = Your CFD Symbol Name Period : H1 BB Stop Low : 2 BB Stop High : 4 BB Stop Per :
This tool works on MT4. The connection to the IQ option box program is established. With this software, IQ Optiona opens orders in selected time periods. The IQ option box program is required. First, the connection to the IQ option box is established. Then you can trade by sending a trading order by adding MT4. IQ O BOX Free Connection Software Download Link. https://drive.google.com/open?id=1xW6ynCwtdbGL4_GFzXU7penZAvTwYaWP
With this software you can test your Forex strategies live. Compatible with Meta Trader 4. Extra features are available. You can trade through the panel. You can put signs with Fish Hook. In addition, your strategy test is saved to the file folder in csv format. You can review these reports with CSV Quick Viewer. One Lot can do with Scalp. Your account also determines the lot based on the amount of money found. It gives you information about the transaction before you open the transaction. You c
Oil King Premium
Mehmet Ozhan Hastaoglu
3.5 (2)
This robot works in 15-minute periods. Opens a limited number of transactions when it reaches a specific transaction volume. You can run the following system if you want to open operations. Set the amount of the lot from the set You can start the strategy test by typing the broker name of the Brent or WTI symbol type and selecting the lot amount. Symbol EA = Oils+ ( Sample Symbol Name Your Brokers )  Period : M15 ( Cancellation and Money Back Guarantee within 7 Days )  
This robot works in 60-minute periods. Opens a limited number of transactions when it reaches a specific transaction volume. You can run the following system if you want to open operations. Set the amount of the lot from the set You can start the strategy test by typing the broker name of the Us30 or Dow symbol type and selecting the lot amount. Symbol EA = US.30+ ( Sample Symbol Name Your Brokers )  Period : H1 ( Cancellation and Money Back Guarantee within 7 Days )  
ALPC forex Matrix produces signals based on five different strategies . ALPC forex Matrix copies itself to all charts. Quick and easy management is your responsibility. Forex trading is fast control. ALPC MATRIX FOREX SYSTEM DOCUMENTATION !Please open the scalp process according to the hourly trend direction. (does not work with strategy test) ALPC MATRIX 2015-2019 Supportive EA Tool for all Forex Pairs Producer: Mehmet Ozhan Hastaoglu ALPC MATRIX Forex System is actually a supportive tool wher
Provides maximum revenue from trends. You can receive signals from Zigzag, Front Fibonacci Retracement, Back Fibonacci Retracement and Stochastic Oscillator indicators. You can run these indicators in the background. It will give you a warning at the levels you set. You can change all levels from the settings. Designed to help you get the most out of trends. Fibo Level : 38.2 / 61.8 / 76.4 Stochastic : 20 / 80
This indicator guides you like a hunter. Tacheprofit and StopLoss levels. See the difference in the experiment. Works in all periods. Works at all rates. You can win with this system. The crossing of the mean and the re-test were done according to the rule. You can see the transactions by moving backwards on the strategy test screen. The whole system is automatically calculated.
軍用犬s-軍を識別するスタート地点としてのインド処理します。 彼はすべてのペリドスのために働く。 戦略をダブルクリックすると、設定からADRレベルを開くことができます。 あなたはADR機能をオフにした場合、それはより多くの取引を見つけるでしょう。  特に、独自の戦略に加えて、それはあなたがより良い品質のフィルタを介して処理入力を渡すことができます。 あなたは、ADRレベルは、特定の毎日のボリュームを平均化し、ポイント数がこれらのレベルに近づいたときに取引を通知したいですか? 私たちは50ポイントに設定し、一般的な設定ではADRを制御しました。  オンにするには、strategy1ADR制御設定をtrueに設定する必要があります。 実験を指標に設定します。 指paritatesは、それが異なるすべての期間についてです。 そのような割引の助けは、あなたが勝つための補完的な効果をもたらすでしょう。
の分析の貯蔵ソフトウェアできるためにも連敗は避け分析において、為替します。 それは時間の無駄であり、それを何回も分析することを迷惑を掛けない。 すべてのタイムゾーンを記録し、いつでも画面にアップロードできます。 それは非常にシンプルで使いやすいです。 紫色のボタンをクリックして分析を保存するだけです。 その後、記録された分析の一部は緑色で表示されます。 緑色のボタンをクリックすると、新しいウィンドウも保存した分析に復元されます。 設定から、保存する分析の数を入力することができます。 .....................................................................
The characteristics of this exploit are that all forex transactions opened can be controlled with a single click according to the risk reward system. You can also take your stop loss level to the opening price at any time. You can change rates of buy or stop loss in two ways. You can close lots of opened trades in a single click. Everything will be calculated automatically. You can also see how many pips remain to the profit and stop loss levels. Your biggest assistant and a tool to manage your
With the Bollinger band following system, you can get the most profit. In addition, detailed system settings are available. You can see how the system works by allowing the strategy test module to process at certain dates. The dual-channel Bollinger band system is more efficient than the normal following systems. You set the Bollinger Band deviation settings in this system Expert Settings. The most recommended is 2-4 and 5-1. This system is our invention and we offer it for the first time. Expe
This expert is the robot of the "Military Dog" indicator. Expert Properties : SymbolEA = Broker Symbol Name Sample  SymbolEA = EURUSDpro input double TrendLot=1; // Lot Size input int Minumum_Point_Profit=50; // Minumum Profit Select Position input int Stop_Loss_Point=0; //  Stop loss should be broad or not used. input bool BB_Trailing_Stop_Loss=true; input bool BB_Trailing_Stop_Up=4; input bool BB_Trailing_Stop_Down=2; input int BB_Trailing_Period = 20; Military dog s-army will help you iden
This EA guides you like a hunter. Tacheprofit and StopLoss levels. See the difference in the experiment. Works in all periods. Works at all rates. You can win with this system. The crossing of the mean and the re-test were done according to the rule. You can see the transactions by moving backwards on the strategy test screen. The whole system is automatically calculated.
You can trade one-way with this product. Pre-adjustable start and end price entries are made. Then, the transaction intervals are determined. When the price reaches its target, trade stops. The most important issue is to find the start and end according to the support resistance levels. In addition, the maximum number of transactions that can be opened with risk management can be limited. Some price levels will be given free of charge when purchasing this product. Thank you for your support by p
3D MA Scanner allows you to determine the most accurate entry places between the MAs you have determined. At the same time, it generates a signal to you at the processing entry point. You can make calculations by determining up to 5 MAs. Apart from forex trading, its use will also be beneficial for investors interested in binary options. The transactions opened are closed half after a certain profit level, the risk of loss is reset and the profit model that automatically monitors the price wo
With this indicator, you can easily make price regions in all time zones. In addition, with the automatic supply demand finder, you can ensure that the new regions are found automatically. You can increase your transaction quality by reaching more accurate operations with this auxiliary Tool and indicator. I share your trial version of EURUSD for free with you. If you want to buy the working version in all parities, you can contact me. +New version Gap Bar Add ( Press G keyboard )  +Redsword P
With this automatic trading forex robot, trades are opened in the direction of the trend, regardless of which direction the price moves. In this video, it is seen that with a balance of $ 100, the forex trading robot made 100% profit in 2 months. This Forex trading robot opens Trend directional trading. This trading robot also hedges transactions. This trading robot opens trades according to the specified distance. Whichever direction the price moves, it continues to open transactions in that di
Price Action Supply/Demand, Support/Resistance, Swing Low, Swing High Scanner Indicator is a software designed to automatically draw and mark regions on price charts, making it easier for traders to identify potential reaction sites. The software can be used for various currency pairs and commodities such as AUDCAD, gold, and bitcoin. Highlights The software automatically marks regions on price charts, indicating past working areas and potential reaction sites. Traders can easily switch be
Fx Slot Game
Mehmet Ozhan Hastaoglu
日本のガムルスティック 外国為替注文を変えました 楽しいスロットマシンをあなたに。 さあ、楽しんで勝ちましょう。 興奮を感じることができない ゲームをせずに 本物のお金で。 これから本当のゲームが始まります、 準備はできたか? ゲームは非常にシンプルで、画面上のボックスのいずれかをクリックします。 次に、ランダム性の規則に従って形成された番号に基づいてボックスが選択されます。 選択したボックスが価格を下回っている場合は自動的に購入が行われ、価格がボックスを上回っている場合は自動的に販売が行われます。 Tp と SL は、上部および下部のボックス フィールドによって自動的に決定されます。 お金の一部を危険にさらすことで、FX を運任せのゲームに変えることができます。 画面を縮小・拡大することでボックスの数を増やすことができます。 設定後はキーボードの「X」を押すだけです。
Your trading life will be easier with the Forex Control Panel. This control panel, which has many features, is very easy and simple to use. With this control panel, you will have 3 different ea features. You can learn how to use it from the special video I prepared for you. You can buy this product, whose normal price is $125, at a much cheaper price than its current discounted price. You can also try all its features in the strategy test. A pdf file explaining its detailed features will be
Risk Reward Tool , It is easy to use. With this tool you can see the rates of profit loss profit. You can see your strategy and earnings reward status of your goals.Double calculation can be done with single tool. Move with drag and drop.  You can adjust the lot amount for calculations. The calculation results are shown in the comment section. There may sometimes be graphical errors during movements. Calculations works at all currency. Calculations All CFD works. Updates and improvements will co
フィルタ:
レビューなし
レビューに返信