ScalperX Pro
- インディケータ
- Mustafa Sabir
- バージョン: 1.0
- アクティベーション: 5
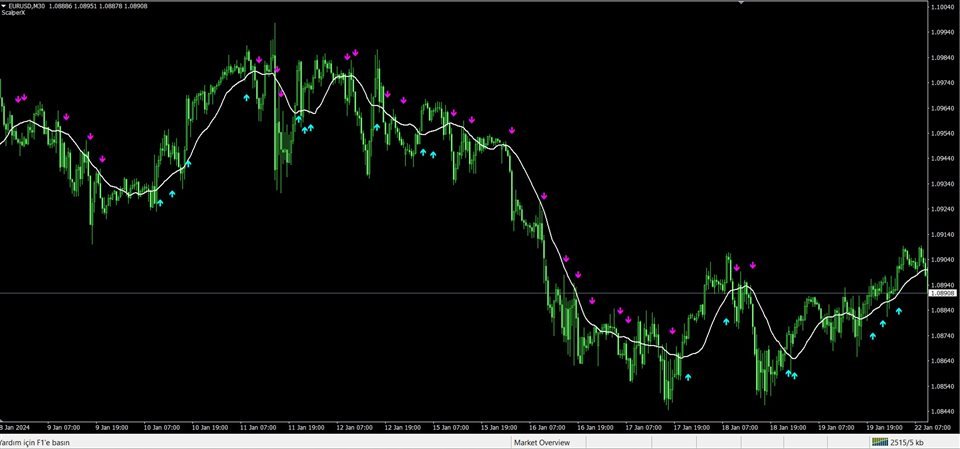
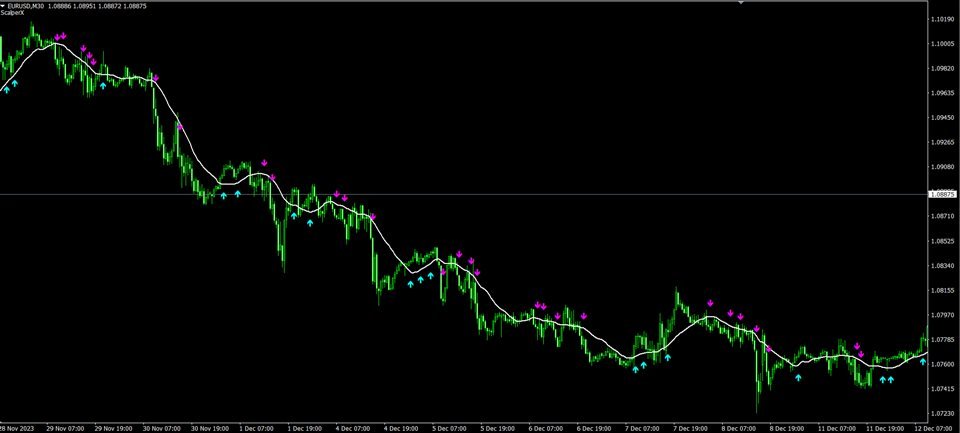
- First of all, it is worth highlighting here that this Trading Indicator is Non Repainting, Non Redrawing and Non Lagging, which makes it ideal for manual trading.
- Never repaint and recalculate
- Once an arrow appears it never disappears, the signal comes at the opening of the new candle
- You will now be more profitable with this indicator
- The indicator will alert you when an arrow appears
- You can do swing trading or scalping trading
- The indicator helps you identify the trend
- Can be optimized across all pairs and time frames
- Blue arrow is for buying, red arrow is for selling.
- You can use scalper x alone or as an addition to your strategy.
- Please contact me with any questions or suggestions.
- https://www.mql5.com/en/users/ummuhan/seller
-
Contact me for the source code of the indicator
-
Contact:mersatrade@gmail.com