Anchored VWAP with Standard Deviation Bands
- インディケータ
- Ryan L Johnson
- バージョン: 1.5
- アップデート済み: 13 12月 2024
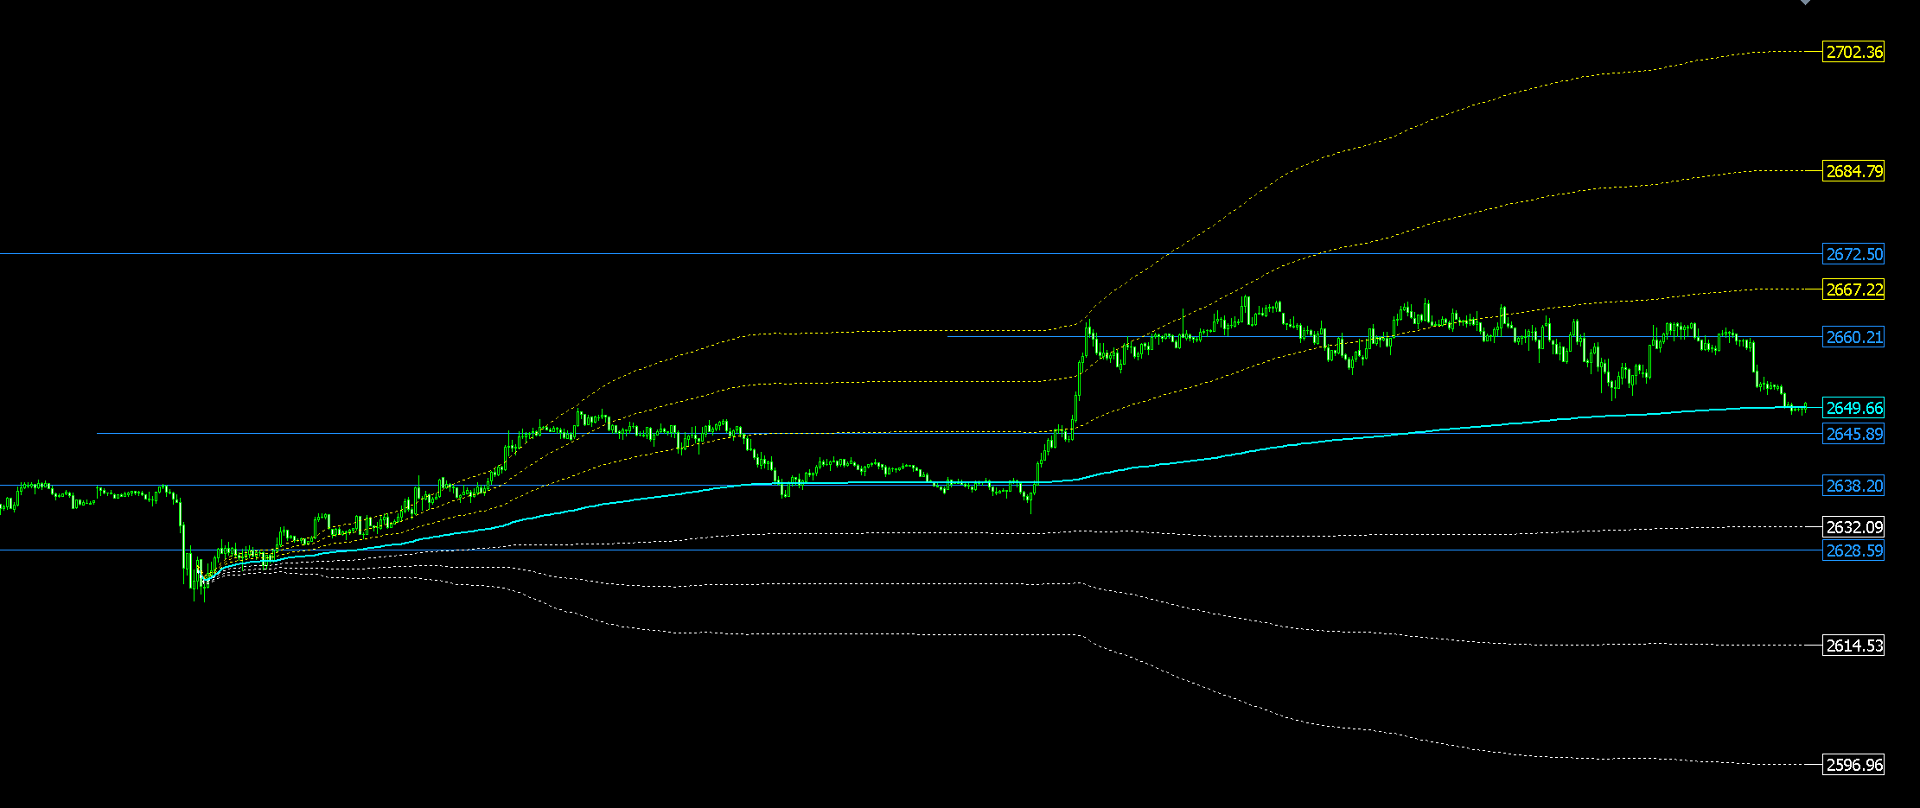
出来高加重平均価格インジケーターは、MT5 のメインチャートウィンドウに表示されるラインスタディインジケーターです。インジケーターは、典型的な価格と、インジケーターラインを頻繁に取引される価格に自動的に押し上げるために使用される取引量を監視します。これらの価格は、最も多くの契約 (またはロット) が取引された価格です。次に、それらの加重価格がルックバック期間にわたって平均化され、インジケーターはそれらのプッシュされた価格でラインスタディを表示します。
この投稿のインジケーターを使用すると、トレーダーはルックバック期間の毎日の開始時間を設定できます。MT5 を初めて使用するトレーダーの場合、マウスポインターで各バーをロールオーバーするだけで、チャート上の各バーの開始時間を表示できます。このインジケーターは、日中取引のみを対象としています。
このインジケーターを使用すると、VWAP とバンドの開始を最新の主要な高値または安値に固定できます。その高値または安値が数日前にチャートに表示された場合でも同様です。機関投資家や流動性プロバイダーは、VWAP を使用して市場を取引することがよくあります。
このインジケーターは、ボリンジャー バンド インジケーターがそのようなバンドを表示するのと同様に、6 つの標準偏差バンドも表示します。トレーダーは、出来高加重平均価格ライン スタディの上に 3 つの個別の標準偏差乗数値を設定し、出来高加重平均価格ライン スタディの下に 3 つの個別の標準偏差乗数値を設定できます。インジケーターは累積的であるため、乗数値が高いほど、急速に拡大する標準偏差バンドが生成されます。
このインジケーターには、日次価格圧縮レベルも組み込まれています。各価格圧縮レベルは、それぞれの日の中で価格が最も狭い範囲に限定されている価格レベルに表示されます。圧縮レベルを分析する履歴内の日数は、DaysBackCL 入力で設定されます。すべての圧縮レベルは、チャート上で現在形成されているバーまで時間的に自動的に前方に拡張されます。すべてのラインとレベルの価格ラベルもこのインジケーターに組み込まれており、チャート上で現在形成されているバーのすぐ右側に表示されます。価格ラベルは、ShowVWAPandSDlabels および ShowCompressionLevelsLabel 入力を使用してオン/オフにできます。
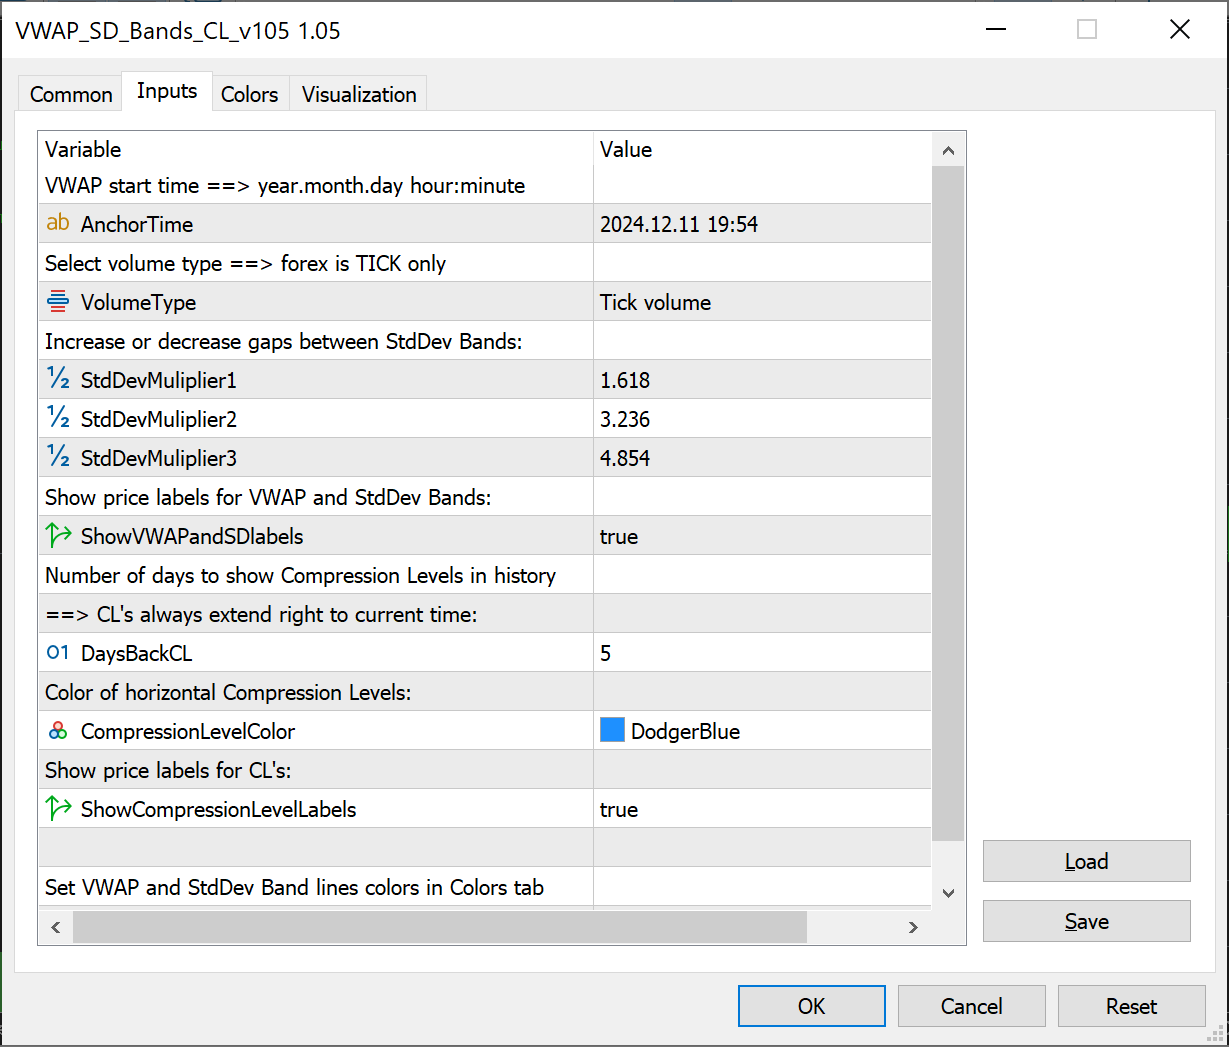
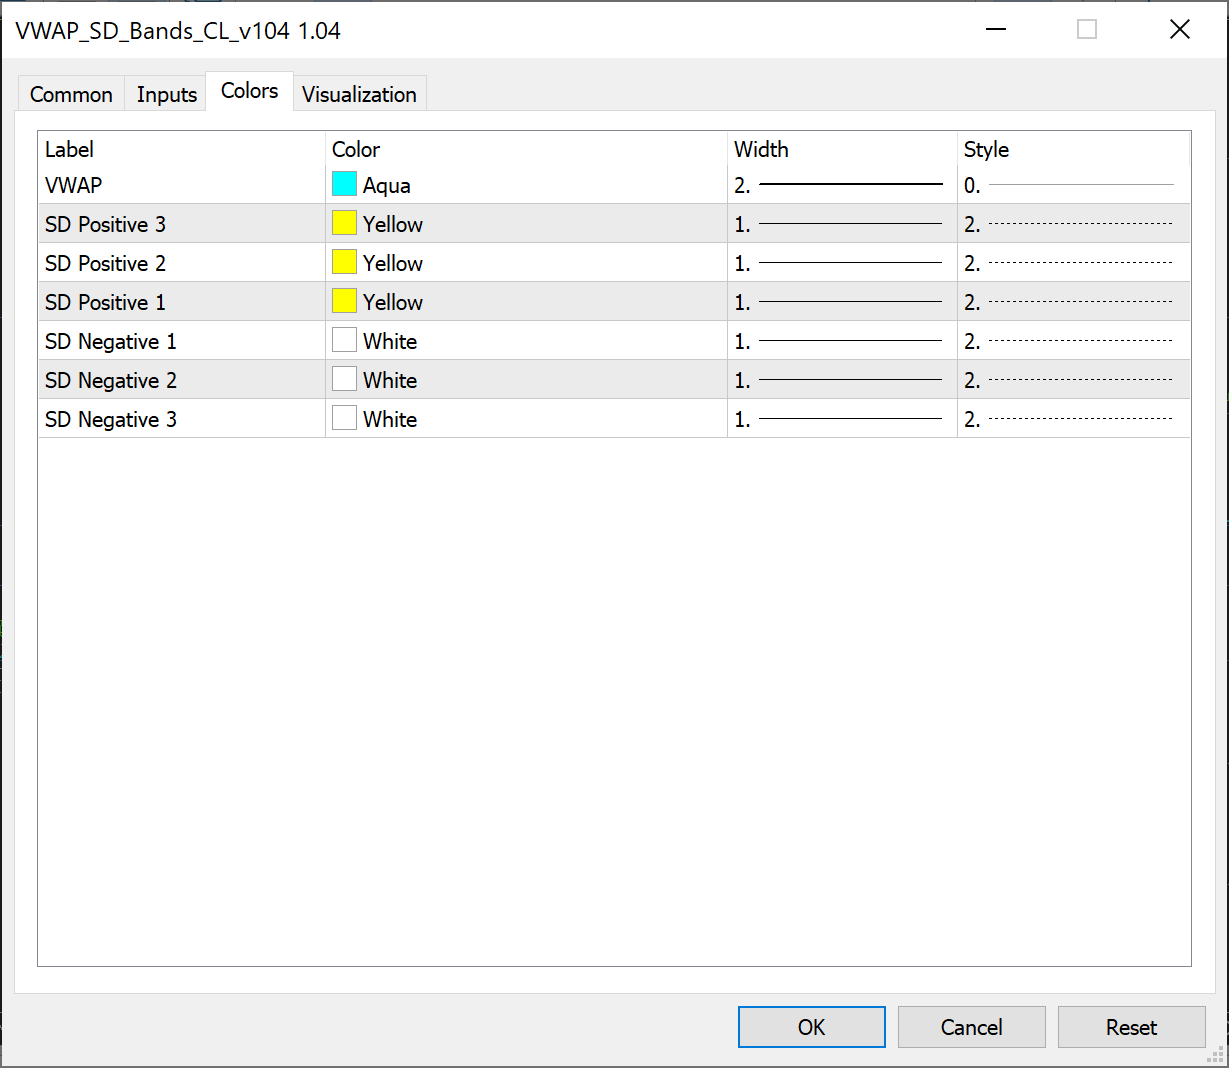
インジケーターの設定は、下図のように、インジケーターの [入力] タブとインジケーターの [色] タブでトレーダーが変更できます。
念のため、一般的な標準偏差バンドの設定は次のとおりです。
1.618、3.236、4.854。または
1.000、2.000、3.000。または
1.250、1.500、2.000。
使用例 *:
レンジ相場 (横ばい) では、標準偏差バンド (SD3) の両端で取引を開始し、価格が VWAP ライン スタディに戻ったら終了します。
オプションで、取引を分散します。たとえば、SD1Pos で 3 つの契約 (またはロット、ミニ ロット、マイクロ ロットなど) を売り、SD2Pos で 2 つを売り、SD3Pos で 3 つを売ります。VWAP で終了します。買いの場合は逆を行います。 (カーソルを標準偏差バンドの上に置くと、SD1Pos、SD1Neg などのラベルが表示されます)。または
SD1Pos と SD1 Neg の間でトレードし、標準偏差ラインから別の標準偏差ラインへ交互に売買します。
トレンド (上昇または下降) 市場では、価格バーが VWAP ライン スタディの上に開いたときに買いエントリーし、上の最も近い標準偏差バンド (SD1Pos) で終了します。
オプションで、同じトレードを繰り返しますが、VWAP の代わりに SD1Pos、SD1 の代わりに SD2Pos を使用します。売りの場合は反転します。または
すべてのライン (VWAP、SD1Pos、SD2Pos、および SD3Pos) を同じようにトレードします。これも売りの場合は反転します。
圧縮レベルは、価格が相互作用する直接の重心 (または「磁石」) として機能します。
VWAP と圧縮レベルの合流点を探します。これらは、価格がブレイクアウトする前に過充電される可能性があるレベルです。または
2 つの標準偏差バンドの間にある圧縮レベルを探し、価格が圧縮レベルを尊重し続ける間に圧縮レベルまでスキャルピングします。
標準偏差バンドで圧縮レベルの方向にエントリーします。
価格が圧縮レベルに戻ったら終了します。
* 上記の取引条件は網羅的なものではありません。7 本のラインは、多くの創造的な取引方法を提供します。
インジケーター ライン (インジケーター バッファー) は、Expert Advisor ビルダー ソフトウェアによって作成された Expert Advisor またはカスタム コーディングされた Expert Advisor で iCustom を使用して呼び出すことができます。
空の値はありません。
再描画はありません。
法的免責事項: この投稿の内容は、取引または投資に関するアドバイスと解釈されるものではありません。上記のすべての例は、ここに投稿されたインジケーターの技術的特徴と仮想的な使用法を示すだけです。