Anchored VWAP with Standard Deviation Bands
- Indicators
- Ryan L Johnson
- Version: 1.3
- Updated: 8 September 2023
- Activations: 5
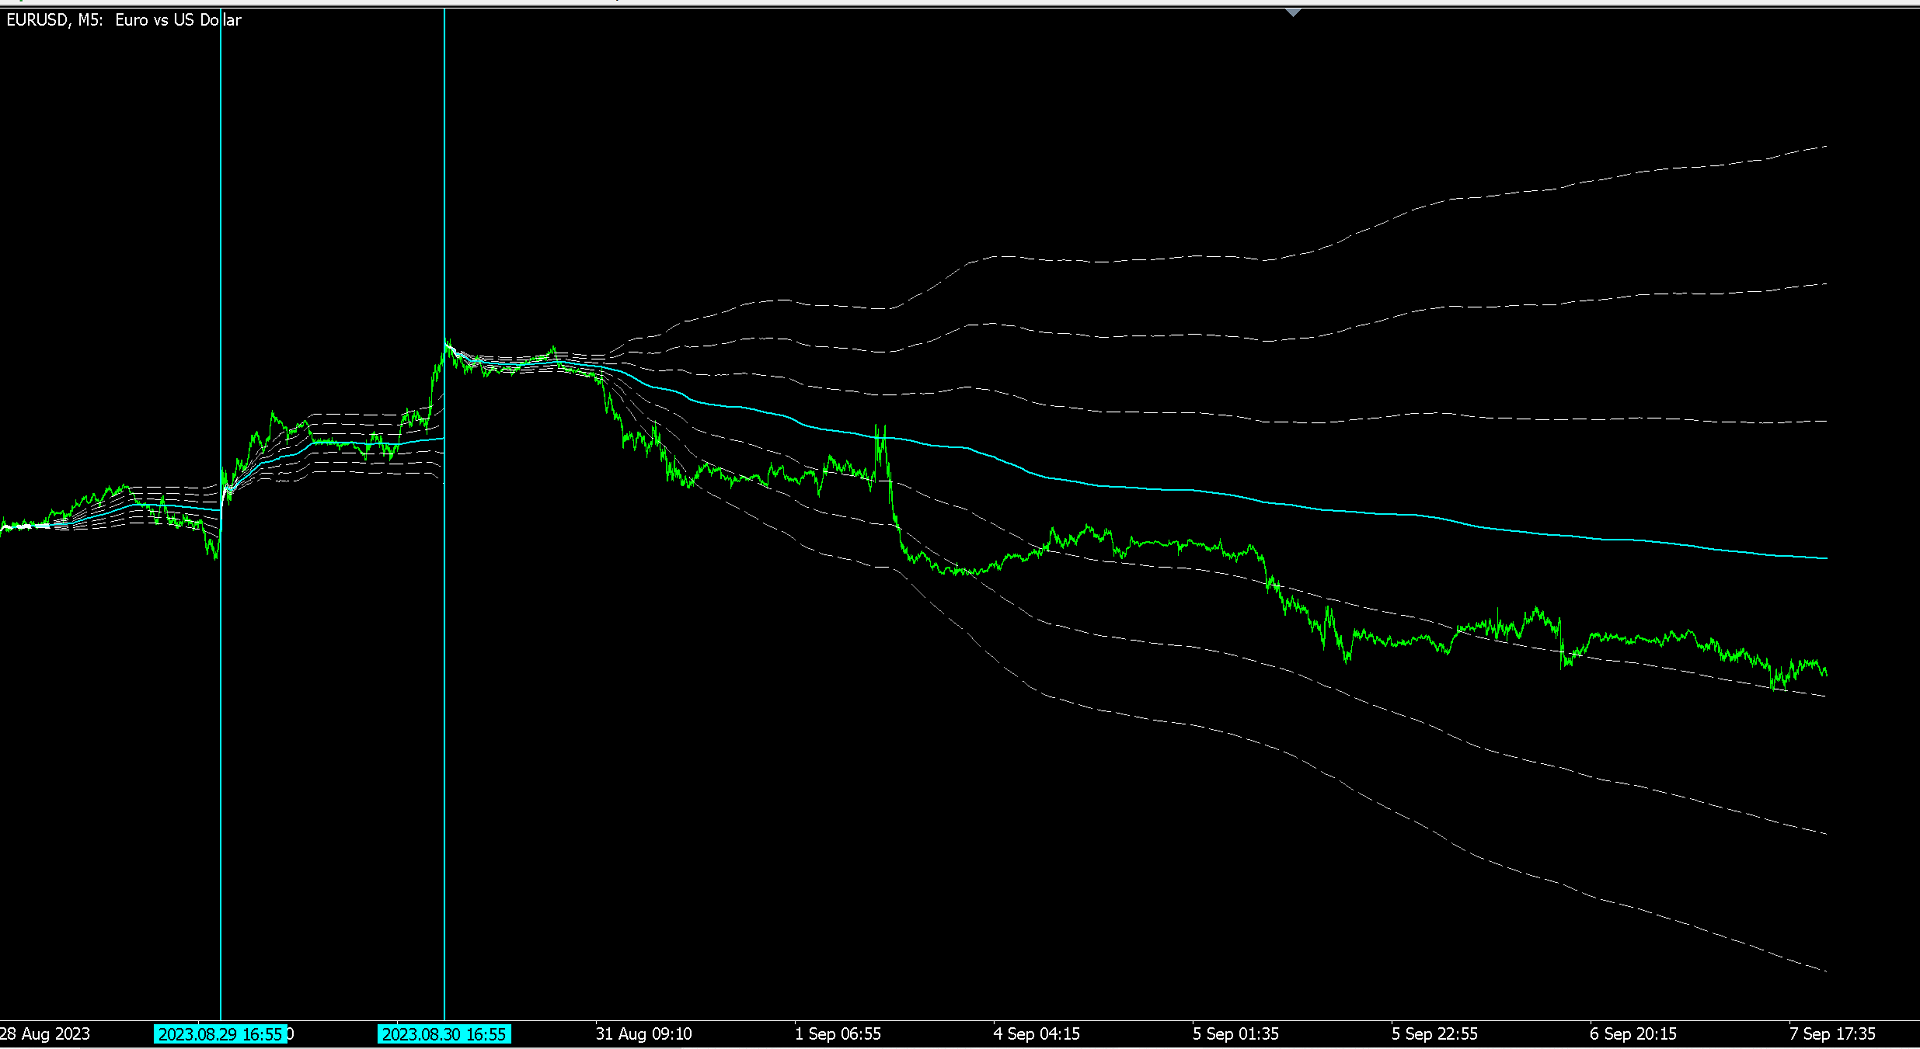
The volume weighted average price indicator is a line study indicator that shows in the main chart window of MT5. The indicator monitors the typical price and then trading volume used to automatically push the indicator line toward heavily traded prices. These prices are where the most contracts (or lots) have been traded. Then those weighted prices are averaged over a look back period, and the indicator shows the line study at those pushed prices.
The indicator in this post allows the trader to set the daily start time of that look back period. This indicator automatically shows 5 daily look back periods: the currently forming period, and the 4 previous days based on that same start time. For this reason, this indicator is intended for intraday trading only. The indicator automatically shows vertical daily start time separator lines for those days as well. Both typical prices and volumes are accumulated throughout the day, and processed throughout the day.
Important update: v102 of this indicator allows you to anchor the start of the VWAP and bands to the most recent major high or low, even when that high or low appears in your chart several days ago. This is how institutional traders and liquidity providers often trade markets with the VWAP.
This indicator also shows 6 standard deviation bands, similarly to the way that a Bollinger Bands indicator shows such bands. The trader is able to set 3 individual standard deviation multiplier values above the volume weighted average price line study, and 3 individual standard deviation multiplier values below the volume weighted average price line study. Higher multiplier values will generate rapidly expanding standard deviation bands because again, the indicator is cumulative.
The following indicator parameters can be changed by the trader in the indicator Inputs tab:
- Volume Type [defaults to: Real volume] - Set to Tick volume for over-the-counter markets such as most forex markets. Real volume is an additional setting for centralized markets such as the United States Chicago Mercantile Exchange.
- VWAP Start Hour [defaults to: 07] - Set according to broker's or broker-dealer's MT5 server time in 24 hour format. For example, in the New York, United States time zone, 07 is approximately the London, United Kingdom business open hour.
- VWAP Start Minute [defaults to: 00] - Set according to broker's or broker-dealer's MT5 server time in 24 hour format. For example, 00 is on the hour with no delay of minutes within that hour.
- StdDev Multiplier 1 [defaults to: 1.618] - Set desired standard deviation distance between the volume weighted average price line study and its nearest upper and lower bands. For example, 1.618 is a basic Fibonacci ratio. Some traders prefer 1.000 or 1.250 here.
- StdDev Multiplier 2 [defaults to: 3.236] - Set desired standard deviation distance between the volume weighted average price line study and its middle upper and lower bands. For example, 3.236 is 1.618 (above) + 1.618. Some traders prefer 2.000 or 1.500 here.
- StdDev Multiplier 3 [defaults to: 4.854] - Set desired standard deviation distance between the volume weighted average price line study and its furthest upper and lower bands. For example, 4.854 is 1.618 (above) + 3.236 (above). Some traders prefer 3.000 or 2.000 here.
- VWAP Color [defaults to: Aqua] - Set desired VWAP line study color. This color automatically sets the color of the start time separators as well.
- SD1 Color [defaults to: White] - Set desired color of nearest upper and lower standard deviation lines.
- SD2 Color [defaults to: White] - Set desired color of middle upper and lower standard deviation lines.
- SD3 Color [defaults to: White] - Set desired color of furthest upper and lower standard deviation lines.
Just to clarify, popular standard deviation bands settings are:
- 1.618, 3.236, and 4.854; or
- 1.000, 2.000, and 3.000; or
- 1.250, 1.500, and 2.000.
Examples of usage *:
- In a ranging (sideways) market, enter a trade at the extremes of the standard deviation bands (SD3) and exit when price returns to the VWAP line study.
- Optionally, spread out the trade. For example, sell 3 contracts (or lots, mini lots, micro lots, etc.) at SD1Pos, sell 2 at SD2Pos, and sell 3 at SD3Pos. Exit at VWAP. Do reverse for buy. (Roll cursor over standard deviation bands to see SD1Pos, SD1Neg, etc. labels); or
- Trade between SD1Pos and SD1 Neg, alternately buying and selling from one standard deviation line to the other.
- In a trending (rising or falling) market, enter a buy when a price bar opens above the VWAP line study, and exit at the nearest standard deviation band above (SD1Pos).
- Optionally, repeat the same trade but substitute SD1Pos for the VWAP, and SD2Pos for SD1. Reverse for sell; or
- Trade all lines (VWAP, SD1Pos, SD2Pos, and SD3Pos) in the same way. Again, reverse for sell.
* The above trading conditions are not exhaustive. 7 lines provide many creative way to trade.
Indicator lines (indicator buffers) can be called with iCustom in Expert Advisors created by Expert Advisor builder software or custom coded Expert Advisors:
- No empty values; and
- No repainting.
This indicator will not load without live market data--the market must be open.
LEGAL DISCLAIMER: Nothing in this post may be construed as trading nor investment advice. Any and all examples provided above merely illustrate the technical features and hypothetical usage of the indicator posted herein.