Doteki Heikin Ashi for MT4
- インディケータ
- Fernando Carreiro
- バージョン: 1.1
(Google 翻訳)
標準の平均足ローソク表現には、指数に相当する始値があります。 合計価格の移動平均 (EMA)。EMA の アルファ 値は固定されています 0.5 (EMA 期間 3.0 に相当)。
この動的バージョンでは、期間を使用したい任意の値に変更できます。 マルチタイムフレーム分析を概算するか、低値または高値を一種のトレーリング ストップ ロスとして使用します。 の交差点 平均足の始値を超える実際の終値も、変動のシグナルとして使用できます。 トレンド方向。
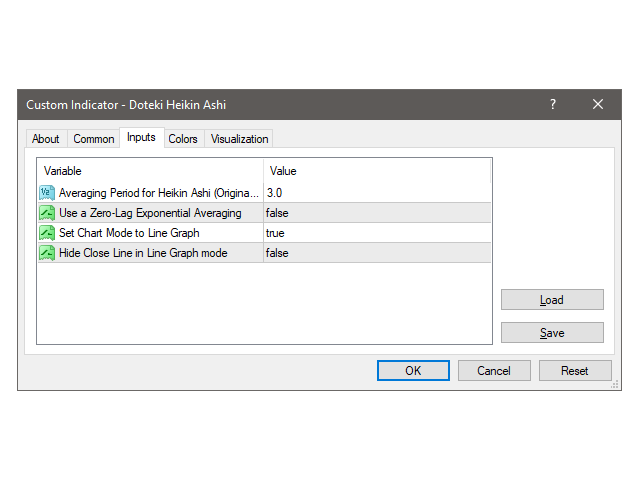
また、標準の EMA に加えて、このバージョンには Almost Zero-Lag EMA を使用するオプションもあります 代わりに、トレンド方向の変化をより迅速に検出できます。特に、より長い期間の 平均化。
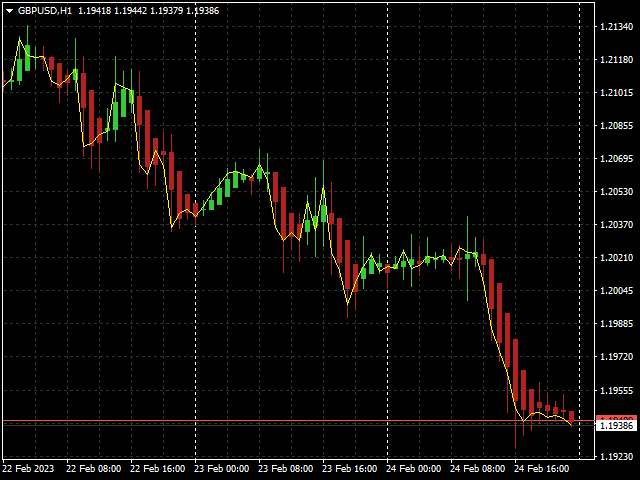
インジケータをチャートに添付する場合、チャートを自動的に ただし、折れ線グラフ モードとオプションで実際の 終値 を 折れ線グラフ から非表示にすると、 それがなければ、実際の終値価格と Heikin Ashi オープンバリュー。
(Original text)
The standard Heikin Ashi candle representation has an open value that is equivalent to an Exponential Moving Average (EMA) of the Total Price, of which the alpha value of the EMA is fixed at 0.5 (equivalent to an EMA period of 3.0).
In this dynamic version, the period can be changed to whatever value one wishes to use, which also allows one to approximate multi-time-frame analysis, or use the low or high value as a sort of trailing stop-loss. The crossing of the real Close price over the Heikin Ashi open value can also be used as a signal for a change in trend direction.
Also, besides the standard EMA, this version also has the option of using an Almost Zero-Lag EMA instead, which can detect changes in trend direction more quickly, especially when using longer periods of averaging.
When attaching the indicator to the chart, you also have the option of automatically switching the Chart into the Line Graph Mode and optionally hiding the real Close prices from the Line Graph, however, without it, you will not be able to see the cross-over signals between the real Close prices and the Heikin Ashi open values.











Very responsive. Helps you get in the trade early.