Doteki Heikin Ashi for MT4
- Indicadores
- Fernando Carreiro
- Versión: 1.1
(Traducción de Google)
La representación estándar de la vela Heikin Ashi tiene un valor abierto que es equivalente a un Exponencial Media Móvil (EMA) del Precio Total, del cual el valor alfa de la EMA es fijo en 0,5 (equivalente a un período EMA de 3,0).
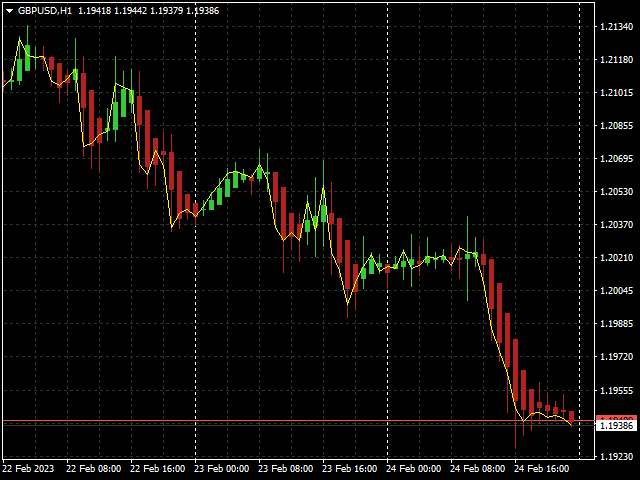
En esta versión dinámica, el período se puede cambiar a cualquier valor que se desee utilizar, lo que también permite análisis aproximado de marcos de tiempo múltiples, o use el valor bajo o alto como una especie de stop-loss dinámico. el cruce de el precio real de Cierre sobre el valor de apertura Heikin Ashi también se puede utilizar como una señal para un cambio en dirección de la tendencia.
Además, además de la EMA estándar, esta versión también tiene la opción de usar una EMA de retraso casi nulo en cambio, que puede detectar cambios en la dirección de la tendencia más rápidamente, especialmente cuando se usan períodos más largos de promedio.
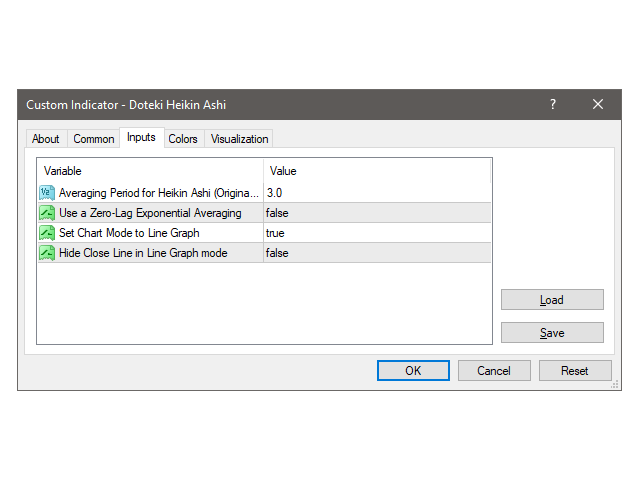
Al adjuntar el indicador al gráfico, también tiene la opción de cambiar automáticamente el gráfico al Modo de gráfico de líneas y, opcionalmente, ocultar los precios reales de Cierre del Gráfico de líneas, sin embargo, sin él, no podrá ver las señales cruzadas entre los precios reales de Cierre y el Heikin Ashi valores abiertos.
(Original text)
The standard Heikin Ashi candle representation has an open value that is equivalent to an Exponential Moving Average (EMA) of the Total Price, of which the alpha value of the EMA is fixed at 0.5 (equivalent to an EMA period of 3.0).
In this dynamic version, the period can be changed to whatever value one wishes to use, which also allows one to approximate multi-time-frame analysis, or use the low or high value as a sort of trailing stop-loss. The crossing of the real Close price over the Heikin Ashi open value can also be used as a signal for a change in trend direction.
Also, besides the standard EMA, this version also has the option of using an Almost Zero-Lag EMA instead, which can detect changes in trend direction more quickly, especially when using longer periods of averaging.
When attaching the indicator to the chart, you also have the option of automatically switching the Chart into the Line Graph Mode and optionally hiding the real Close prices from the Line Graph, however, without it, you will not be able to see the cross-over signals between the real Close prices and the Heikin Ashi open values.














Very responsive. Helps you get in the trade early.