• 概要
  • レビュー
  • コメント
  • 最新情報

MTF Precise Price Action Arrow Filtered

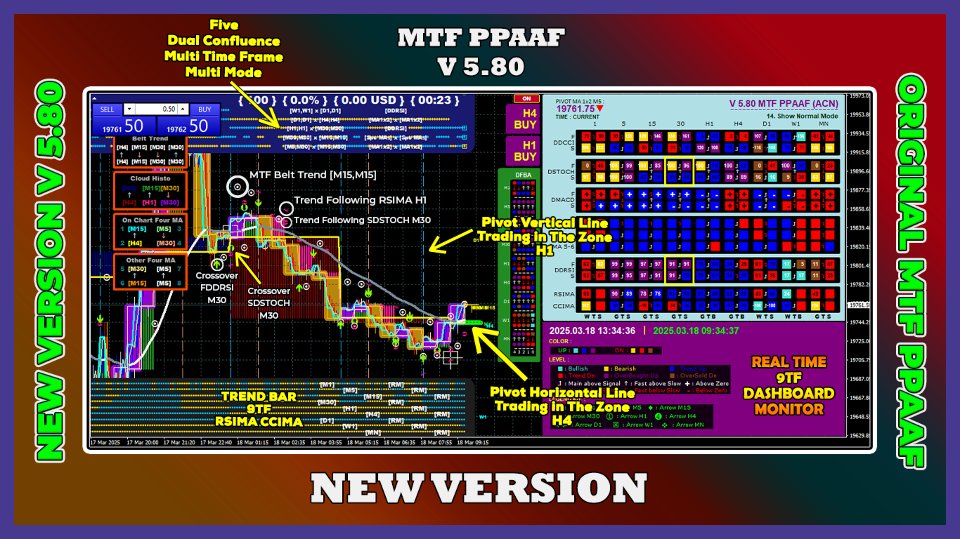
インジケーターを 1 つしか使用しないためにトレードで頻繁に負ける場合は、この取引ツールを試してください。 この取引ツールは複数のインジケーターを使用します。 私はRSIインジケーターのみを使用するトレーダーをよく観察します。 市場は売られすぎているのにまだ下落している、または市場は買われすぎているのにまだ上昇していることがよくあります。 このため、複数のインジケーターを使用する必要があります。 新しいバージョン V 3.40 MTF PPAAF の紹介: マルチ タイム フレームの正確なプライス アクション矢印フィルター。 この取引ツールは、市場の動きの方向性を強化するためにさまざまな指標を使用します。

この取引ツールで使用される最初の指標はデュアル ストキャスティクスです。 ここでは、ファスト ストキャスティクスとスロー ストキャスティクスという 2 つのストキャスティクスを使用します。 ファストストキャスティクスには、ファストストキャスティクスメインラインとファストストキャスティクスシグナルラインがあります。 同様に、スロー ストキャスティックには、スロー ストキャスティック メイン ラインとスロー ストキャスティック シグナル ラインがあります。 本線と信号線の交差点・交差部分は上下の矢印になります。

2 番目の指標は Double RSI、つまり高速 RSI と低速 RSI です。 2 つの交差点は上下の矢印を形成します。

3 番目の指標は Double CCI、つまり高速 CCI と低速 CCI です。 2 つの交差点は上下の矢印を形成します。

4 番目のインジケーターはデュアル MACD です。 デュアル ストキャスティクスと同様に、ここには Fast MACD と Slow MACD があります。 Fast MACD には、Fast MACD メイン ラインと Fast MACD シグナル ラインがあります。 同様に、Slow MACD には、Slow MACD メイン ラインと Slow MACD シグナル ラインがあります。 本線と信号線の交差点は上下の矢印になります。

5 番目の指標は RSIMA です。 名前が示すように、ここでは上下の矢印は RSI ラインと移動平均 (MA) ラインの交点によって決定されます。 RSI > MA の場合は矢印が上になり、その逆も同様です。

6 番目の指標は Four MA です。 ここでは、MA 1、2、3、4 という 4 つの移動平均線を使用します。 MA 1 ラインと MA 2 の交点、および MA 3 ラインと MA 4 の交点は上矢印と下矢印を形成します。

私の研究結果によると、多くのトレーダーは 1 つのインジケーターしか使用していないために負けています。 それが私がこの取引ツールを作成した理由です。 上記で説明した6つの指標は、市場の動きの方向性を強化します。

次に、リアルタイムで市場の動きを確認するために、さまざまな TOP 機能を追加しました。

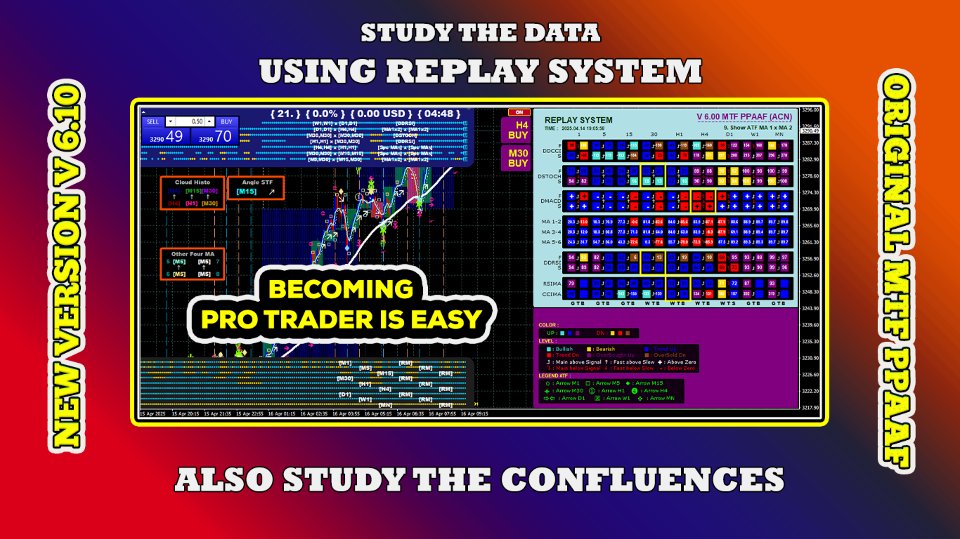
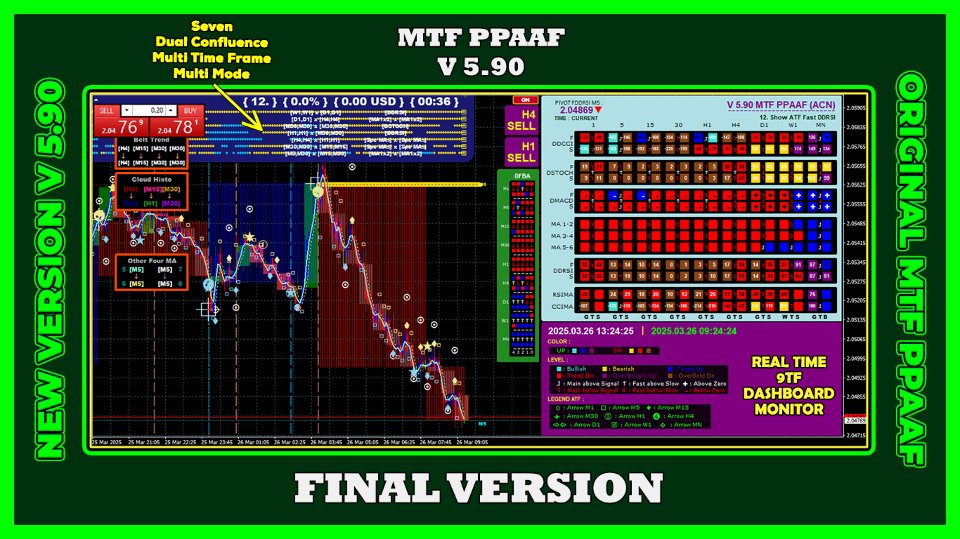
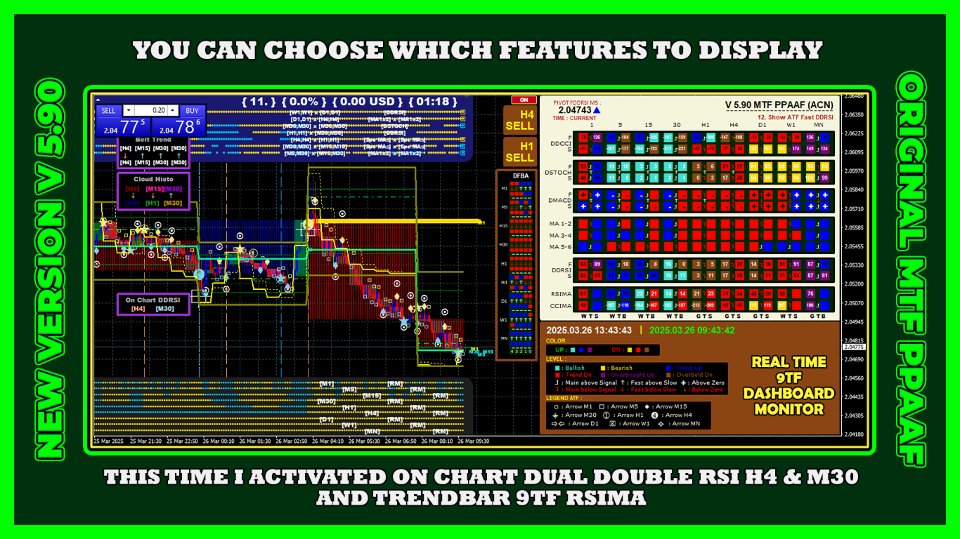
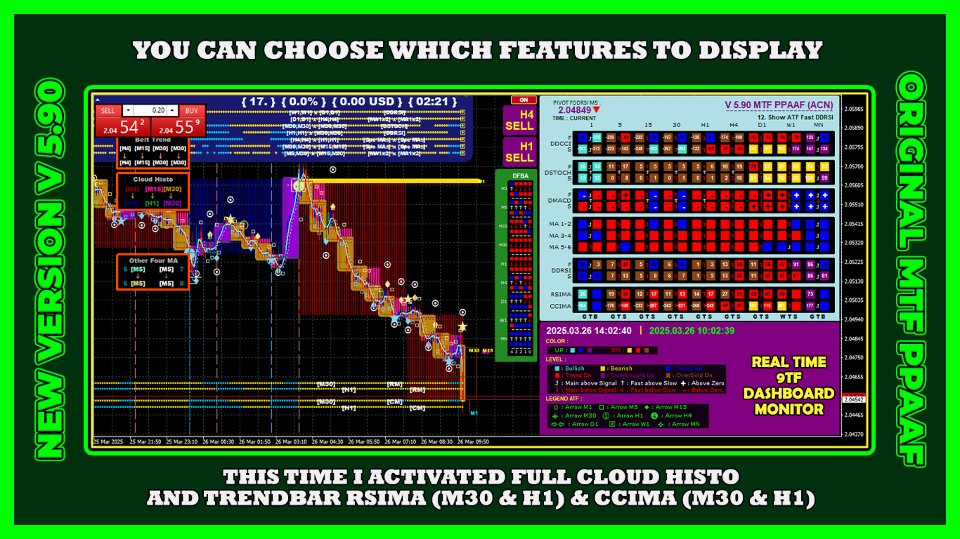
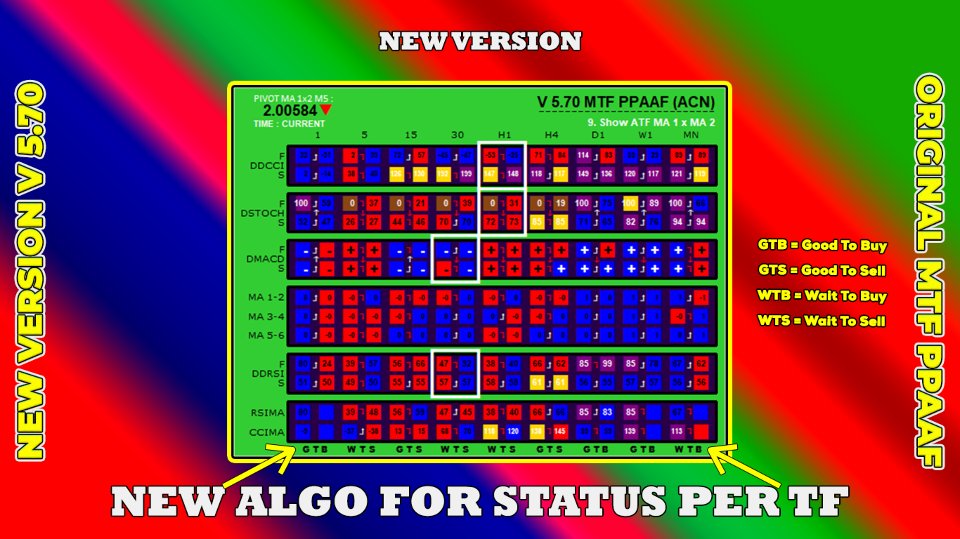
1. リアルタイム 9TF ダッシュボード モニター。 この機能を使用すると、1 分の時間枠から MN1 時間枠までの市場の動きをリアルタイムで確認できます。 ダッシュボードでは、メイン ラインがシグナル ラインより大きいかどうか、高速 RSI ラインが低速 RSI ラインより大きいかどうか、RSI ラインがすべてアップしているかどうかなどを確認できます。 また、ストキャスティクス、RSI、CCI レベルが買われ過ぎか売られ過ぎかを確認することもできます。 OBOS(買われすぎ・売られすぎ)レベルを知ることは非常に重要です。

2. チャートの特徴について。 視覚的に監視することが重要です。 このため、オン チャート デュアル ストキャスティック、オン チャート 4 MA、オン チャート ダブル RSI、およびオン チャート True RSIMA 機能を追加しました。 参考までに、チャート ウィンドウにストキャスティクスを配置する方が、サブ ウィンドウにストキャスティクスを配置するよりも正確です。 チャートウィンドウでメインラインとシグナルラインの交点をリアルタイムで観察することで、エントリーポイントとエグジットポイントを確実に判断できるようになります。 私の原則は安く買って高く売ることです。 その原則を思い出してください。

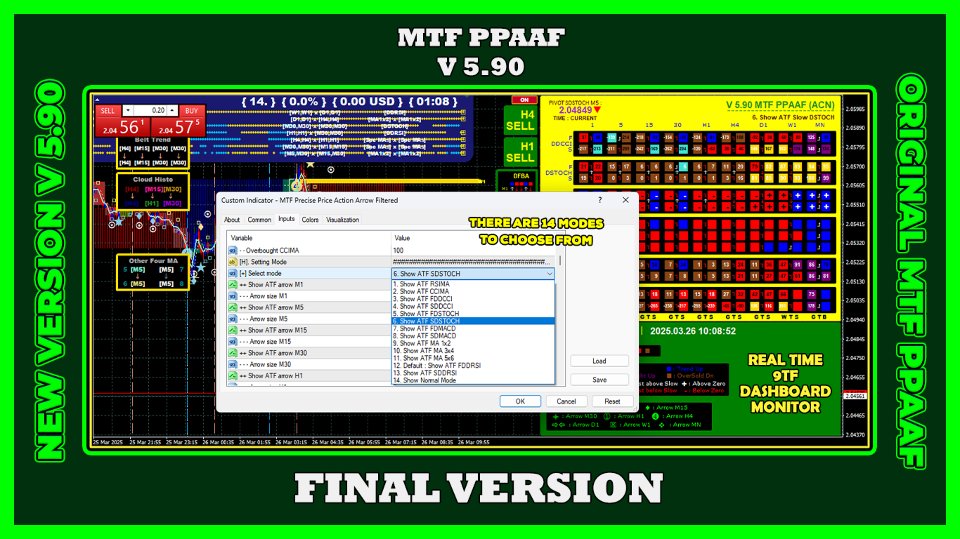
3. この取引ツールは、ATF (全時間枠) クロスオーバー矢印を表示できます。

- ATF を表示 高速ストキャスティクス (モード 1)、つまり高速ストキャスティクス メイン ライン x 高速ストキャスティクス シグナル ライン

- ATF Fast MACD (モード 2) を表示します。つまり、Fast MACD メイン ライン x Fast MACD シグナル ラインです。

- ATF MA 1x2 (モード 3)、つまり移動平均 1 x 移動平均 2 を表示します。

- ATF DRSI (モード 4)、つまり高速 RSI x 低速 RSI を表示します。

- ATF RSIMA (モード 5)、つまり RSI x MA を表示します。

- ATF DCCI (モード 6) を表示します。つまり、高速 CCI x 低速 CCI

- ATF を表示 高速確率的 DRSI (モード 7)、つまり高速確率的メインライン x 高速確率的信号ラインと高速 RSI x 低速 RSI

- ゾーン (モード 8)、つまり MA 1 ラインと MA 2 および MA 3 ラインと MA 4 の交点での取引。

4. スーパートレンドアロー(STA)。 STA 計算モードには 2 つあります。 1 つ目は、RSI と MA のクロスオーバーに基づく STA です。 2 つ目は、Fast RSI と Slow RSI のクロスオーバーです。

5. STF に従うトレンド (選択した時間枠)。 ここでは、ご希望に応じて時間枠を選択できます。 2 本の線が交差する場合は、矢印が表示されます。 さらに、2 つの線の角度がすべて正 (上) またはすべて負 (下) の場合、トレンドフォロー矢印が表示されます。

6. STA モード 2 に基づく 9TF トレンド バー機能。観察できるトレンド バーは 5 つあります。

一番右のトレンドバーは最新のリアルタイムトレンドバー(0)です。 前のトレンド バー (1、2、3、4) が続きます。 このトレンド バーは、前の時間枠から現在の時間枠までの市場トレンドの方向の変化を観察するのに役立ちます。

7. ピボットレベル機能。 この機能は、クロスオーバーが発生したオープンローソクポイントレベルを表示します。 ピボットレベルac

S&R、つまりサポートとレジスタンスのようなものではありません。


8. リプレイシステム。 この機能を使用すると、時間を遡って、特定の日時に 9TF ダッシュボードの状態を観察できます。 2023.10.11 14:21:30 に市場が売られた理由を分析したいとします。 この機能を使用するには、M5 など、より低い時間枠で Meta Trader 4 チャートを開きます。


9. ローソク足HTF(ハイタイムフレーム)。 この機能を使用すると、チャートを低い時間枠で開くと、高い時間枠 (H1 など) での市場の動きを確認できます (私は M5 で開くのが好きです)。


10. TSPI (時間スプレッド利益情報)。 この機能を使用すると、現在の時刻、スプレッド、損益、損益の割合をリアルタイムで確認できます。


11. オン/オフボタン機能。 この機能を使用すると、ワンクリックでこの取引ツールを表示または非表示にすることができます。 面白いですよね?


12. 20 種類のダッシュボードの配色から選択できます。 この機能を使用すると、グラフの色と一致するダッシュボードの色を選択できます。


13. カスタマイズ可能なパラメータ。 インジケーターの計算に使用されるすべてのパラメーターは、希望に応じて調整できます。 確率パラメータ 14,3,3 や 5,3,3 などを使用することも、デフォルト設定を使用することもできます。


14. MTF、つまりマルチタイムフレーム。 ご希望に応じて時間枠を設定できます。 たとえば、M5 と H1 の時間枠でチャートのデュアル ストキャスティクス機能を有効にするとします。 あなたはできる!


15. ノンリペイントアロー (NRPA)。 2 本の線が交差すると、交差矢印が表示されます。 非常に多くの場合、ボラティリティが高いため、次の数秒および数分間は 2 つの線が交差しません。 その結果、先ほど現れた矢印は消えてしまいました。 これは非常に重要な機能です。 ボラティリティが高いときは、それまで上向きだった矢印が下向きになる可能性があることに注意してください。 先ほど現れた矢印が一瞬で消えてしまう可能性があります。 だからこそ、私のメッセージは、リアルタイム 9TF ダッシュボード モニターを使用して検証することです。


16. Confluence 3TF 機能、つまり 3TF 高速確率的コンフルエンス、3TF 高速 MACD コンフルエンス、3TF MA 1x2 コンフルエンス、および 3TF DRSI コンフルエンス。 この機能を使用すると、3TF (3 タイムフレーム) 交差点の観察が非常に簡単になります。 これは、たとえば、タイムフレーム (M5、M15、M30) で高速確率メインライン > 高速確率シグナルラインの場合、上矢印が表示されることを意味します。


17. Confluence デュアル ストキャスティクスと confluence デュアル MACD。 この機能を使用すると、ファースト ストキャスティクスとスロー ストキャスティクスでメイン ライン > シグナル ラインがある場合に上矢印が表示されます。 デュアルMACDの場合も同様です。 これは、同じ時間枠内で 2 つのストキャスティクスと 2 つの MACD の交差を観察するための非常に重要な機能です。


18.トレンドベルト特集。 この機能は、チャート上に 2 つの移動平均を表示することに加えてのものです。 もちろんご希望に合わせて時間帯を設定することも可能です。


1 つの取引指標だけを使用することはあまり説得力がありません。 そのため、いくつかの指標を組み合わせて市場の方向性に関する分析を強化しています。


価格アクションの動きは、次の 6 つのインジケーターのいずれかを使用してフィルタリングできます。


シオマ

デュアル MACD (新バージョン 1.3!)

デュアル ストキャスティクス (新バージョン 1.3!)

ダブル CCI (新バージョン 2.3!)

4 移動平均 (新バージョン 1.6! 2 移動平均だけではありません)

ダブル RSI (新バージョン 1.2!)

リアルタイムの 9TF ダッシュボードを監視することで、価格変動の方向の強さを判断できます。


9TF ダッシュボード モニターには、4 つの移動平均、RSIMA、Double RSI、Dual MACD、Dual Stochastic、Double CCI のリアルタイム データが表示されます。


ボタンをクリックするだけでインジケーターを表示または非表示にできます。

9TF リアルタイムダッシュボードモニター

9TF 4 移動平均の監視、つまり MA 1x2 および MA 3x4

高速MAラインが低速MAラインの上か下かを監視

高速MAと低速MAの角度を監視する

9TF ダブル RSI、つまり高速 RSI と低速 RSI のモニタリング

高速 RSI ラインが低速 RSI ラインより上か下かを監視する

9TF デュアル MACD、つまり高速 MACD (MACD 1) の上または下、低速 MACD (MACD 2) が上昇または下降していることを監視します。

メインMACDラインがシグナルMACDラインの上か下かを監視する

9TF デュアル ストキャスティクスのモニタリング、つまり、ファースト ストキャスティクス (ストキャスティクス 1) がスロー ストキャスティクス (ストキャスティクス 2) の上または下で、上昇または下降していることを監視します。

メイン確率線がシグナル確率線の上か下かを監視

9TF Double CCI、つまりOBOSライン上の位置と現在の動きのモニタリング

9TF RSIOMA、つまり RSI ラインが MA ラインの上または下を監視する

パラメータを設定し、必要に応じて時間枠を選択する機能

凡例の表示/非表示を切り替える機能

バーの数を増減する機能、デフォルトは 800 バーです

最大 20 個のダッシュボードの配色を選択可能

このインジケーターは、選択した時間枠の RSIMA 矢印を表示できます。

このインジケーターは、選択した時間枠の MACD 矢印を表示できます。

このインジケーターは、選択した時間枠の確率的矢印を表示できます。

このインジケーターは、選択した時間枠の MA 1x2 および MA 3x4 の矢印を表示できます。

このインジケーターは、選択した時間枠の両 RSI 矢印を表示できます。

このインジケーターは、選択した時間枠の二重 CCI 矢印を表示できます。

再描画しない矢印

おすすめのプロダクト
ROC acceleration-deceleration is the manual system for medium-term scalping. Indicator based on custom ROC system which defines bullish/bearish market and especially  acceleration-deceleration of tendention in the market's main direction. Buy arrow is plotted during bearish market when current trend decelerates and sell  arrow is plotted during bullish market when current trend decelerates. Main Indicator's Features Signals are not repaint,non-late or disappear(exept cases when system recalculat
Check out my youtube channel about forex trading robots:  https://www.youtube.com/channel/UCL_p6fuQtNkg-1rRY69t5Ig Message me on telegram if you have any questions:  https://t.me/BRobotTrader H1 TIMEFRAME Updates and improvements(2021.08.12): USE THE SET FILES FROM THE COMMENT SECTION! This is the biggest update in the life of the KILIMANJARO EA, it got new features and NEW engine, plus many new parameters to optimize and play around with. ---It got the official TheNomadTrader Dynamic e
Trend New Trend Indicator, shows the signals for entry. Displays both entry points and the trend itself. Shows statistically calculated moments for entering the market with arrows. When using the indicator, it is possible to optimally distribute the risk factor. Settings: Uses all one parameter for settings. Selecting a parameter, it is necessary to visually resemble it so that the appropriate graph has a projection of extremes. Options: Length - the number of bars for calculating the indica
It's a variation of mid of HH and LL since it compares the higher of HH or LL against a period and twice the number of bars back to avoid whipsaws. I used to display this against lines on a chart, but made a histogram out of it and it looks interesting. It looks good at gauging trend strength and general turns (see image below). The name of the indicator is BAM, which is an acronym for "Below and Above Mid". Ways to use it: 1. To see general trend on longer TFs (more than 30 bars back).
PTW NON REPAINT TRADING SYSTEM + HISTOGRAM Non-Repainting ,   Non-Redrawing   and   Non-Lagging  Trading System. Does the following: - Gives Accurate Entry and Exit Points - Scalping, Day and Swing Trading  - 95% Accuracy  - Targets, where to take profits. - Shows Trends, Support and resistance levels - Works on All Brokers - Works on All Currencies, CFDs and Stocks - It does not place trades for you, it only shows you what trades to place. - It works on All Timeframes - It is for Trend or ran
Function Indicate Buy Sell Signals Indicate Strength of Buy Sell Signals This system is for both type of traders (Short & Long Term) Instead of Other Calculations, Parabolic Sar & Awesome are also used In Any time frame this can be use. What is in for Trader? Trading Switch:  Short Term & Long Term Finally, we all knows that Forex Trading needs completely concentrate & proper cash management, So I never promising that my program will never give you loss but I tried well to provide good and respo
FREE
This system never paints.   This system created by using Envolpes bands and reverse bar count.   This indicator is only working in M5 period.   This system is for long term and profitable.   Signals are shown as arrows. as an optional limit orders.   You can set a voice alarm or email notification.   You can fins our other products from link : https://www.mql5.com/en/users/drbastem/seller   Also, you can ask all your questins from email : haskayafx@gmail.com or mobile : +90 530 867 5076 or @Meh
最高のパフォーマンスを実現。利益出金用に最適化。 新しいオプションの導入 - 利益出金のエミュレーションによるテスト。 アルティメットヒーローは、FXの利益を最大化するために設計された高度な取引ツールです。この高度な取引ソフトウェアは、最新のGPT-4テクノロジーを使用して作成され、幅広い高度な機能を備えています。 アルティメットヒーローは、マーチンゲールシステムに基づいたグリッド取引戦略を使用する取引ボットです。市場の実勢に応じて複数の取引を行うことで、安定したリターンを提供するように設計されています。 エキスパートアドバイザーは、異なる価格レベルで複数の注文を発注し、現在の市場価格を中心としたグリッドを作成するグリッド取引方法を使用します。このアプローチにより、ボットは常に市場に存在し、両方向の潜在的な値動きを捉えます。 アルティメットヒーローは、マーチンゲール取引システムを使用してリスクを管理し、利益を確保します。このシステムでは、同じ利益目標を維持しながら、その後の取引サイズを大きくすることで、負け取引の影響を最小限に抑え、勝ち取引からの潜在的利益を最大化します。 取引専門家
Using multiple timeframes for analysis with Multi Timeframe Average Directional Index  can provide several significant benefits for traders: Comprehensive Market View: By applying Mtf ADX Standard across different timeframes, traders gain a broader perspective on market dynamics. This allows them to identify trends, patterns, and potential reversal points that might be more apparent or consistent across various scales. Enhanced Pattern Recognition: Multiple timeframes help in identifying repeati
FREE
Primus Trading Engine is a trading system that combines price action,ratio based indicators & custom indicators to create this leading indicator with a multi-timeframe approach to give you high probability trade setups for forex,CFD cash/futures,metals & binary option to assist in making predictions on what is MOST likely to happen in the market Main Chart Features Price Action Signal-Arrow displayed on a specific bar;NOT buy/sell arrow;DOES NOT repaint;Bullish arrow on a bullish bar,price is l
チャートを構成し、周期的な価格変動を識別するテクニカル指標。 どのチャートでも動作します。 いくつかの種類の通知。 グラフ自体に追加の矢印があります。 履歴を再描画せずに、キャンドルのクローズに取り組みます。 M5以上のTFを推奨します。 パラメータの使用と設定が簡単です。 異なるパラメータを持つ 2 つのインジケーターを使用する場合、他のインジケーターなしで使用できます。 入力パラメータは2つあります 周期性と信号持続時間 これら 2 つのパラメータは、チャート構造の処理を扱います。 Cyclicity - 反転サイクルが変化する頻度を調整し、サイクルを滑らかにします。 Signal duration - 最小数では価格変動の衝動を検出し、最大数では長期的なトレンドの動きを検出します。
Valentines trend is an easy-to-use indicator that hides a powerful calculation math-system "under the hood". Attach the indicator to the chart and set the parameters. Period - period for tracking changes in quotes Amount of Bars - number of last bars to track You do not need to select any numerical parameters. The indicator will do everything for you automatically . Each signal is generated on the current bar, and in order not to miss it, use the built-in alerts and notifications system . The in
This trading expert advisors is an clone & upgrade of  "EA Rough Duster ", also trades best on GBPNZD minute 5 timeframe. Maintains a constant account growth and runs best on low spread and commission based accounts. Uses Martingale & perfect hedging to recover unprofitable positions ensuring no loss. Its consistent profit curves,low DrawDowns & risk proves the record for itself in reliability and consistency plus its unique market analysis ensures quick extraction of profits by scalping the mar
The AlgoKing Lightning Bolt Strategy is a trade manager and has multiple indicators built for a complete trading strategy.  Here is a list of indicators built in. Indicators Auto drawn Support and Resistance signals Auto drawn RSI Divergence signals Auto drawn Fibonacci Retracement signals with buy and sell entry lines. Lightning Bolt reversal signals. Auto drawn trend lines. Trade Management Auto take partials at simple moving average targets. Auto take partial and stop losses at Fibonacci ret
この取引ツールを使用すると、15 の市場を同時にスキャンできます。 新しい取引指標 2024 のご紹介: ️ ダッシュボード マルチ通貨 マルチタイムフレーム 確率的。 私がこの取引ツールを作成した理由は少なくとも 2 つあります。 まず、1 つの市場だけを観察することに飽きました。 次に、別の市場への参入の瞬間を逃したくないです。 だからこそ、他の市況も同時に知りたいのです。 このため、複数の市場の状況を同時にスキャンできるスキャナーが必要です。 私は確率的メインライン > (または <=) 確率的シグナルラインが M1 から H4 (または単に M1 から M30) で始まる市場をよく探します。 私の分析に同意するなら、これがあなたが探していた取引指標です。 市況が上記の要件を満たす瞬間を見逃さないでください。 これは、多くの優れた機能を備えたストキャスティックのスキャナーまたはダッシュボードです。 確率的メインラインのデータを表示可能 確率シグナルラインのデータを表示可能 確率的メインラインとシグナルラインの位置を表示可能(シグナルラインの上のメインライ
Reversal Overlap Bot is an automated trading strategy. No technical indicators are used in the work. At the beginning of trading, the first order is placed in a certain direction (at your option). When you open a new candle, this order is closed if it is in profit. Otherwise, the next order opens in the opposite direction. Orders are closed when profit is reached. If there are unprofitable orders on the chart, the robot will close one of them. When closing loss-making orders, the profit covers t
Testing Trade
Glory Orluike Echonwere
The indicator is a 15-minute signal indicator for all types of traders. Meaning, you could make lots of profits trading two different signals in one indicator. NOTE: Both indicators are channels for achieving the same result. RED ARROW -- Sell Signal BLUE ARROW -- Buy Signal Purchase now to be part of our community. We offer standard chart setups for both novice and intermediate traders. Trade with ease!
FREE
The indicator scans for TD Combo signals in multiple timeframes for the all markets filtered and shows the results on Dashboard. Key Features Dashboard can be used for all markets It can scan for signals on MN1, W1, D1, H4, H1, M30, M15 ,M5, M1 timeframes Parameters UseMarketWatch: Set true to copy all symbols available in market watch MarketWatchCount : Set the number of symbols that you want to copy from the market watch list. CustomSymbols: Enter the custom symbols that you want to be availa
E13 Acid Flux
Dariel Iserne Carrera
4 (1)
Based on a combination of indicators, E13 Acid Fulx is an excellent indicator for knowing when to buy or sell on any asset and temporaryity. The indicator myself I have used it as a tool for my analysis when trading Forex. It is a useful and easy-to-understand trend indicator.  If you combine it with your own analyses you will surely get a good result in your operation.
FREE
Power Trend Indicator for MetaTrader 4 The Power Trend Indicator for MetaTrader 4 is designed to assess both the momentum and direction of price movements. This MT4 indicator presents the trend strength using a four-color-coded system, allowing traders to spot weak momentum phases and anticipate potential trend initiations. Its visual feedback is valuable for recognizing shifts in market sentiment and detecting trend transitions. Red signals indicate reversals, blue suggests mild trends, while g
FREE
Synapse Trader: トレードの新たな可能性を開くニューラルネットワーク 市場を分析するだけでなく、日々学習し、変化する市場環境に適応するインテリジェントなアシスタントとなるアドバイザーを想像してください。Synapse Traderは、先進的なニューラルネットワーク技術を基にしたユニークなツールで、市場の微細なシグナルを捉えることができます。ただのアドバイザーではなく、思考し、予測し、進化する「生きたニューラルネットワーク」です。 限定特別価格として、ホリデー期間中にSynapse Trader EAを399ドルで提供します。その後、価格は大幅に上昇します。この機会をお見逃しなく! 残り5つのコピーが399ドルで購入可能です。 プライベートチャンネルに加入するには、ダイレクトメッセージでお問い合わせください。 購入後に必ずご連絡ください。アドバイザーの設定をサポートいたします。 リアルタイムシグナル : スト ラ テ ジ ー モジュール 1 スト ラ テ ジ ー モジュール 2 スト ラ テ ジ ー モジュール 3 Synapse Trader は、トレーディングにおけるニ
Boost binary option profesional
Sebastian Alejandro Merino Sepulveda
Binarias & Forex (+90% Ratio-Win Next Candle) Espere que el precio llegue a una buena zona (fuerte) sea soporte, resistencia, zona de oferta o demanda, fibonacci level key, cifra redonda. Haciendo lo anterior definitivamente habrá una reversión en el precio y obtendrá su ITM en primera vela dando una efectividad del 100% siguiendo la tendencia. Es muy importante estar atento a las noticias fundamentales en el mercado y estas no afecten tu trading. Sesiones comerciales: cualquiera (24 horas).
The algorithm of the advisor calculates the important support and resistance levels. Next, the Expert Advisor calculates the probability of price movement "to" or "away" from this price level. Support: https://www.mql5.com/en/channels/TrendHunter If a high probability of price movement in the desired direction is determined, the advisor opens a deal. Each trade is protected by a stop loss. Dangerous trading methods are not used. Recommended instruments (5M): GBPUSD, EURUSD, USDJPY, USDCAD. Ad
1.Determine the trend size based on the chart cycle.   An uptrend near the highest price in a period of time.   A trend down near the lowest price in a period of time. 2.   short-term trends.   Oversold and long;   Overbought, short. 3. Unwind positions based on overbought and oversold and profit points. real-time signal: https://www.mql5.com/zh/signals/1538661?source=Site+Signals+My EA Settings: You need to load EA into the currency pair to trade (M15 time range). The best performing symbol : E
高度なインデックス スナイパー ロボットをご紹介します。スキャルピングとスイング アルゴリズムは、高確率のエントリー ポイントとエグジット ポイントを見つけるように構築されており、すべての取引が M5 タイムフレームと 1M タイムフレーム内で最も成功する可能性が高く実行されるようにします。スキャルピングとスイング ロボットで使用するのに最適なペアは、USTEC、US30、S&P 500、Gbpusd です。このロボットは、スキャルピング メソッド/スイング メソッドを好み、チャートを手動で監視することなく急速な価格変動を利用したいトレーダーに最適です。自動化ソリューションを探している初心者と、グリッドを使用して取引の精度と効率を求める経験豊富なトレーダーの両方に適しています。インデックス スナイパー ロボットは、月曜日から金曜日まで毎日ポジションを開き、すべてのポジションはテイク プロフィットとストップ ロス、および追加のセキュリティ (最大 dd%) で保護されています。このロボットを使用すると、アカウントからキャッシュバック (多くの Web サイトでオプションが提供され、ブロー
Anemone
Sean Christian Hammond
人工知能(AI)を用いて、生物の目に見える行動パターンを傾向分析に取り込むために作成。 カオス理論は移動平均と出会う。 イソギンチャクに餌を与えるフィルターは、その蔓を伸ばして栄養の海に出し、自分自身を豊かにします。 私は過度に長い説明であなたの時間を無駄にしません、概念はこれらの用語で理解できます。 そのカスタマイズ可能な期間回転移動平均は、あなたが指定した時間入力で、単純、指数、加重、平滑化の間で切り替わります。 ローテーションはセミカオスであり、市場自体によって注入されたランダム性です。 これらのMAを積み重ねると、イソギンチャクのフィルターが巻きひげを環境に伸ばして餌を摂るような効果が得られます。
This robot combines three ways of trading and for all uses the same successful money management. All three ways of trading can be used simultaneously or separately. Auto search and trading SR levels and their breakout. News trading - at a specified time placed pending orders for BUY and SELL. Manual opening trades using buttons in the chart. For these your trades will use the same money management as for automated trading. Is recommended ECN broker with minimal spread and with minimal slip and
トレーダーの皆様、こんにちは。 私の最高の取引ツールを紹介します。 機動部隊 PPAAF モデル T. マルチタイムフレーム 正確なプライスアクションアローフィルタリングされたモデル T。  この取引ツールは、長年さまざまな取引ツールを作成してきた私の最高傑作です。 なぜこの取引ツールが最高で信頼できるのでしょうか?  1. このツールは 6 つのインジケーターを使用します。  ダブル CCI = 高速 CCI x 低速 CCI デュアル ストキャスティクス = 高速ストキャスティクス (高速ストキャスティクス メイン ライン x 高速ストキャスティクス シグナル ライン) & スロー ストキャスティクス (低速ストキャスティクス メイン ライン x 低速ストキャスティクス シグナル ライン)  デュアルMACD = 高速MACD (高速MACDメインライン x 高速MACDシグナルライン) & スローMACD (低速MACDメインライン x 低速MACDシグナルライン) 6 つの移動平均 = MA 1 x MA 2 、MA 3 x MA 4 および
I speak in Hungarian. Magyarul beszélek benne. Első felvétel. https://www.youtube.com/watch?v=FfqvT-i9TPk&feature=youtu.be (Első felvétel. https://www.youtube.com/watch?v=MapbQrJ0uPU&t=9s   Első felvétel. https://www.youtube.com/watch?v=i2id5O1KPrI Második felvétel. https://www.youtube.com/watch?v=Zp2i7QN-IMc Első felvétel. https://www.youtube.com/watch?v=h7UbTWiM-Lw Második felvétel. https://www.youtube.com/watch?v=y54q4Rasf2A&t=1s Harmadik felvétel. https://www.youtube.com/watch?v=13zYjsoe6
***Importanr_1*** USE : All Time Frame M1,M5,M15,M30,H1,H4,D1,W1,MN Lot size , Slippage > 1,000 for BTCUSD and Magic number can be adjusted. XAUUSD (GOLD) ,EURUSD,USDJPY,GBPUSD,AUDUSD,GBPJPY,USDCHF,USDCAD,BTCUSD +++Set Parameter+++ 1.Set Fixed Lot = 0.01  ( Lot size 0.0 = Martingale system ) 2.Set Slippage = 1,000-10,000 ( For XAUUSD,ฺBTCUSD) 3.Set Max Spread =  100-1,000 ( For XAUUSD,ฺBTCUSD) ***Importanr_2*** Forex Trading Warning: Forex trading carries a high level of risk and may not
このプロダクトを購入した人は以下も購入しています
This is a mini version(One pair) of Advanced Detector of Trend Reversal and Continuance known as TrueTrendStarM(TTSm25). It is a sensitive and Predictive indicator of Price Trends for Professional traders. ( WEEKEND DISCOUNT OFF ! )( ATTENTION BUYERS:- PLEASE CONTACT ME FOR HOW BEST TO USE THE INDICATOR FOR MAXIMUM PROFITS )    It detects high odds changes in Price Trend direction long before other indicator detects it. I have been working on it since 2019.    This is possible due to fractal
Magic M2
Tuan Anh Dao
4.5 (8)
------ GOOD LUCK   -----   (Telegram: @MagicBinary) The indicator allows you to trade binary options. T his indicator give high winning ratio with over 20 years of backtesting  The recommended time frame is М1 and the expiration time is 3, 5 minutes. The indicator suitable for Auto and Manual trading. A possible signal is specified as a arrows above/under a candle. You can entry current candle /intrabar or can wait until candle close Arrows are not re-painted Trade sessions: Any/ Rec
もちろんです。以下は、提供いただいたテキストの日本語への翻訳です: MT4用の天文学指標をご紹介します:究極の天体トレーディングコンパニオン トレーディング体験を天空の高みに高める準備はできていますか?私たちの革命的なMT4用の天文学指標をご紹介します。この革新的なツールは、複雑なアルゴリズムの力を借りて、類まれなる天文学的洞察と精密な計算を提供します。 あなたの指先で宇宙の情報を: 宝のような天文学的データが明らかになる包括的なパネルをご覧ください。惑星の地理的/太陽中心座標、太陽と地球の距離、星の大きさ、伸び、星座、黄道座標および赤道座標、さらには水平座標まで、それぞれが綿密に計算され美しく表示されています。指標によって生成される垂直線は時間値に対応し、トレーディングの旅に宇宙の視点を提供します。 惑星のラインと関係: グラフを飾る惑星のラインの魔法を体験し、スケールと角度をカスタマイズできます。直感的なコントロールパネルを介して各惑星のラインの表示を簡単に切り替えることができます。指定された時刻範囲内での合会、六分会、四分会、三分会、対会、逆行の指標で天体の関係の芸術を発見してく
Trade Invest Pro - Boss in the world of cryptocurrency! This indicator is ideal for cryptocurrency trading! Work on Trade Invest Pro took us half a year! But not in vain! Now only accurate signals near support - resistance levels! He showed himself well on timeframes m5 m15 for binary options! Optionally, it can be configured for forex for timeframes m30 and more! Reacts well to news! Doesn't paint! and does not disappear from the schedule! As soon as a red arrow appears, open a deal fo
TRANSACTION SPEEDは、大口注文がいつどこで市場に集積され、その恩恵を受けているかを示す最高品質の指標です。トレンドの変化を非常に早い段階で検知します。インジケーターであると同時にトレーディングシステムでもあります。そのコンセプトはユニークで、驚くほど収益性が高い。 FXでは、ティックボリュームはボリュームと呼ばれ、誤解を招きやすい。実際は、単位時間当たりの価格変動であり、事実上、取引速度(TRANSACTION SPEED)です。 このインジケーターは、FXにおける出来高の概念を完全に見直し、正しい方法で論理的に定義し、このロジックを適用することで、ユニークで正確なトップレベルの収益ツールになります。 スピードが上がれば、それはより大きな関心とそれに対応するエントリーとエグジットのサインです。 使い方は? このインジケーターは、市場の取引スピードを測定・比較するため、まず最初に行うべきことは以下の通りです。 比較を行う期間を選択することです。 通常、15日前が比較の出発点となります。 インジケータに日付を入力して実行する。 30分または1時間のタイムフレームで、
Dark Sniper pointer indicator.  Complete absence of redrawing   The percentage of correct indicator forecasts depends on your settings; the default is period 7 (performed better) The arrow indicates the direction of the next candle and the possible direction of the trend in the future.  Suitable for small timeframes m1 and m5  It is recommended to open transactions from 1 to 2 candles.  The signal appears on the current candle. Open a trade on the next one since the signal is being generat
Risk Reward ratio indicator for MT4  BING Risk Reward indicator is a powerful, basic, very needed tool for every trader. Clearly visualize Open Price , Stop Loss , and Top Profit levels on your graphs with easy-to-see colors and trendlines. Does BING Risk Reward show alerts? Of course! BING Risk Reward Indicator offers all Alerts available for the MT4 platform(Email, Popups, Sound, and Push). It shows alerts on Open Price , Stop Loss , and Top Profit. That way, besides easily seeing what is go
Automatic, live & interactive picture of all trendlines. Assign push, email and sound alerts to the lines of your choice and be informed about price rollback, breakout, rollback after breakout, number of rollbacks, line expiration by double breakout. Correct, drag or delete the lines and interactively tune the line system. https://youtu.be/EJUo9pYiHFA . Chart examples https: //www.mql5.com/en/users/efficientforex Price Interaction Events All events are effective immediately and only after one
サポート と 抵抗レベルインジケーター( Support and resistance )をダウンロードできます。 インジケーターは、水平とトレンドのサポートと抵抗レベルを 表示します 。 インジケーター設定: トレンド( Trends ) トレンド又は水平のサポートと抵抗レベルの表示モード設定 はい( Yes )-トレンドレベルしか表示しない いいえ( No )- 水平 レベルしか表示しない リソース使用( UseResource ) インジケーターに組み込まれているリソースの使用モード設定。 はい( Yes )-商品リソースからのジグザグ( ZigZag )インジケーターを使用すること。 いいえ( No )-ジグザグ( ZigZag )ユーザーインジケーターを使用すること。 履歴バー( HistoryBar ) レベルが表示される履歴バーの数 バー数( CountBar ) 現在のバーを始め、サポートと 抵抗レベル が検索されるバーの数 商品で使用されている ジグザグ ( ZigZag ) インジケーターの設定 : デプス( Depth ) 前の値 より 偏差( Deviatio
The indicator of a Professional Trader is an arrow indicator for predicting the direction of price movement. I have been working on this indicator since 2014. You can use this indicator as your main indicator, use its entry signals, and use it as your only indicator to find entry points. About the product: Recommended TF [H4-D1-W1]   . The indicator predicts the direction of the next candle. Fits a variety of tools; Flexibility in settings for different instruments and intervals through the MO
The [GRAFF] III manual trading system is based on multiple MetaTrader (MT4) indicators. Together, the entire PACK of GRAFF III indicators makes an advanced trading tool. The system consists of over 20 different custom-built indicators which have been carefully selected and tested in the long term to produce strong and efficient trading signals. The particular indicators are based on different mathematical formulas, so the entire system is calibrated to remove false signals from its own indicator
You can fins our other products from link : https://www.mql5.com/en/users/drbastem/seller   Also, you can ask all your questins from email : haskayafx@gmail.com or mobile : +90 530 867 5076 or @MehmetBastem    on telegram application This indicator is used to determine the trend. Standard Osma indicator is used. It has the indicator warning system: beep, e-mail and has three types of alerts, including messages to mobile phone. It shows the best performance on the chart of 5 minutes. When the
You can fins our other products from link : https://www.mql5.com/en/users/drbastem/seller   Also, you can ask all your questins from email : haskayafx@gmail.com or mobile : +90 530 867 5076 or @MehmetBastem    on telegram application This indicator is used to determine the trend. Standard Three Moving Average and ADX indicators are used. It has the indicator warning system (audio, e-mail) and three types of alerts, including messages to mobile phone. It shows the best performance on M5. When
This indicator is used to determine the trend. Standard Three Moving Average and ADX indicators are used. It has the indicator warning system (audio, e-mail) and three types of alerts, including messages to mobile phone. It shows the best performance on M5. When the trend value reaches the value set, the warning system is activated. This indicator works only with Forex symbols. Inputs SoundAlarm = true - Sound Alert Sendmail=true - Send an e-mail in case of a buy or sell signal Sendnotification
You can fins our other products from link : https://www.mql5.com/en/users/drbastem/seller   Also, you can ask all your questins from email : haskayafx@gmail.com or mobile : +90 530 867 5076 or @MehmetBastem    on telegram application This indicator is used to determine the trend. Standard MACD indicator is used. It has the indicator warning system: beep, e-mail and has three types of alerts, including messages to mobile phone. It shows the best performance on the chart of 5 minutes. When the
The Smooth Price technical indicator is used for plotting a smoothed line as close to the price of the financial instrument as possible, and serves to eliminate its noise components. The indicator is part of the Monarch trading system, but here it is presented as an independent technical analysis tool. The indicator is based on the cluster digital filter , which, unlike the ClusterSMA , is applied directly to the price time series. Smooth Price does not redraw (except the very last, zero bar) an
Pan PrizMA CD Phase is an analogue of the МetaТrader 5 indicator , and is an option based on the Pan PrizMA indicator. Details . Averaging by a quadric-quartic polynomial increases the smoothness of lines, adds momentum and rhythm. Extrapolation by the sinusoid function near a constant allows adjusting the delay or lead of signals. The value of the phase - wave status parameter (which is close in meaning to the trigonometric phase or the angle of the radius-vector rotation in the trigonometric p
The Name Green Wall : Arrows hits a lot of TP, by changing the idea of non using SL as something bad, but instead use Small TP and a lot of free Margin and Patience. Use micro TP and a lot of Free Margin with this indicator on Forex. It also can be used with Binary Options. This strategy is intended to be traded Manually. This Indicator runs on Open Bar, arrows will delete when price are against it. The only Indicator Parameter is Alerts true/false, all the rest is included inside the code. Arro
Golden Monowave is monowave indicator, the monowave theory is one of Elliott wave approach and one of most complicate and accurate method. Golden Monowave can shortcut many major steps to identify and describe the monowave. It works on any timeframe and with any trading instrument, including currencies, indices, futures, etc. Input Parameters initial_Bars - set the initial number of bars to calculate. wave_color - select the color of the wave. label_color - select the color of labels. temp_labe
This indicator displays in a separate window the difference between the number of points which increased the price, and the number of points that decreased the price during the time interval specified in the settings. The time interval for calculation is expressed as the number of bars of the chart the indicator is attached to. This approach allows you to evaluate the movement direction (growth or fall) of the instrument's price, the strength of the movement and the size of the movement in point
NostradamusMT4
Andrey Spiridonov
1 (1)
NostradamusMT4 is a powerful indicator from the set of professional trader. The indicator is based on Andrei Spiridonov's original price calculation method (ESTIMATED PRICE) for the current candle price. Advantages The indicator does not redraw. It works on any timeframes. Works with any trading instruments. Perfectly suitable for scalping and trading binary options. Parameters Color - color of the ESTIMATED PRICE FUTURE line. How to work with the indicator The indicator forms the ESTIMATED P
BinaryIndicator is a highly accurate indicator for trading binary options. It shows excellent results in scalping. This indicator is based in multifactor analysis of trend indicators, as well as confirmation oscillators, which in the end gives an increased accuracy of signals. Advantages of the indicator Increased accuracy of signals. Excellent results when trading binary options with a short expiration time from M30 to M1 . It works on any timeframes. Works with any trade symbols. Parameters
FutureTrade
Andrey Spiridonov
3 (2)
FutureTrade is one of the few indicators that predicts the price right on the price chart. The indicator calculation algorithm is based on the fast Fourier transform. Given the oscillatory behavior of the price, the Fourier function predicts its future behavior. The indicator should be attached in the usual way to a chart with the trading instrument specified symbol and with the M15 timeframe. This timeframe is the most optimal for working with any symbols. Once started, the indicator calculates
BinaryScalping is a professional indicator for trading binary options and scalping. The algorithm of the indicator is based on the calculation of pivot points for each time period separately, the location of the price of the trading instrument relative to the pivot points is analyzed and the probability of a trading operation is calculated. The indicator has a built-in filter of trading signals based on the global trend. The indicator is installed in the usual way and works with any trading inst
This is the FXTraderariel PowerTrend . It compute a trendfollowing system based on it own algorithm. It gives you a buy or sell signal based on the trend. It based on the Supertrend, but our Version is not repainting. Furthermoore we added some Improvements and you can get an Arrow, Push or Alert when the trend changes. Depending on the settings it and trading style, it can be used for scalping or long-term trading . The indicator can be used on every time frame , but we advise to use it on H1
This is the complete REX package. It consists of the lite, pro and ULTRA version.  Perfect for beginners and intermediates. REX complete is 100% non repaint. The strategy is based on a mix of different strategies, statistics, including pivot points, oscillators and patterns.  As the trading idea consists of a variety of some classic indicators like Momentum, Williams Percent Range, CCI, Force Index, WPR, DeMarker, CCI, RSI and Stochastic, it is clear that the fundamental indicators have being u
BinaryUniversal is a signal indicator for binary options and Forex. In its work, the indicator uses a complex algorithm for generating signals. Before forming a signal, the indicator analyzes volatility, candlestick patterns, important support and resistance levels. The indicator has the ability to adjust the accuracy of the signals, which makes it possible to apply this indicator for both aggressive and conservative trading. The indicator is set in the usual way, it works on any time period and
The arrows are calculated with: -     2 Parabolic  parameters -     2 ADX parameters -     4 Stochastic parameters We recommend to combine it with Parabolic, ZigZag or Elliot waves indicator. Always trade the trend! If you make sure to draw your trend lines and support/resistance zones you will just have to wait for the signal to appear. Take the trade. For Binary Options it is advisable to set the expiry time to 5-15 min in M1 chart. THIS INDICATOR IS ZERO REPAINT Best assets to trade: - EUR
作者のその他のプロダクト
【V1.00】MTF NRPA 5 RSI RTDがリリースされました! 非再描画矢印リアルタイム ダッシュボード。 さまざまな RSI インジケーターを使用するのにうんざりしていて、それらが不正確であると感じた場合は、このツールを試してください。 通常、時間枠内の OBOS レベルを決定するために RSI を 1 つだけインストールします。 悪いニュースは、さまざまな時間枠の OBOS レベルと傾向を一度に確認できないことです。 それが私がこの取引ツールを開発した理由です。 それは次のように説明されています。 この取引ツールでは、5 つの RSI を使用します。 はい、5つです! デフォルトでは、RSI 1 と RSI 2 を大きな時間枠、つまり M30 に設定します。 RSI 1 と RSI 2 の交差は、M30 タイムフレームでトレンドの変化があることを意味します。 次に、現在の(小さい)時間枠に RSI 3 と RSI 4 を設定します。たとえば、M5 でチャートを開いたとします。 RSI 3 と RSI 4 の交差点は、現在のタイムフレーム (M5) でトレンドの変
【V 1.00】MTF NRPA 5 移動平均RTDがリリースされました! 非再描画矢印リアルタイム ダッシュボード。 最適な移動平均インジケーターをお探しなら、ここが正しいページです。 一般に、2 つの移動平均の交点 (クロスオーバー) が次の価格トレンドの方向を決定するため、2 つの移動平均を設定します。 高速移動平均が低速移動平均と交差し、高速 > 低速の場合、トレンドは上昇しています。 逆に、速い移動平均が遅い移動平均と交差し、速い < 遅い場合、トレンドは下降しています。 2 つの移動平均の欠点は、長期的な傾向が見えないことです。 それが私がこの取引ツールを開発した理由です。 それは次のように説明されています。 この取引ツールでは、5 つの移動平均を使用します。 はい、5つです! デフォルトでは、MA 1 と MA 2 を大きな時間枠 (H1) に設定します。 MA 1 と MA 2 の交差は、上半期の時間枠でトレンドの変化があることを意味します。 次に、現在の時間枠(小さい)に MA 3 と MA 4 を設定します。たとえば、M5 でチャートを開きます。 MA 3
1 つのウィンドウで通貨ペアの複数の時間枠を分析すると、混乱する可能性があります。 複数の時間枠を分析するには、信頼できるインジケーターが必要です。 それらの 1 つは、9TF MACD 曲線を使用しています。 シンプルでありながら信頼性が高く、1 つのインジケーターで 9 つの時間枠すべてをカバーするコードを作成するために、昼夜を問わず取り組んできました。 このインジケーターの利点のいくつかを見てみましょう。 カラフルなヒストグラム。 各時間枠の曲線の色は互いに異なります。 MACDメインラインとシグナルラインの交差を示す矢印。 (注: 最後に表示される矢印は無視してください!) クリティカルレベルライン。 リアルタイム 9TF ダッシュボード モニター。 ある時間枠から別の時間枠に変更しても、9TF ダッシュボード モニターの計算は非常に正確です。 どの曲線が臨界レベルを超えており、どの曲線が臨界レベルを下回っているかを監視します。 メイン MACD がシグナル MACD を上回っているか、またはその逆であるかを曲線で監視します。 メイン MACD とシグナル MACD
1 つのウィンドウで通貨ペアの複数の時間枠を分析すると、混乱する可能性があります。 複数の時間枠を分析するには、信頼できるインジケーターが必要です。 それらの 1 つは 9TF STOCH RSI を使用しています。 シンプルでありながら信頼性が高く、1 つのインジケーターで 9 つの時間枠すべてをカバーするコードを作成するために、昼夜を問わず取り組んできました。 このインジケーターの利点のいくつかを見てみましょう。 カラフルなヒストグラム。 各時間枠の曲線の色は互いに異なります。 STOCHASTICメインラインとシグナルラインの交差を示す矢印。 (注: 最後に表示される矢印は無視してください!) OBOS レベルライン。 リアルタイム 9TF ダッシュボード モニター。 ある時間枠から別の時間枠に変更しても、9TF ダッシュボード モニターの計算は非常に正確です。 どの曲線が買われ過ぎのレベルを上回っており、どの曲線が売られ過ぎのレベルを下回っているかを監視します。 メイン STOCH が信号 STOCH を上回っているか、またはその逆であるかを曲線で監視します。 メイ
Analyzing multiple time frames of a currency pair in one window can make you confused. To analyze multiple time frames, you need reliable indicators. One of them is using 9TF RSI MA . I've been working day and night to create code that is simple but reliable and covers all nine time frames in just one indicator .  Let's look at some of the advantages of this indicator: Colorful histogram . The color of the curve in each timeframe is different from one another.  Arrows indicating the crossing of
Analyzing multiple time frames of a currency pair in one window can make you confused. To analyze multiple time frames, you need reliable indicators. One of them is using 9TF MACD Limited Bar . I've been working day and night to create code that is simple but reliable and covers all nine time frames in just one indicator .  Attention! When first installed, the indicator does not look intact. Changing the timeframe will solve the problem. Let's look at some of the advantages of this indicator: C
Analyzing multiple time frames of a currency pair in one window can make you confused. To analyze multiple time frames, you need reliable indicators. One of them is using 9TF STOCH RSI LIMITED BAR . I've been working day and night to create code that is simple but reliable and covers all nine time frames in just one indicator .  Attention! When first installed, the indicator does not look intact. Changing the timeframe will solve the problem. Let's look at some of the advantages of this indicat
1 つのウィンドウで通貨ペアの複数の時間枠を分析すると、混乱する可能性があります。 複数の時間枠を分析するには、信頼できるインジケーターが必要です。 そのうちの1つが9TF Double RSI Double MAを使用しています。 シンプルでありながら信頼性が高く、1 つのインジケーターで 9 つの時間枠すべてをカバーするコードを作成するために、昼夜を問わず取り組んできました。 このインジケーターの利点のいくつかを見てみましょう。 RSI を 2 倍にします。つまり、RSI が速く、RSI が遅くなります。 MA を 2 倍にします。つまり、MA が速くなり、MA が遅くなります。 10配色。 各時間枠の曲線の色は互いに異なります。 RSIのOBOSレベルライン。 リアルタイム 9TF ダッシュボード モニター。 ある時間枠から別の時間枠に変更しても、9TF ダッシュボード モニターの計算は非常に正確です。 どの RSI 曲線が買われ過ぎのレベルを上回っており、どの RSI 曲線が売られ過ぎのレベルを下回っているかを監視します。 MA ファスト ラインが MA スロー ラ
1 つのウィンドウで通貨ペアの複数の時間枠を分析すると、混乱する可能性があります。 複数の時間枠を分析するには、信頼できるインジケーターが必要です。 そのうちの1つが9TF Double CCI Double MAを使用しています。 シンプルでありながら信頼性が高く、1 つのインジケーターで 9 つの時間枠すべてをカバーするコードを作成するために、昼夜を問わず取り組んできました。 このインジケーターの利点のいくつかを見てみましょう。 CCI を 2 倍にします。つまり、CCI が速く、CCI が遅くなります。 MA を 2 倍にします。つまり、MA が速くなり、MA が遅くなります。 10配色。 各時間枠の曲線の色は互いに異なります。 CCIのOBOSレベルライン。 リアルタイム 9TF ダッシュボード モニター。 ある時間枠から別の時間枠に変更しても、9TF ダッシュボード モニターの計算は非常に正確です。 どの CCI 曲線が買われ過ぎのレベルを上回っており、どの CCI 曲線が売られ過ぎのレベルを下回っているかを監視します。 MA ファスト ラインが MA スロー ラ
正確な CCI インジケータが利用可能です。 ダッシュボード トレンド バー スマート レベル 9TF ダブル CCI。 Double CCI、つまり Fast CCI と Slow CCI 2 番目の CCI が必要な理由 追加のインジケーターを使用すると、ライブ取引でより説得力が増します 9TF ファスト CCI カーブ 9TF スロー CCI カーブ 9TF リアルタイム CCI 角度 9TF リアルタイム CCI 値 9TF リアルタイム CCI 方向/位相 9TF トレンドバー トレンドバーを計算する新しいアルゴリズム オン/オフボタン。 ワンクリックでインジケータを表示/非表示にするのに非常に便利 リアルタイム 9TF ダッシュボード モニター トレンドバーのみ表示可能 CCI 曲線のみを表示する機能 ダッシュボードのみを表示する機能 表示する CCI 曲線を選択する機能 トレンドの矢印タイプを選択可能 obos ライン スタイルを選択する機能 凡例を表示/非表示にする機能 小節の数を増減する機能 配色レベルを選択する機能 最大 10 個のダッシュボード トレンド バー
正確な RSI インジケーターが利用可能です。 ダッシュボード トレンド バー スマート レベル 9TF ダブル RSI。 ダブルRSI、つまり速いRSIと遅いRSI なぜ2番目のRSIが必要なのですか? 追加のインジケーターを使用すると、ライブ取引でより説得力が増します 9TF 高速 RSI 曲線 9TF スロー RSI カーブ 9TF リアルタイム RSI アングル 9TF リアルタイム RSI 値 9TF リアルタイム RSI 方向/位相 9TF トレンドバー トレンドバーを計算する新しいアルゴリズム オン/オフボタン。 ワンクリックでインジケータを表示/非表示にするのに非常に便利 リアルタイム 9TF ダッシュボード モニター トレンドバーのみ表示可能 RSI 曲線のみを表示する機能 ダッシュボードのみを表示する機能 表示するRSI曲線を選択する機能 トレンドの矢印タイプを選択可能 obos ライン スタイルを選択する機能 凡例を表示/非表示にする機能 小節の数を増減する機能 配色レベルを選択する機能 最大 10 個のダッシュボード トレンド バーの配色を選択する機能 RS
正確な MACD インジケーターが利用可能です。 ダッシュボード トレンド バー スマート レベル 9TF ダブル MACD。 デュアル MACD、つまり高速 (MACD 1) と低速 (MACD 2) 2 つ目の MACD が必要な理由 追加のインジケーターを使用すると、ライブ取引でより説得力が増します 9TF ファースト MACD 1 カーブ 9TF 遅い MACD 2 カーブ 9TF リアルタイム MACD 角度 9TF リアルタイム MACD 値 9TF リアルタイム MACD 方向正確な MACD インジケーターが利用可能です。 ダッシュボード トレンド バー スマート レベル 9TF ダブル MACD。 デュアル MACD、つまり高速 (MACD 1) と低速 (MACD 2) 2 つ目の MACD が必要な理由 追加のインジケーターを使用すると、ライブ取引でより説得力が増します 9TF ファースト MACD 1 カーブ 9TF 遅い MACD 2 カーブ 9TF リアルタイム MACD 角度 9TF リアルタイム MACD 値 9TF リアルタイム MACD 方向/
正確な確率指標が利用可能です。 ダッシュボード トレンド バー スマート レベル 9TF デュアル ストキャスティクス。 デュアル ストキャスティクス、つまりファスト ストキャスティクスとスロー ストキャスティクス セカンド ストキャスティクスが必要な理由 追加のインジケーターを使用すると、ライブ取引でより説得力が増します 9TF 高速確率曲線 9TF スロー ストキャスティクス カーブ 9TF リアルタイム確率角 9TFリアルタイム確率値 9TF リアルタイム確率的方向/位相 9TF トレンドバー トレンドバーを計算する新しいアルゴリズム オン/オフボタン。 ワンクリックでインジケータを表示/非表示にするのに非常に便利 リアルタイム 9TF ダッシュボード モニター トレンドバーのみ表示可能 確率曲線のみを表示する機能 ダッシュボードのみを表示する機能 表示する確率曲線を選択する機能 トレンドの矢印タイプを選択可能 obos ライン スタイルを選択する機能 凡例を表示/非表示にする機能 バーの数を増減する機能 配色レベルを選択する機能 最大 10 個のダッシュボード トレンド バ
Introducing the advanced trading tools of 2023. MTF PPAAF Model S. This is sub window version of my best trading tool : MTF Precise Price Action Arrow Filtered.  Click here to learn more about MTF PPAAF . This trading tool is equipped with various powerful features : MTF = Multi Time Frame = Time Frame can be changed. On/off button. Non Repaint Arrows.  Customizable parameter, color etc.  Can show all time frame (ATF) crossover arrows of fast stochastic main line & fast stochastic signal line (
If you are curious about the position of the stochastic, RSI, CCI curve, whether it is at the OBOS level or not, then this trading tool is for you. Introducing the advanced trading tools of 2024. ATF Trend Following Trend Bar OBOS. This indicator is similar to MTF PPAAF Model S but have two layers.  Click here to learn more about MTF PPAAFS . This trading tool is equipped with various powerful features : MTF = Multi Time Frame = Time Frame can be changed. On/off button. Customizable parameter,
トレーダーの皆様、こんにちは。 私の最高の取引ツールを紹介します。 機動部隊 PPAAF モデル T. マルチタイムフレーム 正確なプライスアクションアローフィルタリングされたモデル T。  この取引ツールは、長年さまざまな取引ツールを作成してきた私の最高傑作です。 なぜこの取引ツールが最高で信頼できるのでしょうか?  1. このツールは 6 つのインジケーターを使用します。  ダブル CCI = 高速 CCI x 低速 CCI デュアル ストキャスティクス = 高速ストキャスティクス (高速ストキャスティクス メイン ライン x 高速ストキャスティクス シグナル ライン) & スロー ストキャスティクス (低速ストキャスティクス メイン ライン x 低速ストキャスティクス シグナル ライン)  デュアルMACD = 高速MACD (高速MACDメインライン x 高速MACDシグナルライン) & スローMACD (低速MACDメインライン x 低速MACDシグナルライン) 6 つの移動平均 = MA 1 x MA 2 、MA 3 x MA 4 および
この取引ツールを使用すると、15 の市場を同時にスキャンできます。 新しい取引指標 2024 のご紹介: ️ ダッシュボード マルチ通貨 マルチタイムフレーム 確率的。 私がこの取引ツールを作成した理由は少なくとも 2 つあります。 まず、1 つの市場だけを観察することに飽きました。 次に、別の市場への参入の瞬間を逃したくないです。 だからこそ、他の市況も同時に知りたいのです。 このため、複数の市場の状況を同時にスキャンできるスキャナーが必要です。 私は確率的メインライン > (または <=) 確率的シグナルラインが M1 から H4 (または単に M1 から M30) で始まる市場をよく探します。 私の分析に同意するなら、これがあなたが探していた取引指標です。 市況が上記の要件を満たす瞬間を見逃さないでください。 これは、多くの優れた機能を備えたストキャスティックのスキャナーまたはダッシュボードです。 確率的メインラインのデータを表示可能 確率シグナルラインのデータを表示可能 確率的メインラインとシグナルラインの位置を表示可能(シグナルラインの上のメインライ
この取引ツールを使用すると、15の市場を同時にスキャンできます。 新しい取引インジケーター2024のご紹介: ️ダッシュボード マルチ通貨 マルチタイムフレーム ダブルCCI。 この取引ツールを作成した理由は少なくとも2つあります。 まず、1つの市場だけを観察することに飽き飽きしています。 次に、別の市場でのエントリーの瞬間を失いたくないのです。 そのため、同時に他の市場の状況を知りたいのです。 このため、複数の市場の状況を同時にスキャンできるスキャナーが必要です。 私は、高速CCIライン> (または<=) 低速CCIラインがM1からH4 (またはM1からM30のみ) から始まる市場をよく探します。 私の分析に同意するなら、これはあなたが探していた取引インジケーターです。 市場の状況が上記の要件を満たす瞬間を逃さないでください。 これは、多くの優れた機能を備えたストキャスティクスのスキャナーまたはダッシュボードです。 高速 CCI ラインのデータを表示できます 低速 CCI ラインのデータを表示できます 高速 CCI ラインと低速 CCI ラインの位置を表示
この取引ツールを使用すると、15 の市場を同時にスキャンできます。 新しい取引指標 2024 のご紹介: ️ ダッシュボードのマルチ通貨マルチタイムフレームダブルRSI。 私がこの取引ツールを作成した理由は少なくとも 2 つあります。 まず、1 つの市場だけを観察することに飽きました。 次に、別の市場への参入の瞬間を逃したくないです。 だからこそ、他の市況も同時に知りたいのです。 このため、複数の市場の状況を同時にスキャンできるスキャナーが必要です。 私は、高速 RSI ライン > (または <=) 低速 RSI ラインが M1 から H4 (または単に M1 から M30) で始まる市場をよく探します。 また、M1 から M30 まで売られすぎ/買われすぎの市場をよく探します。 私の分析に同意するなら、これがあなたが探していた取引指標です。 市況が上記の要件を満たす瞬間を見逃さないでください。 これは、多くの優れた機能を備えたストキャスティックのスキャナーまたはダッシュボードです。 高速RSIラインのデータを表示可能 遅いRSIラインのデータも表示可能 高
フィルタ:
レビューなし
レビューに返信
バージョン 6.10 2025.04.17
In this new Version V 6.10 :
- Minor changes
バージョン 6.0 2025.04.14
In this new Version V 6.00 :
- Adding arrow angle STF (the default is TF M15)
- Customizing arrow distance of Belt Trend
- Customizing digit and color of angle value MA
- Adding timeframe and calculation mode for arrow trend following (setting H4)
- Optimization
バージョン 5.90 2025.03.26
In this new Version V 5.90 :
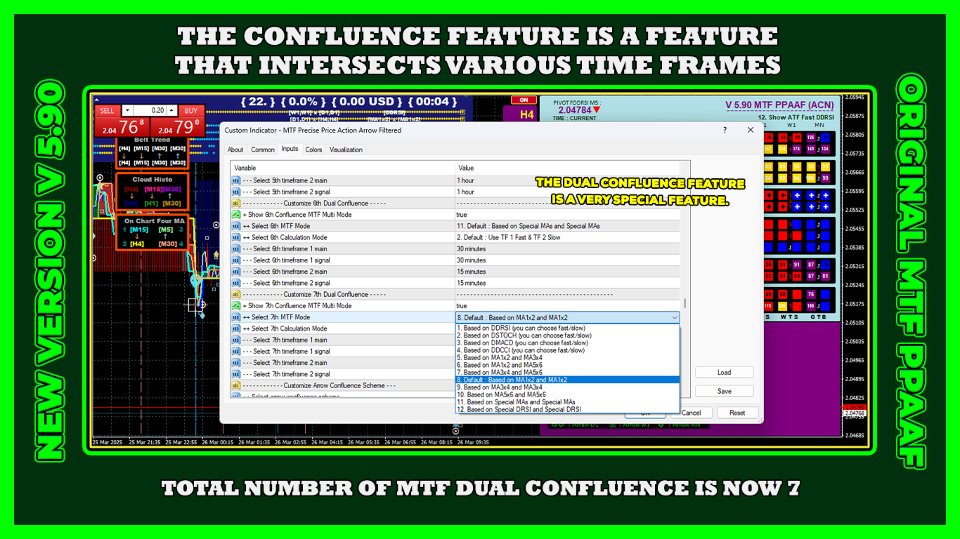
- Total number of trend bar MTF Dual Confluence Multi Mode is now 7
バージョン 5.80 2025.03.18
In this new Version V 5.80 :
- Adding special MAs & special DRSI
- Optimizes performance when installed with the best combo MTF PPAAF Model T
- Quint MTF Dual Confluence Multi Mode
バージョン 5.70 2025.01.31
In this new Version V 5.70 :
- New algo of status per TF
- Customizing arrow Trend Bar 9TF RSIMA CCIMA
- Adding triple confluence of MA1x2, MA3x4, MA5x6
- Adding new mode to dual pivot ATF
バージョン 5.60 2025.01.15
In this new Version V 5.60 :
- Adding single line feature for on chart four MA
- Adding arrow angle RSI CCI scheme
バージョン 5.50 2024.12.31
In this new Version V 5.50 :
- Adding Another On Chart Four MA feature
- Adding MTF Angle RSI CCI feature
- New algo Dual Pivot ATF
バージョン 5.40 2024.12.18
In this new Version V 5.40 :
- Fixing trading in the zone (TITZ)
- TITZ applied to pivot horizontal line and vertical line
- Customizing on chart four MA feature
バージョン 5.30 2024.11.28
In this new Version V 5.30 :
- Fixing belt trend arrows
- Adding belt trend calculation mode
バージョン 5.20 2024.11.20
In this new Version V 5.20 :
- Adding calculation mode for trading in the zone (vertical and horizontal)
- Adding Trend Bar 9TF RSIMA CCIMA (complete!)
バージョン 5.10 2024.09.20
In this new Version V 5.10 :
- Adding Trend Bar 3TF RSIMA CCIMA arrows scheme
バージョン 5.0 2024.09.10
In this new Version V 5.00 :
- Replay system applicable to Dual Pivot ATF
- Adding display type to Dual Pivot ATF
バージョン 4.90 2024.08.26
In this new Version V 4.90 :
- Adding Dual Double CCI
- Adding DCCI calculation mode
バージョン 4.80 2024.08.13
In this new Version V 4.80 :
- Deconstruct from the beginning
- Adding CCIMA indicator
- Adding triple MTF cloud histo
- Adding triple MTF confluence multi mode
- Adding trend bar 3TF RSIMA/CCIMA
- Adding dual pivot all time frame
- Adding color level scheme
- Customizing on chart feature
- Optimizing the loading time
バージョン 4.70 2024.04.03
In this new Version V 4.70 :
- Fixing pivot value horizontal line trading in the zone
- Customizing Dual MTF Cloud Histo
バージョン 4.60 2024.03.29
In this new Version V 4.60 :
- Changing MTF Belt Trend to Dual MTF Belt Trend
- Adding trend following feature to MTF Belt Trend
- Adding time frame scheme True RSIMA
- Customizing On Chart Dual DRSI
- Customizing On Chart Dual Stochastic
- Customizing On Chart True RSIMA
バージョン 4.50 2024.03.18
In this new Version V 4.50 :

- Deleting Super Trend Arrows (only dashboard available with lines and trend bar) to optimize the rendering time
- Deleting Trend Bar 3TF of SRCM (Stoch,RSI,CCI,MACD)
- Deleting Trend Bar 3TF of MA5 x MA6
- Deleting confluence 3TF of Stochastic
- Deleting confluence 3TF of MACD
- Deleting confluence 3TF of MA1 x MA2
- Deleting confluence 3TF of DRSI
- Deleting confluence Dual Stoch
- Deleting confluence Dual MACD
- Adding MTF Belt Trend
- Adding Dual MTF Cloud Histo
- Adding 3TF True RSIMA lines
- Adding 3TF True RSIMA trend bar
- Adding 3TF True RSIMA dashboard
- Adding horizontal line trading in the zone
- Adding pivot value horizontal line trading in the zone
- Fixing vertical lines trading in the zone
- Total mode right now is 13 (previously 9)
バージョン 4.40 2024.02.02
In this new Version V 4.40 :
- Adding trend bar feature of True RSIMA
- Adding dashboard feature of True RSIMA
- Adding vertical lines feature of trading in the zone
- Adding current time and broker time feature
- Modifying trend bar 3 time frame
- Fixing dashboard monitor position
- Fixing price index location
バージョン 4.30 2024.01.25
In this new Version V 4.30 :
- Fixing histogram of MTF Belt Trend
バージョン 4.20 2024.01.25
In this new Version V 4.20 :
- Fixing OBOS level of ATF dashboard
- Adding calculation mode of TB TRD FOL 3TF, i.e DCCI and FDMACD
- Adding histogram to MTF belt trend
バージョン 4.10 2024.01.10
In this new Version V 4.10 :
- Fixing ATF Stochastic and ATF MACD
- Fixing algorithm of confluence 3TF
- Fixing algorithm of STF Dual Stochastic and Dual MACD
バージョン 4.0 2024.01.03
In this new Version 4.00 :
- Adding background color to trend bar 3TF
- Adding Mode 8 : Show ATF MA 1x2 DRSI
- Adding timeframe scheme of trading in the zone
- Adding timeframe scheme of trend following STF
- Adding timeframe scheme of trend bar trend following 3TF
- Fixing dashboard of RSIMA
バージョン 3.90 2023.12.22
In this new Version 3.90 :
- Deleting favorite arrows
- Adding MTF Trendbar Trend Following 3 Time Frame FDSTOCH/DRSI
- Adding MTF Trendbar Average 3 Time Frame FDSTOCH/DRSI
- Adding MTF Trendbar Trend Following 3 Time Frame MA5 x MA6
- Adding MTF Trendbar Average 3 Time Frame MA5 x MA6
- Fixing status quo of trading in the zone
バージョン 3.80 2023.11.20
In this new version V 3.80 :
- I fixed the 1 minute RSIMA dashboard
- I limited the number of favorite arrow mode to three
バージョン 3.70 2023.11.16
In this new version V 3.70 :
- I fixed the RSIMA dashboard
- I added favorite arrow calculation modes
バージョン 3.60 2023.11.13
In this new version V 3.60 :
- I added favorite arrow feature
- I set up trading in the zone interface
- I added W1 timeframe scheme for trend following STF arrows
バージョン 3.50 2023.11.06
In this new version V 3.50 :
- I changed the symbol for MACD above zero and MACD below zero level.
- I changed the code of square STF trend following.
バージョン 3.40 2023.10.30
In this new Version 3.40 :
- I limited the number of candle high time frame
- I added arrow size option to trend following STF arrows
バージョン 3.30 2023.10.25
In this new Version 3.30 :
- I fixed the on off button sound
- I added trend bar 9TF of STA mode 2 from current time frame (0) to previous 5 bar ago (5)
- I fixed on chart dual stochastic channel
- I fixed dashboard position
- I modified algorithm in STA mode 1 & mode 2
- I added time frame scheme for trend following STF
バージョン 3.20 2023.10.19
In this new Version 3.20 :
- I changed the dashboard font so it looks clear
バージョン 3.10 2023.09.25
In this new Version 3.10 :
- Reduce total mode to only 8, i.e show all time frame crossover arrows and trading in the zone
- Modifying parameter setting
- Can show all time frame crossover arrows of fast CCI and slow CCI, i.e DCCI
- Modify the status for mode 8
- Can show trend following selected time frame of fast stochastic, RSI 1x2, CCI 1x2, fast macd and RSIxMA outside the modes.
バージョン 3.0 2023.09.06
In this new Version 3.00 :
- Modifying STA algorithm both for calculation mode 1 and mode 2
- Modifying dashboard color scheme
- Modifying parameter setting
バージョン 2.90 2023.09.04
In this new Version 2.90, I added new features :
- Adding Mode 29 : Show ATF Fast Stoch DRSI. With this feature monitoring all time frame arrows of stochastic and RSI is easy.
- Adding STA Calculation Mode. The first mode is based on crossover of RSI & MA and the second mode is based on crossover of fast RSI & slow RSI.
バージョン 2.80 2023.08.30
In this new Version 2.80, I added new feature :
- Adding Time Spread Profit Info (TSPI) indicator
バージョン 2.70 2023.08.21
In this new Version 2.70, I make monitoring visually Stoch RSI easy :
- Modifying on chart dual stochastic
- Modifying on chart double rsi
- Modifying on chart rsioma
- Modifying color level
バージョン 2.60 2023.08.13
In this new Version 2.60, I added new feature :
- Adding STF belt trend
- Fixing on chart range
- Changing arrow code DRSI and DCCI
バージョン 2.50 2023.07.31
In this new Version 2.50, I added new feature :
- Adding confluence of 3TF MA 1x2
- Changing arrow code for trend following double CCI
- Changing arrow code for trend following double RSI
バージョン 2.40 2023.07.25
In this new Version 2.40, I added new features :
- Adding confluence of 3TF Fast DSTOCH
- adding confluence of 3TF Fast DMACD
- Adding trend following STF of DRSI
- Adding STA monitor, i.e (from top to bottom) H1,H4,D1,W1,MN1
バージョン 2.30 2023.07.18
In this new Version 2.30, I added new features :
- Added mode 28 : show trading in the zone
- Added 9TF double CCI dashboard monitor
- Added selected timeframe of double CCI crossover arrows
- Added STA monthly arrows
- Added three new dashboard color scheme
- Fixing STA, dual stochastic & dual MACD algorithm
バージョン 2.20 2023.07.11
In this new Version 2.20, I added new features :
- Added upper bound 100 & lower bound 0 for on chart dual stochastic
- Added upper bound 100 & lower bound 0 for on chart double rsi
- Fixing trading in the zone four MA
- Added timeframe scheme for four MA
- Fixing RSIMA dashboard
バージョン 2.10 2023.07.04
In this new Version 2.10 :
- Fixing DRSI arrow TF MN1
- Fixing color super trend arrows
- Fixing arrow MA 3 x MA 4
- Added timeframe scheme D1,W1,MN1 for conflux DRSI
バージョン 2.0 2023.07.03
In this new Version 2.00, I added new features :
- Added confluence arrows of 3 timeframe double RSI
- Added 12 timeframe scheme to choose from for confluence of double RSI
- Fixing algorithm for trend following dual stoch and dual macd
バージョン 1.90 2023.06.26
In this new Version 1.90, I added new features :
- Added super trend arrows higher timeframe
- Added MACD above or below zero level into dashboard
- Fixing MTF feature
バージョン 1.80 2023.06.20
In this new Version 1.80, I've made a lot of changes :
- Change the appearance of the dashboard from a circle to a square shape.
- Fixing color OBOS of slow stochastic and slow drsi.
- Added feature on chart slow stochastic.
- Added feature pivot value of all time frame of Fast Stoch.
- Added feature pivot value of all time frame of Fast MACD.
- Added feature pivot value of all time frame of MA 1,2.
- Added feature pivot value of all time frame of Double RSI.
- Added feature pivot value of all time frame of RSIMA.
- Added feature MTF candle high time frame.
- Ability to change/shift the starting time to monitor in real time 9TF dashboard.
バージョン 1.70 2023.06.02
In this new Version 1.70, I've added the ability to monitor visually :
- On chart stochastic makes it easy for us to observe the movement of stochastic main line and stochastic signal line along the OBOS channel.
- On chart four MA makes it easy for us to observe the movement of MA 1 cross MA 2 and MA 3 cross MA 4.
- On chart double RSI makes it easy for us to observe the movement of RSI fast line and RSI slow line along the OBOS channel.
- On chart true RSIMA makes it easy for us to observe the movement of RSI line and MA line along the OBOS channel.
This on chart double RSI or on chart true RSIMA will make monitoring RSI divergence much more accurate than installing RSIMA on sub window.
And also I changed the appearance of the 10 dashboard color scheme to be more attractive.
バージョン 1.60 2023.05.23
In this new Version 1.60, I've made trading in the zone much more easy :
- Added four MA dashboard monitor (not just two MA!)
- Added four MA lines on chart (by default : MA 1x2 on current timeframe and MA 3x4 on M30)
- Customizable four MA lines
- Button can be located on sub window
バージョン 1.50 2023.05.03
In this new Version 1.50, I've made a lot of reconstruction :
- Total mode up to 27
- New feature : Show Trend Following ATF TWOMA Filtered By Trend Following Selected TF of FAST STOCH
- New feature : Show Trend Following ATF TWOMA Filtered By Trend Following Selected TF of FAST MACD
- New feature : Show Trend Following ATF TWOMA Filtered By Trend Following Selected TF of DRSI
- New feature : Show Trend Following ATF TWOMA Filtered By Trend Following Selected TF of RSIMA
- Trend following = non repaint arrows!
- Fixing algorithm of button
- Adding color level type
バージョン 1.40 2023.04.11
In this new Version 1.40, I've made a lot of reconstruction :
- Total mode up to 23
- New feature : Show Trend Following All Timeframe of Two MA
- New feature : Show Trend Following All Timeframe of Double RSI
- New feature : Show Trend Following All Timeframe of RSIMA
- New feature : Show Trend Following Selected Timeframe of Two MA
- New feature : Show Trend Following Selected Timeframe of Double RSI
- New feature : Show Trend Following Selected Timeframe of RSIMA
- New feature : Show Trend Following Selected Timeframe of Dual Stoch
- New feature : Show Trend Following Selected Timeframe of Dual MACD
- Trend following = non repaint arrows!
- Fixing algorithm of mode 21 : Show Selected TF of STOCH,MACD,TWOMA,DRSI Filtered By Trend Following RSIMA
- Parameter values can be hide/show
バージョン 1.30 2023.03.30
In this new Version 1.30, I've made a lot of reconstruction :
- Added dual stochastics dashboard monitor (fast stoch = stochastic 1 and slow stoch = stochastic 2)
- Added dual macd dashboard monitor (fast macd = macd 1 and slow macd = macd 2)
- Fixing MA Phase of RSIMA
- Change arrow code
- New feature : showing trend following arrows of stochastics and macd
- Dashboard monitor can be hide
バージョン 1.20 2023.03.12
In this new Version 1.20, I've made a lot of reconstruction :
- Fixing daily arrow of MACD
- Fixing arrow of RSIMA
- New algo in determining the up and down arrows
- New feature : showing arrows of Stochastic, MACD, Two MA and RSIMA at once
- Adding the RSIMA 9TF dashboard monitor
- Beautify the dashboard monitor
バージョン 1.10 2023.02.27
New version 1.10 with new feature available:
- Adding the ability to filter price action by all time frame (ATF) Two Moving Average
- Adding the ability to filter price action by all time frame (ATF) Double RSI
- Adding the value of Stochastic on all time frame
- Adding the value of CCI on all time frame