• Panoramica
  • Recensioni
  • Commenti
  • Novità

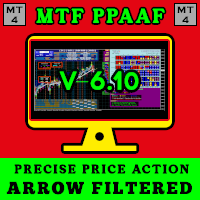
MTF Precise Price Action Arrow Filtered

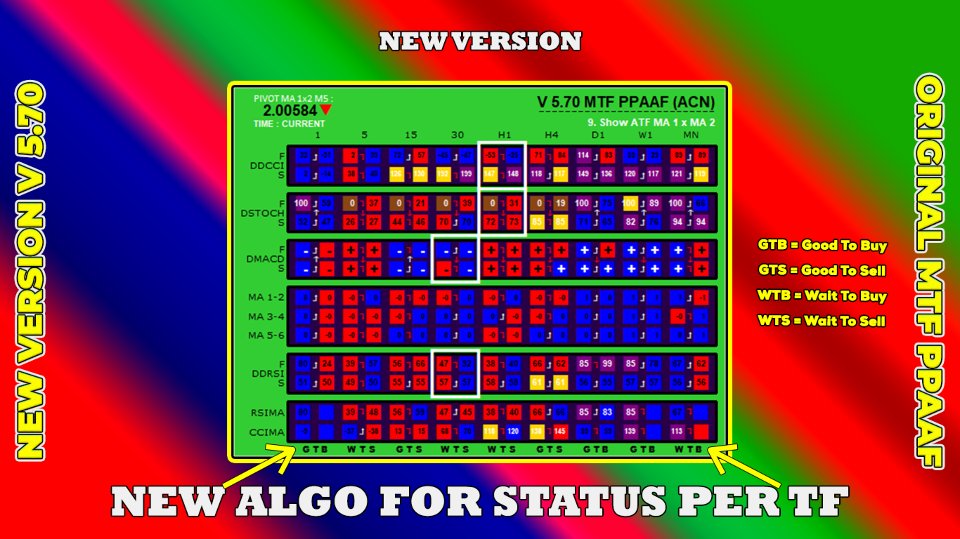
Se perdi spesso operazioni perché utilizzi un solo indicatore, prova questo strumento di trading. Questo strumento di trading utilizza più di un indicatore. Osservo spesso i trader che utilizzano solo l'indicatore RSI. Molto spesso il mercato è ipervenduto ma ancora in ribasso oppure il mercato è ipercomprato ma ancora in rialzo. Per questo motivo è necessario utilizzare più di un indicatore. Presentazione della nuova versione V 3.40 MTF PPAAF: freccia di azione del prezzo precisa su più intervalli di tempo filtrata. Questo strumento di trading utilizza vari indicatori per rafforzare la direzione del movimento del mercato.

Il primo indicatore utilizzato in questo strumento di trading è il Dual Stochastic. Qui utilizzo due stocastici, vale a dire Stocastico veloce e Stocastico lento. Nel Fast Stochastic c'è una linea principale Fast Stochastic e una linea di segnale Fast Stochastic. Allo stesso modo, nello Stocastico Lento c'è una linea principale Stocastico Lento e una linea di segnale Stocastico Lento. L'intersezione/incrocio della linea principale e della linea del segnale formerà frecce su e giù.

Il secondo indicatore è Double RSI, ovvero RSI veloce e RSI lento. L'intersezione dei due formerà una freccia su e giù.

Il terzo indicatore è il Double CCI, ovvero CCI veloce e CCI lento. L'intersezione dei due formerà una freccia su e giù.

Il quarto indicatore è Dual MACD. Simile al doppio stocastico, qui ci sono MACD veloce e MACD lento. In Fast MACD è presente una linea principale Fast MACD e una linea di segnale Fast MACD. Allo stesso modo, nel MACD lento c'è una linea principale del MACD lento e una linea di segnale del MACD lento. L'intersezione della linea principale e della linea del segnale formerà delle frecce su e giù.

Il quinto indicatore è RSIMA. Come suggerisce il nome, qui le frecce su e giù sono determinate dall'intersezione della linea RSI con la linea della media mobile (MA). Se RSI > MA la freccia è rivolta verso l'alto e viceversa.

Il sesto indicatore è il Four MA. Qui utilizzo quattro linee di media mobile, ovvero MA 1,2,3,4. L'intersezione della linea MA 1 con MA 2 e della linea MA 3 con MA 4 formerà frecce su e giù.

Sulla base dei risultati della mia ricerca, molti trader perdono perché utilizzano un solo indicatore. Ecco perché ho creato questo strumento di trading. I sei indicatori che ho spiegato sopra rafforzeranno la direzione del movimento del mercato.

Poi, per vedere i movimenti del mercato in tempo reale, ho aggiunto varie funzionalità TOP:

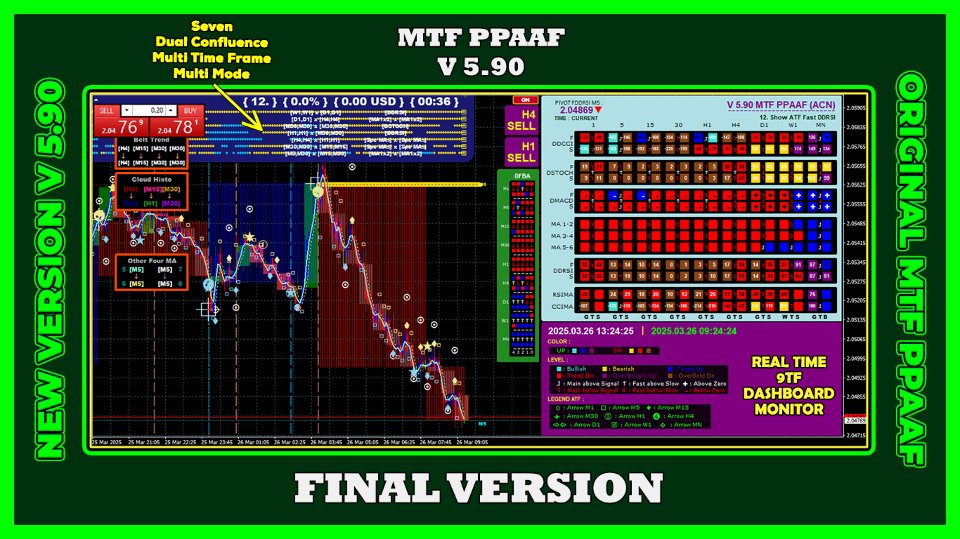
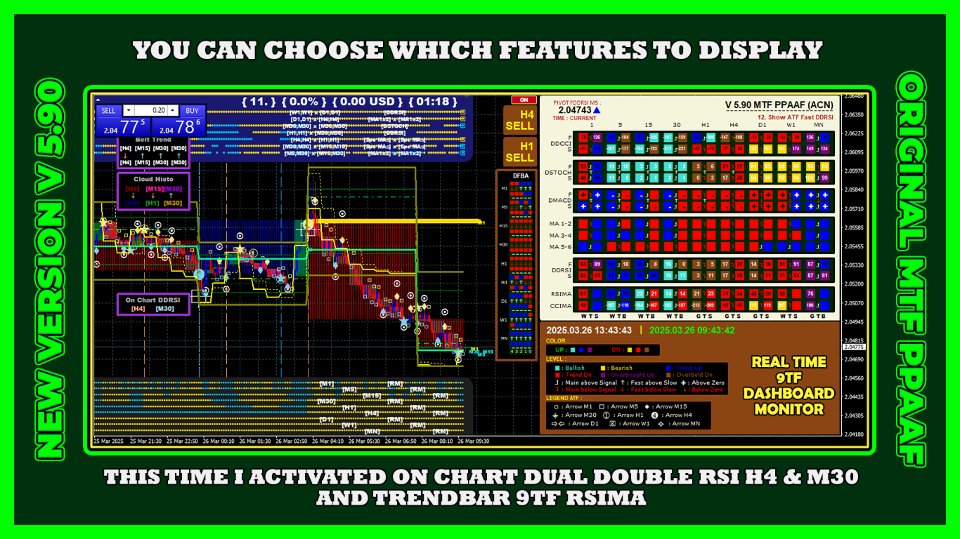
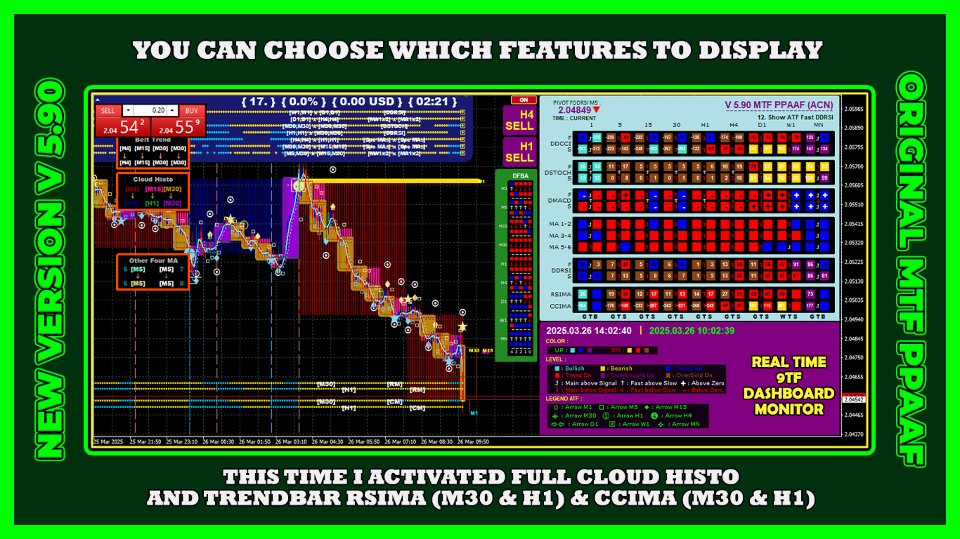
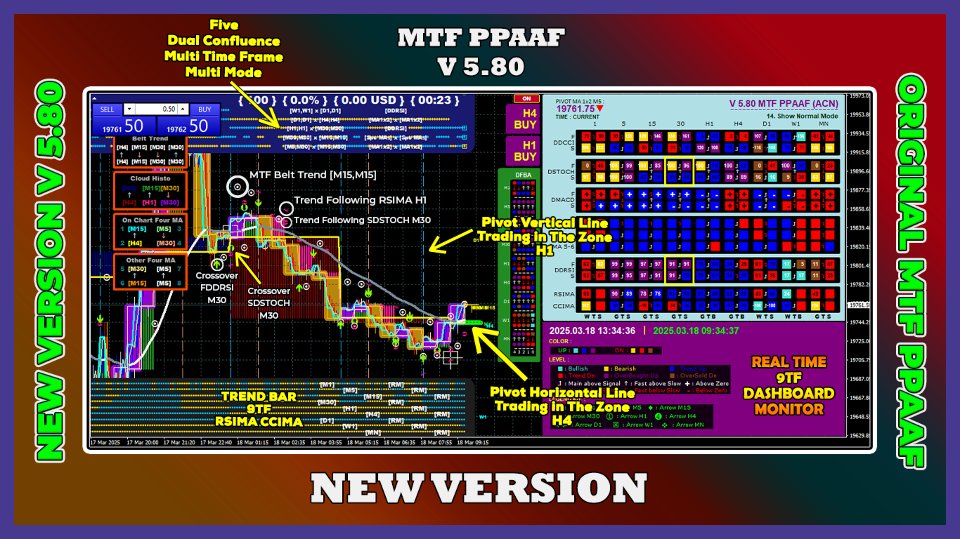
1. Monitor dashboard 9TF in tempo reale. Con questa funzione, vedrai i movimenti del mercato in tempo reale a partire dall'intervallo di tempo di 1 minuto fino all'intervallo di tempo MN1. Nella dashboard potrai vedere se la linea principale è maggiore della linea del segnale o meno, se la linea RSI veloce è maggiore della linea RSI lenta o meno, se la linea RSI è tutta attiva o meno, ecc. può anche vedere se i livelli stocastico, RSI e CCI sono ipercomprati o ipervenduti. Conoscere il livello OBOS (ipercomprato e ipervenduto) è molto importante.

2. Sulle caratteristiche della carta. Il monitoraggio visivo è importante. Per questo motivo, ho aggiunto le funzionalità Doppio stocastico sul grafico, Quattro MA sul grafico, Doppio RSI sul grafico e True RSIMA sul grafico. Per tua informazione, posizionare gli stocastici nella finestra del grafico è più accurato che posizionarli nella finestra secondaria. Osservare l'intersezione della linea principale e della linea del segnale in tempo reale nella finestra del grafico ti renderà sicuro nel determinare i punti di ingresso e di uscita. Il mio principio è comprare basso, vendere alto. Per favore, ricordate questo principio.

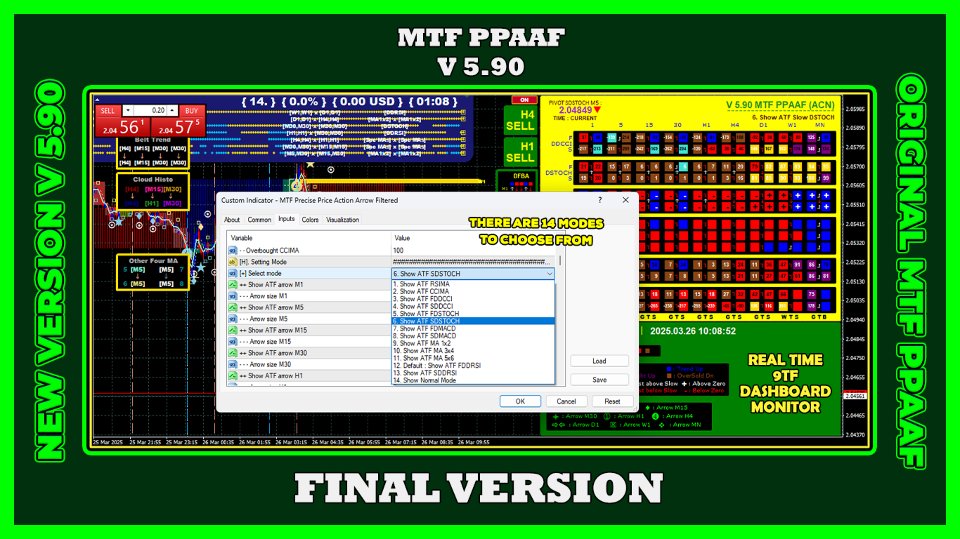
3. Questo strumento di trading può visualizzare le frecce crossover ATF (tutti i tempi):

- Mostra ATF Stocastico veloce (modalità 1), ovvero la linea principale stocastica veloce x la linea del segnale stocastico veloce

- Mostra ATF Fast MACD (modalità 2), ovvero la linea principale Fast MACD x la linea di segnale Fast MACD

- Mostra ATF MA 1x2 (modalità 3), ovvero media mobile 1 x media mobile 2

- Mostra ATF DRSI (modalità 4), ovvero Fast RSI x Slow RSI

- Mostra ATF RSIMA (modalità 5), ovvero RSI x MA

- Mostra ATF DCCI (modalità 6), ovvero Fast CCI x Slow CCI

- Mostra ATF Fast stocastico DRSI (modalità 7), vale a dire la linea principale stocastica veloce x la linea del segnale stocastico veloce insieme a RSI veloce x RSI lento

- Trading nella zona (modalità 8), ovvero l'intersezione della linea MA 1 con MA 2 e della linea MA 3 con MA 4.

4. Frecce di super trend (STA). Esistono due modalità di calcolo STA. Il primo è STA basato sul crossover di RSI e MA. E il secondo è il crossover di Fast RSI con Slow RSI.

5. Trend Following STF (intervallo di tempo selezionato). Qui potete scegliere l'intervallo di tempo secondo i vostri desideri. Se due linee si incrociano, appare una freccia. Inoltre, la freccia che segue la tendenza apparirà se gli angoli delle due linee sono tutti positivi (SU) o tutti negativi (Giù).

6. Funzionalità della barra di tendenza 9TF basata sulla modalità STA 2. È possibile osservare cinque barre di tendenza.

La barra di tendenza più a destra è l'ultima barra di tendenza in tempo reale (0). Seguito dalla barra di tendenza precedente (1,2,3,4). Questa barra di tendenza è utile per osservare i cambiamenti nella direzione delle tendenze del mercato dall'intervallo di tempo precedente all'intervallo di tempo attuale.

7. Funzionalità dei livelli pivot. Questa funzione ti mostrerà il livello del punto di candela aperto in cui si è verificato il crossover. Livelli pivot ac

t come S&R, ovvero Supporto e Resistenza.


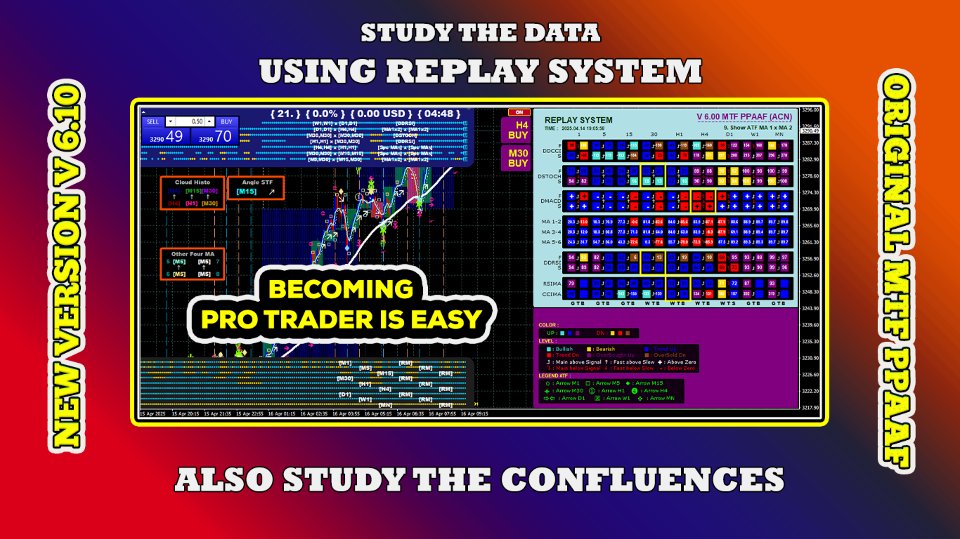
8. Sistema di riproduzione. Con questa funzionalità puoi tornare indietro nel tempo, osservando lo stato del cruscotto 9TF in un determinato giorno e ora. Supponiamo di voler analizzare il motivo per cui alle 14:21:30 del 11.10.2023 il mercato vende. Per utilizzare questa funzione, apri il tuo grafico Meta Trader 4 in un intervallo di tempo inferiore, ad esempio M5.


9. Candela HTF (High Time Frame). Con questa funzione puoi vedere i movimenti del mercato nell'intervallo temporale elevato (ad esempio H1) quando apri il grafico nell'intervallo temporale inferiore (mi piace aprirlo su M5).


10. TSPI (Informazioni sul profitto sulla distribuzione temporale). Con questa funzionalità puoi vedere in tempo reale l'ora corrente, lo spread, il profitto/perdita e la percentuale di profitto/perdita.


11. Funzione pulsante di accensione/spegnimento. Con questa funzione puoi mostrare o nascondere questo strumento di trading con un solo clic. Interessante vero?


12. 20 combinazioni di colori del dashboard tra cui puoi scegliere. Con questa funzione puoi scegliere un colore della dashboard che corrisponda al colore del tuo grafico.


13. Parametro personalizzabile. Tutti i parametri utilizzati nel calcolo degli indicatori possono essere regolati secondo i tuoi desideri. È possibile utilizzare i parametri stocastici 14,3,3 o 5,3,3 ecc. Oppure utilizzare le impostazioni predefinite.


14. MTF, ovvero Multi Time Frame. Puoi impostare un intervallo di tempo secondo i tuoi desideri. Ad esempio, desideri attivare la funzione doppio stocastico sul grafico sugli intervalli di tempo M5 e H1. Puoi!


15. Frecce non ridipinte (NRPA). Se due linee si intersecano in qualsiasi momento, verrà visualizzata la freccia di incrocio. Molto spesso, a causa dell'elevata volatilità, nei secondi e nei minuti successivi le due linee non si intersecano. Di conseguenza, la freccia apparsa prima è scomparsa. Questa è una caratteristica molto importante. Ricorda che durante un'elevata volatilità, la freccia che prima era rivolta verso l'alto può diventare rivolta verso il basso. La freccia apparsa in precedenza potrebbe scomparire in un istante. Ecco perché il mio messaggio è di convalidare utilizzando il monitor dashboard 9TF in tempo reale!


16. Funzionalità 3TF di confluenza, ovvero confluenza stocastica veloce 3TF, confluenza MACD veloce 3TF, confluenza 3TF MA 1x2 e confluenza DRSI 3TF. Con questa funzione, osservare le intersezioni 3TF (tre intervalli temporali) è molto semplice. Ciò significa, ad esempio, se la linea principale stocastica veloce > linea del segnale stocastico veloce nell'intervallo di tempo (M5, M15, M30), apparirà una freccia SU.


17. Confluenza duale Stocastica e confluenza duale MACD. Con questa funzionalità, se nello stocastico veloce e nello stocastico lento c'è una linea principale > linea di segnale allora appare la freccia SU. Allo stesso modo per il doppio MACD. Questa è una caratteristica davvero importante per osservare l'intersezione di due stocastici e due MACD nello stesso intervallo di tempo.


18. Funzionalità della cintura di tendenza. Questa funzionalità si aggiunge alla visualizzazione di due medie mobili sul grafico. Naturalmente puoi impostare un intervallo di tempo secondo i tuoi desideri.


Utilizzare un solo indicatore di trading non è molto convincente. Ecco perché combiniamo diversi indicatori per rafforzare la nostra analisi sulla direzione del mercato.


Il movimento dell'azione dei prezzi può quindi essere filtrato utilizzando uno qualsiasi dei 6 indicatori:


RSIOMA

Doppio MACD (Nuova versione 1.3!)

Doppio Stocastico (Nuova versione 1.3!)

Doppio CCI (Nuova versione 2.3!)

Quattro medie mobili (Nuova versione 1.6! Non solo due ma)

Doppio RSI (Nuova versione 1.2!)

La forza della direzione del movimento dell'azione dei prezzi può quindi essere valutata monitorando il dashboard 9TF in tempo reale.


Il monitor del dashboard 9TF ci mostra i dati in tempo reale di Four Moving Average, RSIMA, Double RSI, Dual MACD, Dual Stochastic e Double CCI.


Pulsante con un clic per mostrare o nascondere l'indicatore

Monitor dashboard in tempo reale 9TF

Monitoraggio della media mobile 9TF Four, ovvero MA 1x2 e MA 3x4

Monitoraggio se la linea MA veloce è sopra o sotto la linea MA lenta

Monitoraggio dell'angolo di MA veloce e MA lenta

Monitoraggio 9TF Double RSI, ovvero RSI veloce e RSI lento

Monitoraggio se la linea RSI veloce è sopra o sotto la linea RSI lenta

Monitoraggio 9TF Dual MACD, ovvero MACD veloce (MACD 1) sopra o sotto MACD lento (MACD 2) e sono su o giù

Monitoraggio della linea MACD principale sopra o sotto la linea MACD del segnale

Monitoraggio 9TF Dual Stochastic, ovvero Stocastico Veloce (Stocastico 1) sopra o sotto Stocastico Lento (Stocastico 2) e sono su o giù

Monitoraggio se la linea stocastica principale è sopra o sotto il segnale della linea stocastica

Monitoraggio 9TF Double CCI, ovvero la posizione sulla linea OBOS e il movimento attuale

Monitoraggio 9TF RSIOMA, ovvero la linea RSI sopra o sotto la linea MA

Possibilità di impostare parametri e scegliere l'intervallo di tempo come desideri

Possibilità di mostrare/nascondere la legenda

Possibilità di aumentare/diminuire il numero di bar, il valore predefinito è 800 bar

Possibilità di selezionare fino a 20 combinazioni di colori del dashboard

Questo indicatore può visualizzare la freccia RSIMA per l'intervallo di tempo scelto

Questo indicatore può visualizzare la freccia MACD per l'intervallo di tempo scelto

Questo indicatore può visualizzare la freccia stocastica per l'intervallo di tempo scelto

Questo indicatore può visualizzare la freccia MA 1x2 e MA 3x4 per l'intervallo di tempo scelto

Questo indicatore può visualizzare la freccia Double RSI per l'intervallo di tempo scelto

Questo indicatore può visualizzare la freccia Doppia CCI per l'intervallo di tempo scelto

Freccia non ridipinta
Prodotti consigliati
ROC acceleration-deceleration is the manual system for medium-term scalping. Indicator based on custom ROC system which defines bullish/bearish market and especially  acceleration-deceleration of tendention in the market's main direction. Buy arrow is plotted during bearish market when current trend decelerates and sell  arrow is plotted during bullish market when current trend decelerates. Main Indicator's Features Signals are not repaint,non-late or disappear(exept cases when system recalculat
Kilimanjaro EA
Botond Ratonyi
5 (1)
Check out my youtube channel about forex trading robots:  https://www.youtube.com/channel/UCL_p6fuQtNkg-1rRY69t5Ig Message me on telegram if you have any questions:  https://t.me/BRobotTrader H1 TIMEFRAME Updates and improvements(2021.08.12): USE THE SET FILES FROM THE COMMENT SECTION! This is the biggest update in the life of the KILIMANJARO EA, it got new features and NEW engine, plus many new parameters to optimize and play around with. ---It got the official TheNomadTrader Dynamic e
Trend New
Vitalii Zakharuk
Trend New Trend Indicator, shows the signals for entry. Displays both entry points and the trend itself. Shows statistically calculated moments for entering the market with arrows. When using the indicator, it is possible to optimally distribute the risk factor. Settings: Uses all one parameter for settings. Selecting a parameter, it is necessary to visually resemble it so that the appropriate graph has a projection of extremes. Options: Length - the number of bars for calculating the indica
Mongol Indicator2
Sumiyabazar Buyanjargal
It's a variation of mid of HH and LL since it compares the higher of HH or LL against a period and twice the number of bars back to avoid whipsaws. I used to display this against lines on a chart, but made a histogram out of it and it looks interesting. It looks good at gauging trend strength and general turns (see image below). The name of the indicator is BAM, which is an acronym for "Below and Above Mid". Ways to use it: 1. To see general trend on longer TFs (more than 30 bars back).
PTW NON REPAINT TRADING SYSTEM + HISTOGRAM Non-Repainting ,   Non-Redrawing   and   Non-Lagging  Trading System. Does the following: - Gives Accurate Entry and Exit Points - Scalping, Day and Swing Trading  - 95% Accuracy  - Targets, where to take profits. - Shows Trends, Support and resistance levels - Works on All Brokers - Works on All Currencies, CFDs and Stocks - It does not place trades for you, it only shows you what trades to place. - It works on All Timeframes - It is for Trend or ran
Demand And Supply
Khurram Mustafa
1 (1)
Function Indicate Buy Sell Signals Indicate Strength of Buy Sell Signals This system is for both type of traders (Short & Long Term) Instead of Other Calculations, Parabolic Sar & Awesome are also used In Any time frame this can be use. What is in for Trader? Trading Switch:  Short Term & Long Term Finally, we all knows that Forex Trading needs completely concentrate & proper cash management, So I never promising that my program will never give you loss but I tried well to provide good and respo
FREE
This system never paints.   This system created by using Envolpes bands and reverse bar count.   This indicator is only working in M5 period.   This system is for long term and profitable.   Signals are shown as arrows. as an optional limit orders.   You can set a voice alarm or email notification.   You can fins our other products from link : https://www.mql5.com/en/users/drbastem/seller   Also, you can ask all your questins from email : haskayafx@gmail.com or mobile : +90 530 867 5076 or @Meh
Ultimate Hero MT4
Smart Forex Lab.
5 (1)
Costruito per ottenere le massime prestazioni. Ottimizzato per i prelievi di profitto. Introduzione di una nuova opzione - test con emulazione dei ritiri dei profitti. Ultimate Hero è uno strumento di trading avanzato progettato per massimizzare i vostri profitti sul mercato forex. Questo software di trading avanzato è stato creato utilizzando la più recente tecnologia GPT-4 e dispone di un'ampia gamma di funzioni avanzate. Ultimate Hero è un bot di trading che utilizza una strategia di trading
Using multiple timeframes for analysis with Multi Timeframe Average Directional Index  can provide several significant benefits for traders: Comprehensive Market View: By applying Mtf ADX Standard across different timeframes, traders gain a broader perspective on market dynamics. This allows them to identify trends, patterns, and potential reversal points that might be more apparent or consistent across various scales. Enhanced Pattern Recognition: Multiple timeframes help in identifying repeati
FREE
Primus Trading Engine is a trading system that combines price action,ratio based indicators & custom indicators to create this leading indicator with a multi-timeframe approach to give you high probability trade setups for forex,CFD cash/futures,metals & binary option to assist in making predictions on what is MOST likely to happen in the market Main Chart Features Price Action Signal-Arrow displayed on a specific bar;NOT buy/sell arrow;DOES NOT repaint;Bullish arrow on a bullish bar,price is l
Un indicatore tecnico che struttura i grafici e identifica i movimenti ciclici dei prezzi. Può funzionare su qualsiasi grafico. Diversi tipi di notifiche. Ci sono altre frecce sul grafico stesso. Senza ridisegnare la storia, lavora sulla chiusura della candela. TF consigliati da M5 in su. Parametri facili da usare e configurare. Se si utilizzano 2 indicatori con parametri diversi, è possibile utilizzarli senza altri indicatori. Ha 2 parametri di input Ciclicità e durata del segnale Questi 2 pa
Valentines
Victor Golovkov
Valentines trend is an easy-to-use indicator that hides a powerful calculation math-system "under the hood". Attach the indicator to the chart and set the parameters. Period - period for tracking changes in quotes Amount of Bars - number of last bars to track You do not need to select any numerical parameters. The indicator will do everything for you automatically . Each signal is generated on the current bar, and in order not to miss it, use the built-in alerts and notifications system . The in
This trading expert advisors is an clone & upgrade of  "EA Rough Duster ", also trades best on GBPNZD minute 5 timeframe. Maintains a constant account growth and runs best on low spread and commission based accounts. Uses Martingale & perfect hedging to recover unprofitable positions ensuring no loss. Its consistent profit curves,low DrawDowns & risk proves the record for itself in reliability and consistency plus its unique market analysis ensures quick extraction of profits by scalping the mar
The AlgoKing Lightning Bolt Strategy is a trade manager and has multiple indicators built for a complete trading strategy.  Here is a list of indicators built in. Indicators Auto drawn Support and Resistance signals Auto drawn RSI Divergence signals Auto drawn Fibonacci Retracement signals with buy and sell entry lines. Lightning Bolt reversal signals. Auto drawn trend lines. Trade Management Auto take partials at simple moving average targets. Auto take partial and stop losses at Fibonacci ret
Con questo strumento di trading puoi scansionare 15 mercati contemporaneamente. Presentazione del nuovo indicatore di trading 2024: ️ Dashboard Stocastico multi valuta e multi time frame. Ci sono almeno due ragioni per cui ho creato questo strumento di trading: Innanzitutto, sono stanco di osservare solo un mercato. In secondo luogo, non voglio perdere il momento di ingresso in un altro mercato. Ecco perché voglio conoscere contemporaneamente altre condizioni di mercato. Per questo motiv
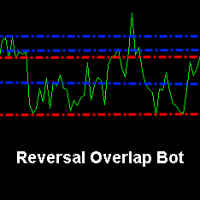
Reversal Overlap Bot is an automated trading strategy. No technical indicators are used in the work. At the beginning of trading, the first order is placed in a certain direction (at your option). When you open a new candle, this order is closed if it is in profit. Otherwise, the next order opens in the opposite direction. Orders are closed when profit is reached. If there are unprofitable orders on the chart, the robot will close one of them. When closing loss-making orders, the profit covers t
Testing Trade
Glory Orluike Echonwere
The indicator is a 15-minute signal indicator for all types of traders. Meaning, you could make lots of profits trading two different signals in one indicator. NOTE: Both indicators are channels for achieving the same result. RED ARROW -- Sell Signal BLUE ARROW -- Buy Signal Purchase now to be part of our community. We offer standard chart setups for both novice and intermediate traders. Trade with ease!
FREE
The indicator scans for TD Combo signals in multiple timeframes for the all markets filtered and shows the results on Dashboard. Key Features Dashboard can be used for all markets It can scan for signals on MN1, W1, D1, H4, H1, M30, M15 ,M5, M1 timeframes Parameters UseMarketWatch: Set true to copy all symbols available in market watch MarketWatchCount : Set the number of symbols that you want to copy from the market watch list. CustomSymbols: Enter the custom symbols that you want to be availa
E13 Acid Flux
Dariel Iserne Carrera
4 (1)
Based on a combination of indicators, E13 Acid Fulx is an excellent indicator for knowing when to buy or sell on any asset and temporaryity. The indicator myself I have used it as a tool for my analysis when trading Forex. It is a useful and easy-to-understand trend indicator.  If you combine it with your own analyses you will surely get a good result in your operation.
FREE
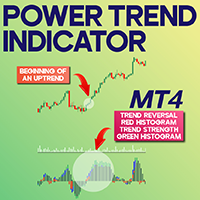
Power Trend Indicator for MetaTrader 4 The Power Trend Indicator for MetaTrader 4 is designed to assess both the momentum and direction of price movements. This MT4 indicator presents the trend strength using a four-color-coded system, allowing traders to spot weak momentum phases and anticipate potential trend initiations. Its visual feedback is valuable for recognizing shifts in market sentiment and detecting trend transitions. Red signals indicate reversals, blue suggests mild trends, while g
FREE
Synapse Trader MT4
Andrei Vlasov
5 (2)
Synapse Trader: Una rete neurale che apre nuovi orizzonti nel trading Immagina un consulente che non si limita ad analizzare il mercato, ma diventa il tuo assistente intelligente, imparando ogni giorno e adattandosi alle condizioni di mercato in continua evoluzione.   Synapse Trader   è uno strumento unico, basato su tecnologie avanzate di reti neurali, in grado di catturare i segnali più sottili del mercato. Non è solo un Expert Advisor, è una   rete neurale vivente   che pensa, prevede ed evol
Boost binary option profesional
Sebastian Alejandro Merino Sepulveda
Binarias & Forex (+90% Ratio-Win Next Candle) Espere que el precio llegue a una buena zona (fuerte) sea soporte, resistencia, zona de oferta o demanda, fibonacci level key, cifra redonda. Haciendo lo anterior definitivamente habrá una reversión en el precio y obtendrá su ITM en primera vela dando una efectividad del 100% siguiendo la tendencia. Es muy importante estar atento a las noticias fundamentales en el mercado y estas no afecten tu trading. Sesiones comerciales: cualquiera (24 horas).
Tug
Evgeniy Zhdan
The algorithm of the advisor calculates the important support and resistance levels. Next, the Expert Advisor calculates the probability of price movement "to" or "away" from this price level. Support: https://www.mql5.com/en/channels/TrendHunter If a high probability of price movement in the desired direction is determined, the advisor opens a deal. Each trade is protected by a stop loss. Dangerous trading methods are not used. Recommended instruments (5M): GBPUSD, EURUSD, USDJPY, USDCAD. Ad
1.Determine the trend size based on the chart cycle.   An uptrend near the highest price in a period of time.   A trend down near the lowest price in a period of time. 2.   short-term trends.   Oversold and long;   Overbought, short. 3. Unwind positions based on overbought and oversold and profit points. real-time signal: https://www.mql5.com/zh/signals/1538661?source=Site+Signals+My EA Settings: You need to load EA into the currency pair to trade (M15 time range). The best performing symbol : E
Introduzione del nostro avanzato Indices Sniper Robot. L'algoritmo di scalping e Swing è stato creato per individuare punti di entrata e uscita ad alta probabilità, assicurando che ogni trade venga eseguito con la massima probabilità di successo entro il timeframe M5 e il timeframe 1M. La coppia migliore da usare con lo Scalping e lo Swing Robot è USTEC, US30, S&P 500, Gbpusd. Questo robot è perfetto per i trader che preferiscono il metodo scalping/Swing Method e vogliono sfruttare i rapidi movi
Anemone
Sean Christian Hammond
Creato utilizzando l'intelligenza artificiale, AI, per incorporare i modelli di comportamento visibili di un organismo vivente nell'analisi delle tendenze. La Teoria del Caos incontra la Media Mobile. L'anemone di mare filtratore estende i suoi viticci in un mare di sostanze nutritive per arricchirsi. Non vi farò perdere tempo con descrizioni troppo lunghe, il concetto è comprensibile in questi termini. Si tratta di una media mobile rotante di periodo personalizzabile che passa da semplice, espo
ZORRO 3 in 1
Vladimir Pokora
This robot combines three ways of trading and for all uses the same successful money management. All three ways of trading can be used simultaneously or separately. Auto search and trading SR levels and their breakout. News trading - at a specified time placed pending orders for BUY and SELL. Manual opening trades using buttons in the chart. For these your trades will use the same money management as for automated trading. Is recommended ECN broker with minimal spread and with minimal slip and
Ciao commercianti. Ti presento il mio miglior strumento di trading. MTF PPAAF Modello T. Multi time frame Freccia precisa dell'azione del prezzo filtrata Modello T.  Questo strumento di trading è il mio miglior lavoro dopo anni trascorsi a creare vari strumenti di trading. Perché questo strumento di trading è il migliore e affidabile?  1. Questo strumento utilizza 6 indicatori:  Doppio CCI = CCI veloce x CCI lento Doppio stocastico = stocastico veloce (linea principale stocastica ve
I speak in Hungarian. Magyarul beszélek benne. Első felvétel. https://www.youtube.com/watch?v=FfqvT-i9TPk&feature=youtu.be (Első felvétel. https://www.youtube.com/watch?v=MapbQrJ0uPU&t=9s   Első felvétel. https://www.youtube.com/watch?v=i2id5O1KPrI Második felvétel. https://www.youtube.com/watch?v=Zp2i7QN-IMc Első felvétel. https://www.youtube.com/watch?v=h7UbTWiM-Lw Második felvétel. https://www.youtube.com/watch?v=y54q4Rasf2A&t=1s Harmadik felvétel. https://www.youtube.com/watch?v=13zYjsoe6
AI Holy Grail
Prawit Nimwong
***Importanr_1*** USE : All Time Frame M1,M5,M15,M30,H1,H4,D1,W1,MN Lot size , Slippage > 1,000 for BTCUSD and Magic number can be adjusted. XAUUSD (GOLD) ,EURUSD,USDJPY,GBPUSD,AUDUSD,GBPJPY,USDCHF,USDCAD,BTCUSD +++Set Parameter+++ 1.Set Fixed Lot = 0.01  ( Lot size 0.0 = Martingale system ) 2.Set Slippage = 1,000-10,000 ( For XAUUSD,ฺBTCUSD) 3.Set Max Spread =  100-1,000 ( For XAUUSD,ฺBTCUSD) ***Importanr_2*** Forex Trading Warning: Forex trading carries a high level of risk and may not
Gli utenti di questo prodotto hanno anche acquistato
This is a mini version(One pair) of Advanced Detector of Trend Reversal and Continuance known as TrueTrendStarM(TTSm25). It is a sensitive and Predictive indicator of Price Trends for Professional traders. ( WEEKEND DISCOUNT OFF !! )( ATTENTION BUYERS:- PLEASE CONTACT ME FOR HOW BEST TO USE THE INDICATOR FOR MAXIMUM PROFITS )    It detects high odds changes in Price Trend direction long before other indicator detects it. I have been working on it since 2019.    This is possible due to fracta
Magic M2
Tuan Anh Dao
4.5 (8)
------ GOOD LUCK   -----   (Telegram: @MagicBinary) The indicator allows you to trade binary options. T his indicator give high winning ratio with over 20 years of backtesting  The recommended time frame is М1 and the expiration time is 3, 5 minutes. The indicator suitable for Auto and Manual trading. A possible signal is specified as a arrows above/under a candle. You can entry current candle /intrabar or can wait until candle close Arrows are not re-painted Trade sessions: Any/ Rec
Trade Invest Pro
Dmitriy Kashevich
Trade Invest Pro - Boss in the world of cryptocurrency! This indicator is ideal for cryptocurrency trading! Work on Trade Invest Pro took us half a year! But not in vain! Now only accurate signals near support - resistance levels! He showed himself well on timeframes m5 m15 for binary options! Optionally, it can be configured for forex for timeframes m30 and more! Reacts well to news! Doesn't paint! and does not disappear from the schedule! As soon as a red arrow appears, open a deal fo
Il TRANSACTION SPEED è l'indicatore di maggiore qualità che mostra dove e quando si accumulano grandi ordini sul mercato e i vantaggi che ne derivano. Rileva i cambiamenti di tendenza in una fase molto precoce. È contemporaneamente un indicatore e un sistema di trading. Il concetto è unico e incredibilmente redditizio. Nel Forex, il volume dei tick è chiamato in modo piuttosto fuorviante volume. In realtà si tratta della variazione di prezzo per unità di tempo, che di fatto è la VELOCITÀ DI TR
Dark Sniper
Dmitriy Kashevich
Dark Sniper pointer indicator.  Complete absence of redrawing   The percentage of correct indicator forecasts depends on your settings; the default is period 7 (performed better) The arrow indicates the direction of the next candle and the possible direction of the trend in the future.  Suitable for small timeframes m1 and m5  It is recommended to open transactions from 1 to 2 candles.  The signal appears on the current candle. Open a trade on the next one since the signal is being generat
Risk Reward ratio indicator for MT4  BING Risk Reward indicator is a powerful, basic, very needed tool for every trader. Clearly visualize Open Price , Stop Loss , and Top Profit levels on your graphs with easy-to-see colors and trendlines. Does BING Risk Reward show alerts? Of course! BING Risk Reward Indicator offers all Alerts available for the MT4 platform(Email, Popups, Sound, and Push). It shows alerts on Open Price , Stop Loss , and Top Profit. That way, besides easily seeing what is go
Automatic, live & interactive picture of all trendlines. Assign push, email and sound alerts to the lines of your choice and be informed about price rollback, breakout, rollback after breakout, number of rollbacks, line expiration by double breakout. Correct, drag or delete the lines and interactively tune the line system. https://youtu.be/EJUo9pYiHFA . Chart examples https: //www.mql5.com/en/users/efficientforex Price Interaction Events All events are effective immediately and only after one
The indicator displays the probable ( Support and resistance ) levels. The indicator draws horizontal and trend levels of support and resistance. The indicator settings: Trends - the mode for displaying trend lines or horizontal lines of support and resistance Yes - display trend lines only No - display horizontal lines only UseResource - use the resources built into the indicator. Yes - use the ZigZag indicator from the resources of the product. No - use a custom ZigZag indicator. HistoryBar -
The indicator of a Professional Trader is an arrow indicator for predicting the direction of price movement. I have been working on this indicator since 2014. You can use this indicator as your main indicator, use its entry signals, and use it as your only indicator to find entry points. About the product: Recommended TF [H4-D1-W1]   . The indicator predicts the direction of the next candle. Fits a variety of tools; Flexibility in settings for different instruments and intervals through the MO
The [GRAFF] III manual trading system is based on multiple MetaTrader (MT4) indicators. Together, the entire PACK of GRAFF III indicators makes an advanced trading tool. The system consists of over 20 different custom-built indicators which have been carefully selected and tested in the long term to produce strong and efficient trading signals. The particular indicators are based on different mathematical formulas, so the entire system is calibrated to remove false signals from its own indicator
You can fins our other products from link : https://www.mql5.com/en/users/drbastem/seller   Also, you can ask all your questins from email : haskayafx@gmail.com or mobile : +90 530 867 5076 or @MehmetBastem    on telegram application This indicator is used to determine the trend. Standard Osma indicator is used. It has the indicator warning system: beep, e-mail and has three types of alerts, including messages to mobile phone. It shows the best performance on the chart of 5 minutes. When the
You can fins our other products from link : https://www.mql5.com/en/users/drbastem/seller   Also, you can ask all your questins from email : haskayafx@gmail.com or mobile : +90 530 867 5076 or @MehmetBastem    on telegram application This indicator is used to determine the trend. Standard Three Moving Average and ADX indicators are used. It has the indicator warning system (audio, e-mail) and three types of alerts, including messages to mobile phone. It shows the best performance on M5. When
This indicator is used to determine the trend. Standard Three Moving Average and ADX indicators are used. It has the indicator warning system (audio, e-mail) and three types of alerts, including messages to mobile phone. It shows the best performance on M5. When the trend value reaches the value set, the warning system is activated. This indicator works only with Forex symbols. Inputs SoundAlarm = true - Sound Alert Sendmail=true - Send an e-mail in case of a buy or sell signal Sendnotification
You can fins our other products from link : https://www.mql5.com/en/users/drbastem/seller   Also, you can ask all your questins from email : haskayafx@gmail.com or mobile : +90 530 867 5076 or @MehmetBastem    on telegram application This indicator is used to determine the trend. Standard MACD indicator is used. It has the indicator warning system: beep, e-mail and has three types of alerts, including messages to mobile phone. It shows the best performance on the chart of 5 minutes. When the
Smooth price for Monarch MT4
Konstantin Gruzdev
3.67 (3)
The Smooth Price technical indicator is used for plotting a smoothed line as close to the price of the financial instrument as possible, and serves to eliminate its noise components. The indicator is part of the Monarch trading system, but here it is presented as an independent technical analysis tool. The indicator is based on the cluster digital filter , which, unlike the ClusterSMA , is applied directly to the price time series. Smooth Price does not redraw (except the very last, zero bar) an
Pan PrizMA CD Phase is an analogue of the МetaТrader 5 indicator , and is an option based on the Pan PrizMA indicator. Details . Averaging by a quadric-quartic polynomial increases the smoothness of lines, adds momentum and rhythm. Extrapolation by the sinusoid function near a constant allows adjusting the delay or lead of signals. The value of the phase - wave status parameter (which is close in meaning to the trigonometric phase or the angle of the radius-vector rotation in the trigonometric p
Green Wall Arrows
Daniel Luchinger
1 (1)
The Name Green Wall : Arrows hits a lot of TP, by changing the idea of non using SL as something bad, but instead use Small TP and a lot of free Margin and Patience. Use micro TP and a lot of Free Margin with this indicator on Forex. It also can be used with Binary Options. This strategy is intended to be traded Manually. This Indicator runs on Open Bar, arrows will delete when price are against it. The only Indicator Parameter is Alerts true/false, all the rest is included inside the code. Arro
Golden Monowave
Ahmed Mohamed Ali
Golden Monowave is monowave indicator, the monowave theory is one of Elliott wave approach and one of most complicate and accurate method. Golden Monowave can shortcut many major steps to identify and describe the monowave. It works on any timeframe and with any trading instrument, including currencies, indices, futures, etc. Input Parameters initial_Bars - set the initial number of bars to calculate. wave_color - select the color of the wave. label_color - select the color of labels. temp_labe
Ticks Size
Viktor Kolmakov
This indicator displays in a separate window the difference between the number of points which increased the price, and the number of points that decreased the price during the time interval specified in the settings. The time interval for calculation is expressed as the number of bars of the chart the indicator is attached to. This approach allows you to evaluate the movement direction (growth or fall) of the instrument's price, the strength of the movement and the size of the movement in point
NostradamusMT4
Andrey Spiridonov
1 (1)
NostradamusMT4 is a powerful indicator from the set of professional trader. The indicator is based on Andrei Spiridonov's original price calculation method (ESTIMATED PRICE) for the current candle price. Advantages The indicator does not redraw. It works on any timeframes. Works with any trading instruments. Perfectly suitable for scalping and trading binary options. Parameters Color - color of the ESTIMATED PRICE FUTURE line. How to work with the indicator The indicator forms the ESTIMATED P
BinaryIndicator
Andrey Spiridonov
BinaryIndicator is a highly accurate indicator for trading binary options. It shows excellent results in scalping. This indicator is based in multifactor analysis of trend indicators, as well as confirmation oscillators, which in the end gives an increased accuracy of signals. Advantages of the indicator Increased accuracy of signals. Excellent results when trading binary options with a short expiration time from M30 to M1 . It works on any timeframes. Works with any trade symbols. Parameters
FutureTrade
Andrey Spiridonov
3 (2)
FutureTrade is one of the few indicators that predicts the price right on the price chart. The indicator calculation algorithm is based on the fast Fourier transform. Given the oscillatory behavior of the price, the Fourier function predicts its future behavior. The indicator should be attached in the usual way to a chart with the trading instrument specified symbol and with the M15 timeframe. This timeframe is the most optimal for working with any symbols. Once started, the indicator calculates
BinaryScalping
Andrey Spiridonov
BinaryScalping is a professional indicator for trading binary options and scalping. The algorithm of the indicator is based on the calculation of pivot points for each time period separately, the location of the price of the trading instrument relative to the pivot points is analyzed and the probability of a trading operation is calculated. The indicator has a built-in filter of trading signals based on the global trend. The indicator is installed in the usual way and works with any trading inst
This is the FXTraderariel PowerTrend . It compute a trendfollowing system based on it own algorithm. It gives you a buy or sell signal based on the trend. It based on the Supertrend, but our Version is not repainting. Furthermoore we added some Improvements and you can get an Arrow, Push or Alert when the trend changes. Depending on the settings it and trading style, it can be used for scalping or long-term trading . The indicator can be used on every time frame , but we advise to use it on H1
This is the complete REX package. It consists of the lite, pro and ULTRA version.  Perfect for beginners and intermediates. REX complete is 100% non repaint. The strategy is based on a mix of different strategies, statistics, including pivot points, oscillators and patterns.  As the trading idea consists of a variety of some classic indicators like Momentum, Williams Percent Range, CCI, Force Index, WPR, DeMarker, CCI, RSI and Stochastic, it is clear that the fundamental indicators have being u
BinaryUniversal
Andrey Spiridonov
BinaryUniversal is a signal indicator for binary options and Forex. In its work, the indicator uses a complex algorithm for generating signals. Before forming a signal, the indicator analyzes volatility, candlestick patterns, important support and resistance levels. The indicator has the ability to adjust the accuracy of the signals, which makes it possible to apply this indicator for both aggressive and conservative trading. The indicator is set in the usual way, it works on any time period and
Sweet Waffle
Christophe Godart
The arrows are calculated with: -     2 Parabolic  parameters -     2 ADX parameters -     4 Stochastic parameters We recommend to combine it with Parabolic, ZigZag or Elliot waves indicator. Always trade the trend! If you make sure to draw your trend lines and support/resistance zones you will just have to wait for the signal to appear. Take the trade. For Binary Options it is advisable to set the expiry time to 5-15 min in M1 chart. THIS INDICATOR IS ZERO REPAINT Best assets to trade: - EUR
Let´s try to make some real money! Call me profit addicted. I thought why not try to make THE dream come reality. With discipline, a clear strategy and this indicator I focus on entering the perfect trades. This indicator is very easy to use as you will get perfect entry points for Put or Call trades. The arrows are calculated with: -     Momentum  parameters -     Candle stick patterns -     Fundamental Price action We recommend to combine it with Parabolic, ZigZag or Elliot waves indicator
SystemPro
Andrey Spiridonov
SystemPro - a professional indicator, is a full-fledged, self-sufficient author's strategy for working in the Forex market. A unique algorithm for analyzing the foreign exchange market is based on the calculation of reference points for three different time periods. Thus, the indicator simultaneously analyzes the long-term, medium-term and short-term price behavior before issuing a signal. The indicator is set in the usual way and works with any trade symbols. Advantages of the indicator It is
Altri dall’autore
[V 1.00] MTF NRPA 5 RSI RTD è stato rilasciato! Dashboard in tempo reale con freccia non riverniciata. Se sei stanco di utilizzare vari indicatori RSI ma scopri che sono imprecisi, prova questo strumento. Di solito le persone installano solo 1 RSI per determinare il livello OBOS in un lasso di tempo. La cattiva notizia è che non puoi vedere i livelli e le tendenze OBOS in vari intervalli di tempo contemporaneamente. Ecco perché ho sviluppato questo strumento di trading. Ecco come viene spieg
[V 1.00] MTF NRPA 5 Moving Average RTD è stato rilasciato! Dashboard in tempo reale con freccia non riverniciata. Se stai cercando il miglior indicatore di media mobile, allora sei sulla pagina giusta. Generalmente le persone installeranno due medie mobili perché l'intersezione delle due medie mobili (il crossover) determinerà la direzione della prossima tendenza dei prezzi. Se la media mobile veloce si interseca con la media mobile lenta e veloce > lenta, allora il trend è al rialzo. Al cont
Analizzare più intervalli di tempo di una coppia di valute in una finestra può confonderti. Per analizzare più intervalli di tempo, hai bisogno di indicatori affidabili. Uno di questi utilizza 9TF MACD Curve. Ho lavorato giorno e notte per creare un codice semplice ma affidabile e che copra tutti e nove i tempi in un solo indicatore. Diamo un'occhiata ad alcuni dei vantaggi di questo indicatore: Istogramma colorato. Il colore della curva in ogni intervallo di tempo è diverso l'uno dall'alt
Analizzare più intervalli di tempo di una coppia di valute in una finestra può confonderti. Per analizzare più intervalli di tempo, hai bisogno di indicatori affidabili. Uno di questi utilizza 9TF STOCH RSI. Ho lavorato giorno e notte per creare un codice semplice ma affidabile e che copra tutti e nove i tempi in un solo indicatore. Diamo un'occhiata ad alcuni dei vantaggi di questo indicatore: Istogramma colorato. Il colore della curva in ogni intervallo di tempo è diverso l'uno dall'altr
Analyzing multiple time frames of a currency pair in one window can make you confused. To analyze multiple time frames, you need reliable indicators. One of them is using 9TF RSI MA . I've been working day and night to create code that is simple but reliable and covers all nine time frames in just one indicator .  Let's look at some of the advantages of this indicator: Colorful histogram . The color of the curve in each timeframe is different from one another.  Arrows indicating the crossing of
Analyzing multiple time frames of a currency pair in one window can make you confused. To analyze multiple time frames, you need reliable indicators. One of them is using 9TF MACD Limited Bar . I've been working day and night to create code that is simple but reliable and covers all nine time frames in just one indicator .  Attention! When first installed, the indicator does not look intact. Changing the timeframe will solve the problem. Let's look at some of the advantages of this indicator: C
Analyzing multiple time frames of a currency pair in one window can make you confused. To analyze multiple time frames, you need reliable indicators. One of them is using 9TF STOCH RSI LIMITED BAR . I've been working day and night to create code that is simple but reliable and covers all nine time frames in just one indicator .  Attention! When first installed, the indicator does not look intact. Changing the timeframe will solve the problem. Let's look at some of the advantages of this indicat
Analizzare più intervalli di tempo di una coppia di valute in una finestra può confonderti. Per analizzare più intervalli di tempo, hai bisogno di indicatori affidabili. Uno di questi utilizza 9TF Double RSI Double MA. Ho lavorato giorno e notte per creare un codice semplice ma affidabile e che copra tutti e nove i tempi in un solo indicatore. Diamo un'occhiata ad alcuni dei vantaggi di questo indicatore: Doppio RSI, cioè RSI più veloce e RSI più lento. Doppio MA, cioè MA più veloce e MA p
Analizzare più intervalli di tempo di una coppia di valute in una finestra può confonderti. Per analizzare più intervalli di tempo, hai bisogno di indicatori affidabili. Uno di questi utilizza 9TF Double CCI Double MA. Ho lavorato giorno e notte per creare un codice semplice ma affidabile e che copra tutti e nove i tempi in un solo indicatore. Diamo un'occhiata ad alcuni dei vantaggi di questo indicatore: Doppio CCI, cioè CCI più veloce e CCI più lento. Doppio MA, cioè MA più veloce e MA p
È disponibile un accurato indicatore CCI. Cruscotto Trend Bar Smart Level 9TF Doppio CCI. Doppio CCI, ovvero CCI veloce e CCI lento Perché hai bisogno di un secondo CCI? L'utilizzo di indicatori aggiuntivi ci convincerà di più nel trading dal vivo 9TF Curva CCI veloce 9TF Curva CCI lenta Angolo CCI in tempo reale 9TF Valore CCI in tempo reale 9TF Direzione/fase CCI in tempo reale 9TF Barra di tendenza 9TF Nuovo algoritmo per il calcolo della barra dei trend Pulsante di accensione/spegnimento.
È disponibile un accurato indicatore RSI. Cruscotto Trend Bar Smart Level 9TF Doppio RSI. Doppio RSI, ovvero RSI veloce e RSI lento Perché hai bisogno di un secondo RSI? L'utilizzo di indicatori aggiuntivi ci convincerà di più nel trading dal vivo 9TF Curva RSI veloce 9TF Curva RSI lenta Angolo RSI in tempo reale 9TF Valore RSI in tempo reale 9TF Direzione/fase RSI in tempo reale 9TF Barra di tendenza 9TF Nuovo algoritmo per il calcolo della barra dei trend Pulsante di accensione/spegnimento.
È disponibile un indicatore MACD accurato. Cruscotto Trend Bar Smart Level 9TF Doppio MACD. Doppio MACD, ovvero veloce (MACD 1) e lento (MACD 2) Perché hai bisogno di un secondo MACD? L'utilizzo di indicatori aggiuntivi ci convincerà di più nel trading dal vivo Curva MACD 1 veloce da 9TF 9TF Curva MACD 2 lenta Angolo MACD in tempo reale 9TF Valore MACD in tempo reale 9TF 9TF direzione MACD in tempo reale È disponibile un indicatore MACD accurato. Cruscotto Trend Bar Smart Level 9TF Doppio MAC
È disponibile un accurato indicatore stocastico. Dashboard Trend Bar Smart Level 9TF Dual Stochastic. Doppio stocastico, ovvero stocastico veloce e stocastico lento Perché hai bisogno del secondo stocastico? L'utilizzo di indicatori aggiuntivi ci convincerà di più nel trading dal vivo 9TF Curva stocastica veloce 9TF Curva stocastica lenta Angolo stocastico in tempo reale 9TF 9TF valore stocastico in tempo reale 9TF direzione/fase stocastica in tempo reale Barra di tendenza 9TF Nuovo algoritmo
Introducing the advanced trading tools of 2023. MTF PPAAF Model S. This is sub window version of my best trading tool : MTF Precise Price Action Arrow Filtered.  Click here to learn more about MTF PPAAF . This trading tool is equipped with various powerful features : MTF = Multi Time Frame = Time Frame can be changed. On/off button. Non Repaint Arrows.  Customizable parameter, color etc.  Can show all time frame (ATF) crossover arrows of fast stochastic main line & fast stochastic signal line (
If you are curious about the position of the stochastic, RSI, CCI curve, whether it is at the OBOS level or not, then this trading tool is for you. Introducing the advanced trading tools of 2024. ATF Trend Following Trend Bar OBOS. This indicator is similar to MTF PPAAF Model S but have two layers.  Click here to learn more about MTF PPAAFS . This trading tool is equipped with various powerful features : MTF = Multi Time Frame = Time Frame can be changed. On/off button. Customizable parameter,
Ciao commercianti. Ti presento il mio miglior strumento di trading. MTF PPAAF Modello T. Multi time frame Freccia precisa dell'azione del prezzo filtrata Modello T.  Questo strumento di trading è il mio miglior lavoro dopo anni trascorsi a creare vari strumenti di trading. Perché questo strumento di trading è il migliore e affidabile?  1. Questo strumento utilizza 6 indicatori:  Doppio CCI = CCI veloce x CCI lento Doppio stocastico = stocastico veloce (linea principale stocastica ve
Con questo strumento di trading puoi scansionare 15 mercati contemporaneamente. Presentazione del nuovo indicatore di trading 2024: ️ Dashboard Stocastico multi valuta e multi time frame. Ci sono almeno due ragioni per cui ho creato questo strumento di trading: Innanzitutto, sono stanco di osservare solo un mercato. In secondo luogo, non voglio perdere il momento di ingresso in un altro mercato. Ecco perché voglio conoscere contemporaneamente altre condizioni di mercato. Per questo motiv
Con questo strumento di trading puoi scansionare 15 mercati contemporaneamente. Presentazione del nuovo indicatore di trading 2024: ️ Dashboard Multi Valuta Multi Time Frame Doppio CCI. Ci sono almeno due ragioni per cui ho creato questo strumento di trading: Innanzitutto, sono stanco di osservare solo un mercato. In secondo luogo, non voglio perdere il momento di ingresso in un altro mercato. Ecco perché voglio conoscere contemporaneamente altre condizioni di mercato. Per questo motivo
Con questo strumento di trading puoi scansionare 15 mercati contemporaneamente. Presentazione del nuovo indicatore di trading 2024: ️ Dashboard Multi Valuta Multi Time Frame Doppio RSI. Ci sono almeno due ragioni per cui ho creato questo strumento di trading: Innanzitutto, sono stanco di osservare solo un mercato. In secondo luogo, non voglio perdere il momento di ingresso in un altro mercato. Ecco perché voglio conoscere contemporaneamente altre condizioni di mercato. Per questo motivo
Filtro:
Nessuna recensione
Rispondi alla recensione
Versione 6.10 2025.04.17
In this new Version V 6.10 :
- Minor changes
Versione 6.0 2025.04.14
In this new Version V 6.00 :
- Adding arrow angle STF (the default is TF M15)
- Customizing arrow distance of Belt Trend
- Customizing digit and color of angle value MA
- Adding timeframe and calculation mode for arrow trend following (setting H4)
- Optimization
Versione 5.90 2025.03.26
In this new Version V 5.90 :
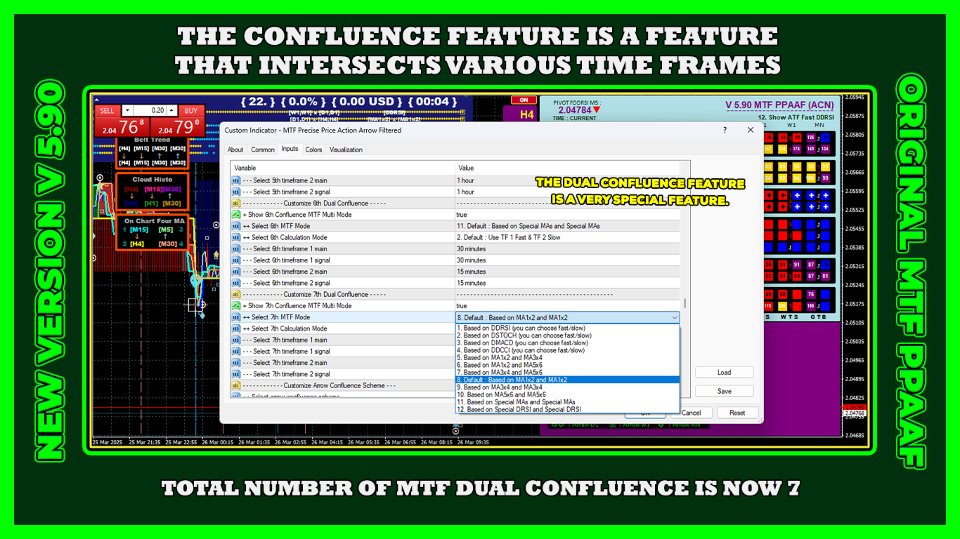
- Total number of trend bar MTF Dual Confluence Multi Mode is now 7
Versione 5.80 2025.03.18
In this new Version V 5.80 :
- Adding special MAs & special DRSI
- Optimizes performance when installed with the best combo MTF PPAAF Model T
- Quint MTF Dual Confluence Multi Mode
Versione 5.70 2025.01.31
In this new Version V 5.70 :
- New algo of status per TF
- Customizing arrow Trend Bar 9TF RSIMA CCIMA
- Adding triple confluence of MA1x2, MA3x4, MA5x6
- Adding new mode to dual pivot ATF
Versione 5.60 2025.01.15
In this new Version V 5.60 :
- Adding single line feature for on chart four MA
- Adding arrow angle RSI CCI scheme
Versione 5.50 2024.12.31
In this new Version V 5.50 :
- Adding Another On Chart Four MA feature
- Adding MTF Angle RSI CCI feature
- New algo Dual Pivot ATF
Versione 5.40 2024.12.18
In this new Version V 5.40 :
- Fixing trading in the zone (TITZ)
- TITZ applied to pivot horizontal line and vertical line
- Customizing on chart four MA feature
Versione 5.30 2024.11.28
In this new Version V 5.30 :
- Fixing belt trend arrows
- Adding belt trend calculation mode
Versione 5.20 2024.11.20
In this new Version V 5.20 :
- Adding calculation mode for trading in the zone (vertical and horizontal)
- Adding Trend Bar 9TF RSIMA CCIMA (complete!)
Versione 5.10 2024.09.20
In this new Version V 5.10 :
- Adding Trend Bar 3TF RSIMA CCIMA arrows scheme
Versione 5.0 2024.09.10
In this new Version V 5.00 :
- Replay system applicable to Dual Pivot ATF
- Adding display type to Dual Pivot ATF
Versione 4.90 2024.08.26
In this new Version V 4.90 :
- Adding Dual Double CCI
- Adding DCCI calculation mode
Versione 4.80 2024.08.13
In this new Version V 4.80 :
- Deconstruct from the beginning
- Adding CCIMA indicator
- Adding triple MTF cloud histo
- Adding triple MTF confluence multi mode
- Adding trend bar 3TF RSIMA/CCIMA
- Adding dual pivot all time frame
- Adding color level scheme
- Customizing on chart feature
- Optimizing the loading time
Versione 4.70 2024.04.03
In this new Version V 4.70 :
- Fixing pivot value horizontal line trading in the zone
- Customizing Dual MTF Cloud Histo
Versione 4.60 2024.03.29
In this new Version V 4.60 :
- Changing MTF Belt Trend to Dual MTF Belt Trend
- Adding trend following feature to MTF Belt Trend
- Adding time frame scheme True RSIMA
- Customizing On Chart Dual DRSI
- Customizing On Chart Dual Stochastic
- Customizing On Chart True RSIMA
Versione 4.50 2024.03.18
In this new Version V 4.50 :

- Deleting Super Trend Arrows (only dashboard available with lines and trend bar) to optimize the rendering time
- Deleting Trend Bar 3TF of SRCM (Stoch,RSI,CCI,MACD)
- Deleting Trend Bar 3TF of MA5 x MA6
- Deleting confluence 3TF of Stochastic
- Deleting confluence 3TF of MACD
- Deleting confluence 3TF of MA1 x MA2
- Deleting confluence 3TF of DRSI
- Deleting confluence Dual Stoch
- Deleting confluence Dual MACD
- Adding MTF Belt Trend
- Adding Dual MTF Cloud Histo
- Adding 3TF True RSIMA lines
- Adding 3TF True RSIMA trend bar
- Adding 3TF True RSIMA dashboard
- Adding horizontal line trading in the zone
- Adding pivot value horizontal line trading in the zone
- Fixing vertical lines trading in the zone
- Total mode right now is 13 (previously 9)
Versione 4.40 2024.02.02
In this new Version V 4.40 :
- Adding trend bar feature of True RSIMA
- Adding dashboard feature of True RSIMA
- Adding vertical lines feature of trading in the zone
- Adding current time and broker time feature
- Modifying trend bar 3 time frame
- Fixing dashboard monitor position
- Fixing price index location
Versione 4.30 2024.01.25
In this new Version V 4.30 :
- Fixing histogram of MTF Belt Trend
Versione 4.20 2024.01.25
In this new Version V 4.20 :
- Fixing OBOS level of ATF dashboard
- Adding calculation mode of TB TRD FOL 3TF, i.e DCCI and FDMACD
- Adding histogram to MTF belt trend
Versione 4.10 2024.01.10
In this new Version V 4.10 :
- Fixing ATF Stochastic and ATF MACD
- Fixing algorithm of confluence 3TF
- Fixing algorithm of STF Dual Stochastic and Dual MACD
Versione 4.0 2024.01.03
In this new Version 4.00 :
- Adding background color to trend bar 3TF
- Adding Mode 8 : Show ATF MA 1x2 DRSI
- Adding timeframe scheme of trading in the zone
- Adding timeframe scheme of trend following STF
- Adding timeframe scheme of trend bar trend following 3TF
- Fixing dashboard of RSIMA
Versione 3.90 2023.12.22
In this new Version 3.90 :
- Deleting favorite arrows
- Adding MTF Trendbar Trend Following 3 Time Frame FDSTOCH/DRSI
- Adding MTF Trendbar Average 3 Time Frame FDSTOCH/DRSI
- Adding MTF Trendbar Trend Following 3 Time Frame MA5 x MA6
- Adding MTF Trendbar Average 3 Time Frame MA5 x MA6
- Fixing status quo of trading in the zone
Versione 3.80 2023.11.20
In this new version V 3.80 :
- I fixed the 1 minute RSIMA dashboard
- I limited the number of favorite arrow mode to three
Versione 3.70 2023.11.16
In this new version V 3.70 :
- I fixed the RSIMA dashboard
- I added favorite arrow calculation modes
Versione 3.60 2023.11.13
In this new version V 3.60 :
- I added favorite arrow feature
- I set up trading in the zone interface
- I added W1 timeframe scheme for trend following STF arrows
Versione 3.50 2023.11.06
In this new version V 3.50 :
- I changed the symbol for MACD above zero and MACD below zero level.
- I changed the code of square STF trend following.
Versione 3.40 2023.10.30
In this new Version 3.40 :
- I limited the number of candle high time frame
- I added arrow size option to trend following STF arrows
Versione 3.30 2023.10.25
In this new Version 3.30 :
- I fixed the on off button sound
- I added trend bar 9TF of STA mode 2 from current time frame (0) to previous 5 bar ago (5)
- I fixed on chart dual stochastic channel
- I fixed dashboard position
- I modified algorithm in STA mode 1 & mode 2
- I added time frame scheme for trend following STF
Versione 3.20 2023.10.19
In this new Version 3.20 :
- I changed the dashboard font so it looks clear
Versione 3.10 2023.09.25
In this new Version 3.10 :
- Reduce total mode to only 8, i.e show all time frame crossover arrows and trading in the zone
- Modifying parameter setting
- Can show all time frame crossover arrows of fast CCI and slow CCI, i.e DCCI
- Modify the status for mode 8
- Can show trend following selected time frame of fast stochastic, RSI 1x2, CCI 1x2, fast macd and RSIxMA outside the modes.
Versione 3.0 2023.09.06
In this new Version 3.00 :
- Modifying STA algorithm both for calculation mode 1 and mode 2
- Modifying dashboard color scheme
- Modifying parameter setting
Versione 2.90 2023.09.04
In this new Version 2.90, I added new features :
- Adding Mode 29 : Show ATF Fast Stoch DRSI. With this feature monitoring all time frame arrows of stochastic and RSI is easy.
- Adding STA Calculation Mode. The first mode is based on crossover of RSI & MA and the second mode is based on crossover of fast RSI & slow RSI.
Versione 2.80 2023.08.30
In this new Version 2.80, I added new feature :
- Adding Time Spread Profit Info (TSPI) indicator
Versione 2.70 2023.08.21
In this new Version 2.70, I make monitoring visually Stoch RSI easy :
- Modifying on chart dual stochastic
- Modifying on chart double rsi
- Modifying on chart rsioma
- Modifying color level
Versione 2.60 2023.08.13
In this new Version 2.60, I added new feature :
- Adding STF belt trend
- Fixing on chart range
- Changing arrow code DRSI and DCCI
Versione 2.50 2023.07.31
In this new Version 2.50, I added new feature :
- Adding confluence of 3TF MA 1x2
- Changing arrow code for trend following double CCI
- Changing arrow code for trend following double RSI
Versione 2.40 2023.07.25
In this new Version 2.40, I added new features :
- Adding confluence of 3TF Fast DSTOCH
- adding confluence of 3TF Fast DMACD
- Adding trend following STF of DRSI
- Adding STA monitor, i.e (from top to bottom) H1,H4,D1,W1,MN1
Versione 2.30 2023.07.18
In this new Version 2.30, I added new features :
- Added mode 28 : show trading in the zone
- Added 9TF double CCI dashboard monitor
- Added selected timeframe of double CCI crossover arrows
- Added STA monthly arrows
- Added three new dashboard color scheme
- Fixing STA, dual stochastic & dual MACD algorithm
Versione 2.20 2023.07.11
In this new Version 2.20, I added new features :
- Added upper bound 100 & lower bound 0 for on chart dual stochastic
- Added upper bound 100 & lower bound 0 for on chart double rsi
- Fixing trading in the zone four MA
- Added timeframe scheme for four MA
- Fixing RSIMA dashboard
Versione 2.10 2023.07.04
In this new Version 2.10 :
- Fixing DRSI arrow TF MN1
- Fixing color super trend arrows
- Fixing arrow MA 3 x MA 4
- Added timeframe scheme D1,W1,MN1 for conflux DRSI
Versione 2.0 2023.07.03
In this new Version 2.00, I added new features :
- Added confluence arrows of 3 timeframe double RSI
- Added 12 timeframe scheme to choose from for confluence of double RSI
- Fixing algorithm for trend following dual stoch and dual macd
Versione 1.90 2023.06.26
In this new Version 1.90, I added new features :
- Added super trend arrows higher timeframe
- Added MACD above or below zero level into dashboard
- Fixing MTF feature
Versione 1.80 2023.06.20
In this new Version 1.80, I've made a lot of changes :
- Change the appearance of the dashboard from a circle to a square shape.
- Fixing color OBOS of slow stochastic and slow drsi.
- Added feature on chart slow stochastic.
- Added feature pivot value of all time frame of Fast Stoch.
- Added feature pivot value of all time frame of Fast MACD.
- Added feature pivot value of all time frame of MA 1,2.
- Added feature pivot value of all time frame of Double RSI.
- Added feature pivot value of all time frame of RSIMA.
- Added feature MTF candle high time frame.
- Ability to change/shift the starting time to monitor in real time 9TF dashboard.
Versione 1.70 2023.06.02
In this new Version 1.70, I've added the ability to monitor visually :
- On chart stochastic makes it easy for us to observe the movement of stochastic main line and stochastic signal line along the OBOS channel.
- On chart four MA makes it easy for us to observe the movement of MA 1 cross MA 2 and MA 3 cross MA 4.
- On chart double RSI makes it easy for us to observe the movement of RSI fast line and RSI slow line along the OBOS channel.
- On chart true RSIMA makes it easy for us to observe the movement of RSI line and MA line along the OBOS channel.
This on chart double RSI or on chart true RSIMA will make monitoring RSI divergence much more accurate than installing RSIMA on sub window.
And also I changed the appearance of the 10 dashboard color scheme to be more attractive.
Versione 1.60 2023.05.23
In this new Version 1.60, I've made trading in the zone much more easy :
- Added four MA dashboard monitor (not just two MA!)
- Added four MA lines on chart (by default : MA 1x2 on current timeframe and MA 3x4 on M30)
- Customizable four MA lines
- Button can be located on sub window
Versione 1.50 2023.05.03
In this new Version 1.50, I've made a lot of reconstruction :
- Total mode up to 27
- New feature : Show Trend Following ATF TWOMA Filtered By Trend Following Selected TF of FAST STOCH
- New feature : Show Trend Following ATF TWOMA Filtered By Trend Following Selected TF of FAST MACD
- New feature : Show Trend Following ATF TWOMA Filtered By Trend Following Selected TF of DRSI
- New feature : Show Trend Following ATF TWOMA Filtered By Trend Following Selected TF of RSIMA
- Trend following = non repaint arrows!
- Fixing algorithm of button
- Adding color level type
Versione 1.40 2023.04.11
In this new Version 1.40, I've made a lot of reconstruction :
- Total mode up to 23
- New feature : Show Trend Following All Timeframe of Two MA
- New feature : Show Trend Following All Timeframe of Double RSI
- New feature : Show Trend Following All Timeframe of RSIMA
- New feature : Show Trend Following Selected Timeframe of Two MA
- New feature : Show Trend Following Selected Timeframe of Double RSI
- New feature : Show Trend Following Selected Timeframe of RSIMA
- New feature : Show Trend Following Selected Timeframe of Dual Stoch
- New feature : Show Trend Following Selected Timeframe of Dual MACD
- Trend following = non repaint arrows!
- Fixing algorithm of mode 21 : Show Selected TF of STOCH,MACD,TWOMA,DRSI Filtered By Trend Following RSIMA
- Parameter values can be hide/show
Versione 1.30 2023.03.30
In this new Version 1.30, I've made a lot of reconstruction :
- Added dual stochastics dashboard monitor (fast stoch = stochastic 1 and slow stoch = stochastic 2)
- Added dual macd dashboard monitor (fast macd = macd 1 and slow macd = macd 2)
- Fixing MA Phase of RSIMA
- Change arrow code
- New feature : showing trend following arrows of stochastics and macd
- Dashboard monitor can be hide
Versione 1.20 2023.03.12
In this new Version 1.20, I've made a lot of reconstruction :
- Fixing daily arrow of MACD
- Fixing arrow of RSIMA
- New algo in determining the up and down arrows
- New feature : showing arrows of Stochastic, MACD, Two MA and RSIMA at once
- Adding the RSIMA 9TF dashboard monitor
- Beautify the dashboard monitor
Versione 1.10 2023.02.27
New version 1.10 with new feature available:
- Adding the ability to filter price action by all time frame (ATF) Two Moving Average
- Adding the ability to filter price action by all time frame (ATF) Double RSI
- Adding the value of Stochastic on all time frame
- Adding the value of CCI on all time frame