
"Pair Power Index Helper MT4"は利用できません
他のZiheng Zhuangのプロダクトをチェック
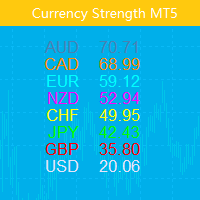
この指標は、8 つの主要通貨 (USD、EUR、GBP、AUD、NZD、CAD、CHF、JPY) の相対的な強さを示します。 力の値は 0 ~ 100 の範囲で正規化されます。 60 を超える値は強いことを意味します。 40未満の測定値は衰弱を示します。
チケット Only Show Current Pair - true の場合、現在のチャート ペアのみが表示されます。それ以外の場合は、8 つの曲線すべてが表示されます。 Bars To Show - フォース カーブを表示するバーの数。 Ma Periods To Smooth Curves : 強度曲線を平滑化するための移動平均期間 Suffix - 文字の接尾辞。今すぐインストールする必要はありません。 Font Size - 画像のフォント サイズ、デフォルトは 13 Row Space - 描画線間の間隔、デフォルトは 17 2 つの曲線が交差したときに警告を発するために、次の 3 つの入力が提供されます。 Select Cross at w

インジケーターには 2 つの部分が含まれています。
パート I: カラーキャンドルが主要なトレンドを示す
カラーローソク足とは、ローソク足の色で相場の状態を識別することです。
スクリーンショットに示されているように、色がアクアの場合、市場はロング注文を発注するか、ショート注文を終了する必要がある状態です。色がトマトの場合は、ショート注文を行うか、ロング注文を終了する時期です。
色が変化している場合は、その完了を (現在のバーが閉じるまで) 待つことをお勧めします。
パート II: バンドを描く
内側のバンドは安全領域として定義され、外側のバンドはクローズオーダー用です。
以下のような取引戦略:
色がアクアで、価格が内側のバンド内にある場合は、ロング注文を出します。価格が外側のバンドを超えたら、注文を閉じる時期です。 色がトマトで、価格が内側のバンドにある場合は、ショート注文を出します。価格が外側のバンドを越えたら、注文を閉じる時期です。 注:価格が内側のバンドの場合のみエントリーマーケットです。これは非常に重要です。
入力パラメータ ShowC

This Expert Advisor is designed to manage orders. It offers the following functions: Set a stop loss for an order having none. Set a take profit for an order having none. Close the last order if the total orders of a symbol are over the setting. Close the order if its lots are over the setting. Close the order if its profit in pips is over the setting. Close the order if its loss in pips is over the setting. Close the order if its profit in amount is over the setting. Close the order if its loss
FREE

This EA is designed to monitor the slippage of opening and closing orders, and save the records in csv file. It is useful to record the slippage and evaluate brokers. The record files are saved in the folder MT5_Data_Folder\MQL5\Files. Go to "File " --> "Open Data Folder" . Warning : Do NOT open the files directly, otherwise it will affect the exectution of EA, just copy them to another folder and open them.
Usage: Open a chart and load the EA on it, just need only one EA to run, it m
FREE

This indcator shows the trend with the color histogram. It is simple and easy to use. Usage: If the histogram changes from the aqua to the fuchsia, which means the trend is up. If the histogram changes from the fuchsia to the aqua,which means the trend is down. Inputs: MaPeriods: the periods of moving average. f1: the multiplier of inner bands f2: the multiplier of outer bands Popup Window Alert Email Alert Mobile Push Alert Alerts When the trend changes from the long trend to the short trend or
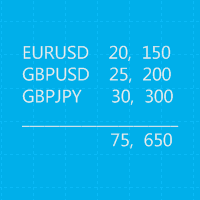
This is a MetaTrader 5 script. It helps to summarize all trades into every symbol.
Input Select Period: This is 7-option input. It includes Last Month, This Month, Last Week, This Week, Today, All History, and Date Specified. Specify Starting Date: Enter a date if you selected Date Specified in "Select Period" input. Specify Ending Date: Enter a date if you selected Date Specified in "Select Period" input. The summary is saved into a file in MQL5\Files folder. MT4 Version: https://www.mql5.c
FREE

This EA is designed to monitor the slippage of opening and closing orders, and save the records in files. It is useful to record the slippage and evaluate brokers. The record files are saved in the folder MT4_Data_Folder\MQL4\Files. Go to "File " --> "Open Data Folder" . Warning : Do NOT open the files directly, otherwise it will affect the exectution of EA, just copy them to another folder and open them.
Usage: Open a chart and load the EA on it, just need only one EA to run, it monitors a
FREE
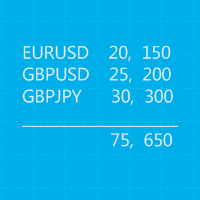
This is a MetaTrader 4 script. It helps to summarize all trades into every symbol.
Input Select Period: This is 7-option input. It includes Last Month, This Month, Last Week, This Week, Today, All History, and Date Specified. Specify Starting Date: Enter a date if you selected Date Specified in "Select Period" input. Specify Ending Date: Enter a date if you selected Date Specified in "Select Period" input. The summary is saved into a file in MQL4\Files folder. Also, there is pop-up window for
FREE
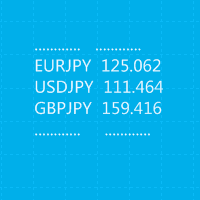
This is a MetaTrader 4 script. It helps to export all trades into a CSV file as per Symbol and selected periods.
Input Select Symbol: This is 2-option input. Select current symbol or all symbols to export its orders. Select Period: This is 7-option input. It includes Last Month, This Month, Last Week, This Week, Today, All History, and Date Specified. Specify Starting Date: Enter a date if you selected Date Specified in "Select Period" input. Specify Ending Date: Enter a date if you selected D
FREE

このアドバイザーは次の機能を提供します。 ポジションをオープンする: 価格がトレンドラインを超えたら、ロング注文またはショートオーダーをオープンします。 クローズ: 価格がトレンドラインを超えたら、ロングポジションまたはショートポジションをクローズします。 トレーリングストップロス – EA はトレンドラインに沿って、ロング注文のストップロスを増加させたり、ショート注文のストップロスを減少させ続けます。 ラインはトレンドラインでも水平線でも構いません。 傾向線は半径または線分にすることができます。線分には、その線が存在する期間のみ取引するという特別な機能があります。 ポジションをオープンおよびクローズできるこれらのラインには、特定の名前が付いています。 EA では、手動で線を描画する代わりに、線描画パネルを提供します。 すべてのオープンポジションとクローズポジションのスクリーンショットは、MQL4/Files/Cross Trend Line to Trade フォルダーに保存されます。 EAは以下で使用できます 戦略 試着室。支払う前にストラテジーテスターで試してみてください

インジケーターには 2 つの部分が含まれています。
パート I: カラーキャンドルが主要なトレンドを示す
カラーローソク足とは、ローソク足の色で相場の状態を識別することです。
スクリーンショットに示されているように、色がアクアの場合、市場はロング注文を発注するか、ショート注文を終了する必要がある状態です。色がトマトの場合は、ショート注文を行うか、ロング注文を終了する時期です。
色が変化している場合は、その完了を (現在のバーが閉じるまで) 待つことをお勧めします。
パート II: バンドを描く
内側のバンドは安全領域として定義され、外側のバンドはクローズオーダー用です。
以下のような取引戦略:
色がアクアで、価格が内側のバンド内にある場合は、ロング注文を出します。価格が外側のバンドを超えたら、注文を閉じる時期です。 色がトマトで、価格が内側のバンドにある場合は、ショート注文を出します。価格が外側のバンドを越えたら、注文を閉じる時期です。 注:価格が内側のバンドの場合のみエントリーマーケットです。これは非常に重要です。
入力パラメータ ShowC
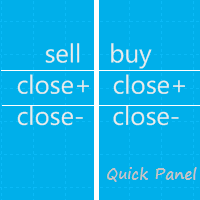
このパネルはエキスパートアドバイザーであり、6 つのグループの取引パネルを提供します。 MT5 バージョン: クイックパネルカバレッジ
特徴 ほとんどの取引操作は、これらのパネルのボタンをクリックすることで迅速に実行できます。 パネルの変更は緑色のボタンをクリックするだけで簡単に行えます。 EA はストラテジー テスターの視覚的なチャート上で実行でき、履歴データに基づいて取引を練習する簡単な方法を提供します。 マウスをクリックしてストップロスとテイクプロフィットを素早く変更します(バックテストには使用できません)
背景が黄色のパネルに平均価格を表示し、平均価格の線を描きます。 ここをクリック パネル ダッシュボードには 2 つの列が含まれています。左の列は売りに関するもので、右の列は買いに関するものです。 売る: 売り注文をオープンします。 初め: 最初の売り注文をクローズします。 1 つ目はオープンタイムを指します。 最後: 最後の売り注文をクローズします。最後のはオープンタイムを指します。 すべて+: 売り注文を利益を上げてク
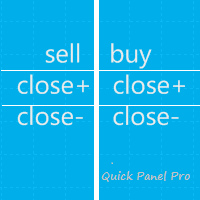
このEAは、柔軟なリスク管理と6セットの取引パネルを統合したプロフェッショナルな取引ツールです。 MT5 バージョン: Quick Panel Pro Hedging 特徴 バッチの計算はすばやく簡単です。停止線を移動すると、計算はすぐに行われます。 ほとんどの業務操作は、これらのパネルのボタンをクリックするだけですぐに完了できます。 緑色のボタンをクリックするだけで、パネルをすばやく切り替えることができます。 EA はストラテジー テスターで実行できます。この機能を使用して、戦略をトレーニングしたり確認したりできます。 (無料ですので、お試しください)。 マウスをクリックしてストップロスとテイクプロフィットを素早く変更します(バックテストには使用できません) 黄色の背景のパネルに平均価格を表示し、平均価格の線を描きます。 ここをクリック コントロールパネル ダッシュボードは 2 つの列で構成されます。左の列は売りに関するもの、右の列は買いに関するものです。 売り: 売り注文をオープンします。 最初: 最初の売り注文を閉じます。 1つ目は営業時間についてです。 最後に:
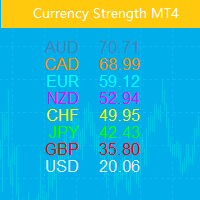
この指標は、8 つの主要通貨 (USD、EUR、GBP、AUD、NZD、CAD、CHF、JPY) の相対的な強さを示します。 力の値は 0 ~ 100 の範囲で正規化されます。 60 を超える値は強いことを意味します。 40未満の測定値は衰弱を示します。 基本原則 USD、EUR、GBP、AUD、NZD、CAD、CHF、JPYの8つの通貨ペアがあり、それぞれ2つのペアを組み合わせると合計28のペアになります。逆アルゴリズムを使用して、8つの通貨の強さを抽出します。これらの28のペアのうち EURUSD,GBPUSD,AUDUSD,NZDUSD, USDCAD,USDCHF,USDJPY,EURGBP, EURAUD,EURNZD,EURCAD,EURCHF, EURJPY,GBPAUD,GBPNZD,GBPCAD, GBPCHF,GBPJPY,AUDNZD,AUDCAD, AUDCHF,AUDJPY,NZDCAD,NZDCHF, NZDJPY,CADCHF,CADJPY,CHFJPY 主な用途 強度値が 60 を超えると強いことを意味し、40 未満は弱いことを意味します。 最も強い通貨

This indicator shows the main trend on the current chart.
Features This indicator includes two bands, one is the inner white bands, another is the outer blue bands. If the white dotted line crosses down the white solid line, this means that the trend has changed to be bearish. If the white dotted line crosses up the white solid line, this means that the trend has changed to be bullish. Once the crossing happened, it will not repaint.
Settings ShowColorCandle: if 'true', it will show the colo

This indicator shows main trend, entry zone and exit zone. This is a muti-timeframe indicator, so it is always repainting in the current period of the higher timeframe.
Features Colorful Histogram: it indicates the main trend, the tomato means the market is bearish,and the sky blue means the market is bullish. Inner Blue Bands: it is entry zone for entry market, the market is relatively safe for entry. Outer Yellow Bands: it is exit zone for exit market, the market is oversold or overbought.

このアドバイザーは、複数のペアをワンクリックで取引できるダッシュボードです。 クリック 開ける 選択したペアの注文を開くボタン。 クリック 近い 選択したペアの注文を閉じるボタン。 注文ロットはユーザーが入力した番号です。正の数は買い注文に対応し、負の数は売り注文に対応します。 部分的に閉じるのではなく、注文全体を閉じるには、 「CLOSE」 ボタンをクリックします。クロージングアクションはロット数とは関係ありません。 マジックインプットを 0 に設定すると、アドバイザーが同時に手動注文を閉じるのを手伝ってくれます。 エントリーマジックを別のアドバイザーのマジックで構成すると、アドバイザーは、別のアドバイザーがオープンした注文を同時にクローズするのに役立ちます。 三角生垣 ワンクリックで。 取引シンボルはカスタマイズ可能です。市場観察からインポートするか、ユーザーが入力します。
禁止: Magic - アドバイザーのマジックナンバー。 MaxLots: 最大ロット。ロット数がこのMaxLotsを超える場合、注文ロットはMaxLotsとなります。 StopL

This indicator is designed to show the pair power of the major 28 paris with RSI,Stochostic,and CCI. The power value is sorted from the weak to the strong. The weaker pairs: the pairs occurs at least 2 times in the top 3 rows The stronger pairs: the pairs occurs at least 2 times in the bottom 3 rows Users can add another symbol, so it can calculate 28+1 symbols. My advice: https://www.mql5.com/en/blogs/post/729880
A free EA with Pair Power Matrix --- https://www.mql5.com/en/blogs/post/732

The purpose of the inidcator is to identify the reversal point.
The blue arrow is buy signal and the yellow star is its stop loss. The red arrow is sell signal and the yellow star is its stop loss. Alert feature: if there is a signal, the indicator will send alerts of popup window,email or mobile push. Inputs: Popup Window Alert: it is false in default Email Alert : it is false in default Mobile Push Alert: it is false in default. MetaTrader 5 Version: Reversal Point Please note that the singa
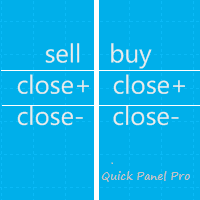
観察。このコンサルタントはヘッジ口座のみを対象としています。メタトレーダー4のバージョン Quick Panel Pro
特徴 バッチの計算はすばやく簡単です。停止線を移動すると、計算はすぐに行われます。 ほとんどの業務操作は、これらのパネルのボタンをクリックするだけですぐに完了できます。 緑色のボタンをクリックするだけで、パネルをすばやく切り替えることができます。 マウスをクリックしてストップロスとテイクプロフィットを素早く変更します(バックテストには使用できません) 黄色の背景のパネルに平均価格を表示し、平均価格の線を描きます。 ここをクリック コントロールパネル ダッシュボードは 2 つの列で構成されます。左の列は売りに関するもの、右の列は買いに関するものです。 売り: 売り注文をオープンします。 最初: 最初の売り注文を閉じます。 1つ目は営業時間についてです。 最後に: 最後の売り注文を閉じます。最後のは営業時間についてです。 all+: 利益を伴ってポジションを閉じるための売り注文。 all-: 損失で売り注文をクローズします。 max+: 最大の
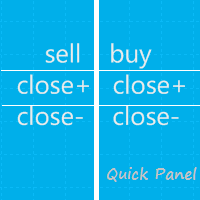
注: この EA はヘッジ口座でのみ機能します。メタトレーダー4のバージョン クイックパネル このパネルは、6 つのグループの取引パネルを提供するエキスパートアドバイザーです。
特徴 ほとんどの取引操作は、これらのパネルのボタンをクリックすることで迅速に実行できます。 パネル間の切り替えは緑色のボタンをクリックするだけで簡単に行えます。 EA はストラテジー テスターの視覚的なチャート上で実行でき、履歴データを使用して取引を練習する簡単な方法を提供します。 マウスをクリックしてストップロスとテイクプロフィットを素早く変更します(バックテストには使用できません) 背景が黄色のパネルに平均価格を表示し、平均価格の線を描きます。 ここをクリック
パネル ダッシュボードには 2 つの列が含まれています。左の列は売りに関するもので、右の列は買いに関するものです。 sell: 販売注文を開きます。 first: 最初の販売注文をクローズします。 1つ目は営業時間についてです。 last: 最後の販売注文を閉じます。最後のは営業時間についてです。

Gamma Bands This indcator shows the trend with the color histogram. It is simple and easy to use. Usage: If the histogram changes from the aqua to the fuchsia, which means the trend is up. If the histogram changes from the fuchsia to the aqua,which means the trend is down. Inputs: MaPeriods: the periods of moving average. f1: the multiplier of inner bands f2: the multiplier of outer bands Popup Window Alert Email Alert Mobile Push Alert Alerts When the trend changes for the long trend to the

The purpose of the inidcator is to identify the reversal point.
The blue arrow is buy signal and the yellow star is its stop loss. The red arrow is sell signal and the yellow star is its stop loss. Please note that the singal is against trend,it could be continual fail. Alert feature: if there is a signal, the indicator will send alerts of popup window,email or mobile push. Inputs: Popup Window Alert: it is false in default Email Alert : it is false in default Mobile Push Alert: it is false in

このアドバイザーは次の機能を提供します。 ポジションをオープンする: 価格がトレンドラインを超えたら、ロング注文またはショートオーダーをオープンします。 クローズ: 価格がトレンドラインを超えたら、ロングポジションまたはショートポジションをクローズします。 トレーリングストップロス – EA はトレンドラインに沿って、ロング注文のストップロスを増加させたり、ショート注文のストップロスを減少させ続けます。 ラインはトレンドラインでも水平線でも構いません。 傾向線は半径または線分にすることができます。線分には、その線が存在する期間のみ取引するという特別な機能があります。 ポジションをオープンおよびクローズできるこれらのラインには、特定の名前が付いています。 EA では、手動で線を描画する代わりに、線描画パネルを提供します。 すべてのオープンポジションとクローズポジションのスクリーンショットは、MQL5/Files/Cross Trend Line to Trade フォルダーに保存されます。 EA はヘッジ口座でのみ機能します
バージョンMT4 : https://www.
このアドバイザーは、複数のペアをワンクリックで取引できるダッシュボードです。 クリック 開ける 選択したペアの注文を開くボタン。 クリック 近い 選択したペアの注文を閉じるボタン。 注文ロットはユーザーが入力した番号です。正の数は買い注文に対応し、負の数は売り注文に対応します。 部分的に閉じるのではなく、注文全体を閉じるには、 「CLOSE」 ボタンをクリックします。クロージングアクションはロット数とは関係ありません。 マジックインプットを 0 に設定すると、アドバイザーが同時に手動注文を閉じるのを手伝ってくれます。 エントリーマジックを別のアドバイザーのマジックで構成すると、アドバイザーは、別のアドバイザーがオープンした注文を同時にクローズするのに役立ちます。 三角生垣 ワンクリックで。 取引シンボルはカスタマイズ可能です。市場観察からインポートするか、ユーザーが入力します。
禁止: Magic - アドバイザーのマジックナンバー。 MaxLots: 最大ロット。ロット数がこのMaxLotsを超える場合、注文ロットはMaxLotsとなります。 StopL