• 概要
  • レビュー (1)
  • コメント

AIS Kolmogorov Zhurbenko Filter MT5

5
Kolmogorov-Zhurbenkoフィルターは、スペクトル漏れを排除するように設計された特別なウィンドウ関数と見なすことができます。このフィルターは、確率的(財務を含む)時系列を平滑化するのに最適です。
このフィルターに基づくインジケーターには、以下のパラメーターが含まれています。
  • iLength-フィルターの作成に使用された元の長方形ウィンドウの周期。有効な値は2〜255です。
  • iDegree-フィルターの順序。 iDegree = 0の場合、単純な移動平均が取得されます。 iDegree = 1の場合、三角形の移動平均が得られます。次数が高いほど、スムージングとノイズ抑制が向上します。許可される値は2〜255です。また、このパラメーターは、インジケーターの最終期間= iLength + iDegree *(iLength-1)に影響します。
  • iMultiplier-フィルター値からカウントされた標準偏差の数を示す乗数。

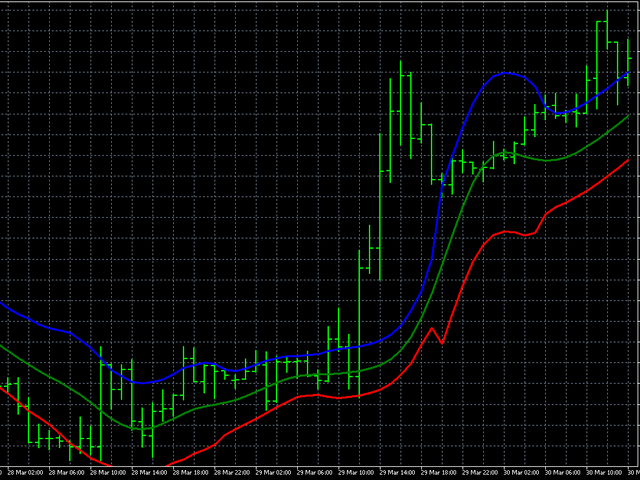
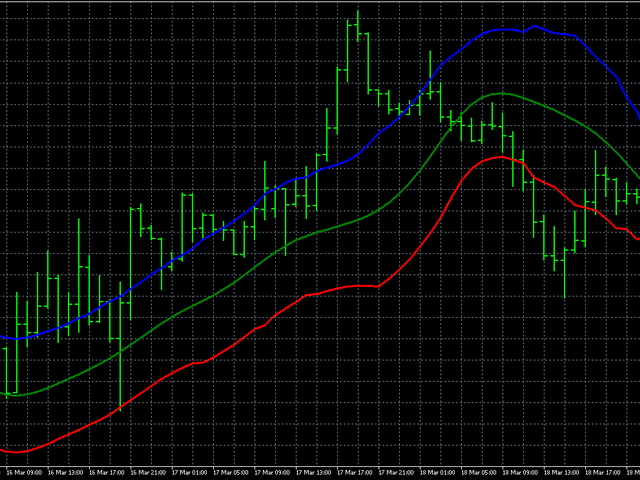
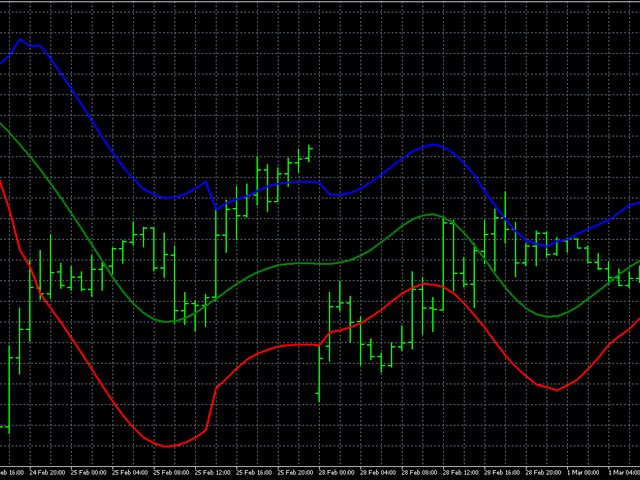
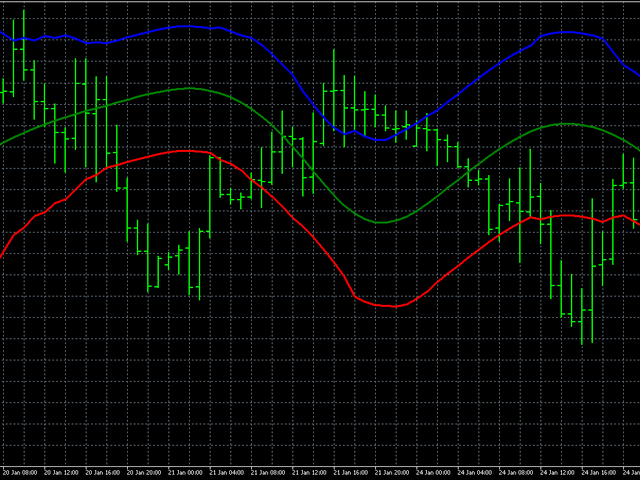
インジケーターの外観は写真に示されています。
レビュー 1
220072256
4226
220072256 2022.04.15 14:50 
 

Thanks for the availability of this good developer for helping me configure his fantastic indicators.

おすすめのプロダクト
このインジケーターは実践的なトレードに最適な自動波動分析のインジケーターです! 場合... 注:   Tang Lun (Tang Zhong Shuo Zen) の命名規則の影響で、私は波のグレーディングに西洋の名前を使用することに慣れていません。基本的な波を ペン 、二次波のバンドを セグメント と名付けました。同時に、 セグメント にはトレンドの方向が指定されます (この命名方法は将来のノートで使用されます。最初に言っておきます)。ただし、アルゴリズムは曲がりくねった理論とはほとんど関係がないため、付けるべきではありません。これは、私の市場分析 によって要約された、絶えず変化する複雑な運用ルール を反映しています。 バンドは標準化され、人によって異なることがないよう定義されており、市場参入を厳密に分析する上で重要な役割を果たす人為的な干渉の描画方法が排除されています。 このインジケーターを使用することは、取引インターフェイスの美しさを改善することと同等であり、元の K ライン取引を放棄し、取引の新しいレベルに連れて行きます。また、宣伝の観点から顧客の認識も向上します。 イ
SMC Structure Markup
Seyed Mohammad Hosseini Hejazi
5 (6)
Overview The Smart Money Structure Markup Indicator for MetaTrader 5 is a powerful tool designed to help traders identify key market structures based on popular Smart Money Concepts (SMC) strategies. This indicator detects micro-market structures, providing insights into price movements and potential trend changes. It highlights important elements such as valid Break of Structure (BOS), Change of Character (CHoCH), and Inducement (IDM), helping traders to make informed decisions. Key Features Ma
FREE
If you are unsure how to use this indicator, please feel free to reach out to me. I will explain it to you and provide reading materials to help you make the most of it. TD Sequential Scanner: An Overview The TD Sequential scanner is a powerful technical analysis tool designed to identify potential price exhaustion points and trend reversals in financial markets. Developed by Tom DeMark, this method is widely used by traders to gauge market cycles and potential turning points with precision. Ho
DYNAMIC SR TREND CHANNEL Dynamic SR Trend Channel is a simple indicator for trend detection as well as resistance/support levels on the current timeframe. It shows you areas where to expect possible change in trend direction and trend continuation. It works with any trading system (both price action and other trading system that use indicators) and is also very good for renko charting system as well. In an uptrend, the red line (main line) serves as the support and the blue line serves as the r
Descriptions A point point is a technical analysis indicator, or calculations, used to determine the overall trend of market over different time frames. This indicator calculate the highest or lowest pivots among left x and right y bars and show the high/low level during that period.   From that, you could clearly see the top resistance & bottom support level and how market goes break out. Instructions pivotLeft - pivot left bar count pivotRight - pivot right bar count pivotHighColor - color
Drawing Pack MT5
John Louis Fernando Diamante
This indicator provides several drawing tools to assist in various methods of chart analysis. The drawings will keep their proportions (according to their handle trendline) across different chart scales, update in real time, and multiple drawings are supported. # Drawing Option Description  1 Grid box draggable boxed grid, user defines rows x colums, diagonal ray option  2 Grid partial or fullscreen grid, sized by handle line  3 Grid flex a diagonal grid, sized and sloped by handle line  4 Cyc
【Super Scanner】Indicator Introduction : The color of the Super Scanner which is green and climbing up means that the price trend is going up.The color of the Super Scanner is red and going down means that the price trend is going down. It is very simple to use it to judge the market trend! What's even better is that the open parameters of the indicators allow investors to adjust. You can adjust【Super Scanner】according to your needs. Adjust it faster to be closer to short-term market fluctuatio
ROC acceleration-deceleration is the manual system for medium-term scalping. Indicator based on custom ROC system which defines bullish/bearish market and especially  acceleration-deceleration of tendention in the market's main direction. Buy arrow is plotted during bearish market when current trend decelerates and sell  arrow is plotted during bullish market when current trend decelerates. Main Indicator's Features Signals are not repaint,non-late or disappear(exept cases when system recalculat
I recommend you to read the  product's blog  (manual) from start to end so that it is clear from the beginning what the indicator offers. This multi time frame and multi symbol supply and demand zone dashboard indicator sends alerts when the price has reached a supply/demand zone. It is also possible to use it to be alerted about regular double tops/bottoms instead of zones. It can be used with all time frames from M1 to MN. Maximum 9 time frames can be shown in the dashboard at the same time. 
KT DMA is a modified and advanced version of the classic Displaced Moving Averages with buy/sell crossover alerts and a Multi-Timeframe scanner that shows DMA's direction across each real-time time frame. A Displaced Moving Average is a simple moving average that moves ahead or backward in a time frame (either short-term or long-term). It also allows you to predict price movement more accurately. Features Depicts the trend direction using the alignment of three moving averages. Buy/Sell signals
A complex of indicators of recognizing reversal moments. Detects the peaks and hollows according to the combinations of candles after they deduct from two MA. Applicable for trading systems when using early inputs. You can use a trend for scalping and intraday trade, and for detecting a trend in the early stages. Possibilities The parameters provide flexible settings for any time floms and trading tools. There are several types of warning for signals. Yellow arrow - Sell signal , pink arrow -
A useful scanner/dashboard that shows the RSI values for multiple symbols and Time-frames. It can be easily hidden/displayed with a simple click on the scanner man top left of the dashboard. You can input upper and lower RSI values and the colours can be set to show when above/below these values. The default values are 70 and 30. There are also input colours for when the RSI is above or below 50 (but not exceeding the upper/lower levels Symbols and time-frames are input separated by commas. S
To download MT4 version please click here . - This is the exact conversion from TradingView: "Linear Regression Candles" By "ugurvu". - The screenshot shows similar results from tradingview and Metatrader when tested on ICMarkets on both platforms. - The overall look of the indicator is like Heiken Ashi. - It can be used as a trend confirmation indicator to detect the right trend direction. - This indicator lets you read the buffers for Candles' OHLC. - This is a non-repaint and light processing
トレーディング フロアでの利益を最大化するための究極のツールであるトレンド エンスージアズム インジケーター (TEI) をご紹介します。 この革新的な指標は、トレンド分析の力と市場センチメントの興奮を組み合わせ、絶え間なく変化する金融市場でトレーダーに独自の優位性を提供します。 TEI は高度なアルゴリズムを使用して、金融商品の潜在的な傾向とトレーダーの熱意を分析し、高収益の機会を特定します。 これにより、トレーダーはトレンドとトレーダーの感情を組み合わせた力を利用して、最小限のリスクで一貫した利益を確保できます。 ベテランのプロでも初心者でも、TEI は収益を最大化し、ゲームで優位に立ちたいと考えている人にとって理想的なツールです。 今すぐ試して、よりスマートで収益性の高い取引を始めましょう! インジケーターはすべての時間枠で機能し、再描画しません。
Gold PL MTF - これは優れた株式テクニカル指標です。指標アルゴリズムは、資産価格の動きを分析し、フィボナッチ法 (黄金比) を使用して、指定された時間枠 (TF) の重要なピボット レベルを自動的に反映します。 指標は、選択した時間枠 (日、週、月、年) の価格軌道を完全に表し、トレンドの開始と、逆のトレンドに発展する可能性のある修正の開始を決定します。 指標はまた、価格マグネットとして機能する、さまざまな時間枠の現在の未処理のピボット レベルを表示します。これにより、市場の状況をすばやく評価し、取引の開始または終了を決定できます。各取引の潜在的可能性は、平均 50 ~ 250 ポイントです。 指標を使用すると、さまざまな時間枠での価格変動の可能性のある方向を評価でき、最も可能性の高いターゲットと価格変動の可能性も示します。 指標の利点: 1. 指標は、高精度で信号を生成します。 2. PLインジケーターのシグナルは消えず、再描画されません。GVIバッファーの確認された矢印シグナルは、トレンドが強い場合にのみ再構築できます。 3. どのブローカーのMetaTrad
ダイバージェンス検出機能を備えた高度なストキャスティクス指標 - スキャルピング MetaTrader 5 プラットフォーム向けに綿密に設計された最先端のストキャスティクス インジケーターをご紹介します。このツールには洗練されたダイバージェンス検出機能が組み込まれており、トレーダーは市場の動きを予測し、取引戦略を最適化して収益性を最大化できます。 当社のストキャスティクス指標の競争上の優位性: このインジケーターは、短期間で高精度に取引を実行したいトレーダーにとって不可欠な分析ソリューションです。その優れた感度により、目に見える差異と隠れた差異の両方を識別し、市場の重要な変曲点を早期に検出することが容易になります。これは、モメンタムベースの戦略、買われすぎ/売られすぎの状況、スキャルピングに特に効果的です。 注目の機能: 自動ダイバージェンス検出: 価格とインジケーターの不一致ポイントを正確に識別し、高い成功確率でエントリーとエグジットの機会を強調表示します。 現在の市場向けに最適化されたパラメータ: 市場の急速な動きを正確に捉えるために設計されたデフォルト設定 (%K =
Best swing
Winsou Cedric Anicet Kpanou
-- BEST SWING  -- L'indicateur BEST SWING est un indicateur technique personnalisé, un excellent outil pour négocier les cassures en fonction des niveaux de support et de résistance horizontaux. L'indicateur BEST SWING utilise une formule complexe en analysant des données de prix autrement incongrues sur les cours de clôture de chaque période, ainsi que les hauts et les bas du prix, afin de donner un aperçu de la force ou de la faiblesse de la tendance du marché et de sa probabilité
BS Time Band是一个很好的波段交易指示器,这个指标可以单独使用,但是最好是配合 StartPoint 一起使用效果更好,适用于任何时间框架,非常适合喜欢做波段交易的朋友。它能很好的体现出一个波段的完整信息,你可以很快的从这个指示器上寻找到最佳的预警区域,然后配合 StartPoint 找到最佳的buy位置和最佳的sell位置,也能很好根据指示器去坚守自己的持仓定订单。指标不含有未来函数,不会重新绘制,不仅能够应用到自己的手动交易过程中,还能完全可以写入到自己的EA中。(如果你感觉到这个指标能够帮助你进行更准确的交易,请帮忙给个好评,希望我的作品能够帮助更多有需要的人) =================参考使用方法=================== 此指标可以适用于任何交易品种。 做波段建议参数 timeFame:M5 如果配合 StartPoint 建议 StartPoint 的参数为(240,60)
It's a multi-symbol and multi-timeframe scanner for our indicator - ACB Breakout Arrows . With default settings, it scans for the buy/sell signals on 28 currency pairs and 9 time-frames concurrently.   Features It can scan 252* combinations of symbols and time-frames from a single chart. Open the signal's chart loaded with a predefined template with a single click.  Easy drag n drop anywhere on the chart. Real-time alerts with popup, sound, push-notifications and email alerts.  Input Parameter
The indicator is designed to close positions on the market in time. For example: to take profits ahead of schedule if the price has not reached TakeProfit, and the market is turning around. The indicator analyzes the momentum, not the trend. He does not give any information about the trend. The indicator is well suited for finding divergence. The Ershov 38 Parrots indicator dynamically adjusts to the market and detects price movement impulses of medium and high amplitude. It almost does not rea
Tillson's T3 moving average was introduced to the world of technical analysis in the article ''A Better Moving Average'', published in the American magazine Technical Analysis of Stock Commodities. Developed by Tim Tillson, analysts and traders of futures markets soon became fascinated with this technique that smoothes the price series while decreasing the lag (lag) typical of trend-following systems.
FREE
A fundamental technical indicator that allows you to assess the current market situation in order to enter the market of the selected currency pair in a trend and with minimal risk. This indicator was created on the basis of the original extreme search indicators, the indicator is well suited for determining a reversal or a big sharp jerk in one direction, thanks to it you will know when this will happen, he will notify you with the appearance of a blue dot for buying red for sale. It basical
Draw as many custom candles as possible on a single chart with this special indicator. Your analysis skill will never be the same again for those who know the power that having a hawkeye view of all price action at once provides. Optimized for performance and allows customization on the appearance of candle bodies and wicks. This is an integral part of analysis at our desks, we hope it will never leave your charts too once you can use it to its full potential.
A useful dashboard that shows the RSI values for multiple symbols and Time-frames. It can be easily hidden/displayed with a simple click on the X top left of the dashboard. You can input upper and lower RSI values and the colours can be set to show when above/below these values. The default values are 70 and 30. You can choose whether the dashboard is displayed on the right or left of the chart. If you want to have 2 dashboards on the same chart you must input a different name for each. The sca
FREE
VIDYA-ENHANCEDインディケータ(Variable Index Dynamic Average)は、トレンドや横ばいの動きを識別するために使用されるテクニカル分析ツールです。 VIDYA-ENHANCED は、チャンデ・モメンタム・オシレーターをボラティリティ指標と して使用し、市場のボラティリティに基づいて動的に感度を調整します。この機能により、VIDYA-ENHANCEDは値動きの激しい局面ではより機敏に、ボラティリティの低い局面ではより安定した動きを維持することができます。 特徴 - メタトレーダー標準より5つ多い12のオプションから価格を選択! - VIDYAとEMAの期間を選択。 - VIDYAラインの色、タイプ、幅を変更。
The KT Knoxville Divergence is a powerful tool that reveals unique price divergences in a financial instrument by employing a carefully crafted combination of the Relative Strength Index (RSI) and a momentum oscillator. This indicator effectively captures subtle variations in market dynamics and assists traders in identifying potentially profitable trading opportunities with greater precision. Knoxville Divergences is a type of divergence in trading developed by Rob Booker. Divergence in tradin
Breaker Block and Order Block Indicator for MT5 The Breaker Block and Order Block Indicator (BB+OB) is specifically developed for traders using ICT strategies to recognize key market zones. This tool employs a unique algorithm to detect intersections of Order Blocks and Breaker Blocks , highlighting them on the chart in green for bullish zones and brown for bearish zones on the MetaTrader 5 (MT5) platform. By utilizing this indicator, traders can improve their market entries and exits, refining
FREE
This Indicator adding power to traditional zigzag indicator. With High-Low numbers in vision it will be easier to estimate change of trend by knowing the depth of each wave. Information including points, pips, percentage%, and #bars can be displayed based on configuration. All information is real-time update. This indicator is especially useful in sideway market to buy low sell high.
Man Trend uses at its core the process of identifying the rate of change in price growth and allows you to find entry and exit points from the market. The indicator was created on the basis of the original indicators for searching for extreme points, the indicator is well suited for determining a reversal or a large sharp jerk to one of the sides, thanks to it you will know when this happens, it will notify you with the appearance of a blue dot to buy red to sell. This is a fundamental techni
CoioteCandlePVA
Alexandre Moraes De Souza Lima
5 (1)
Candle com coloração de Volume Price Analysis  (VPA) segundo as definições da Anna Coulling, é possível configurar períodos de  climax e rising, fator de extreme e fator de rising. Pode-se usar volume real ou volume de ticks. O VPA considera a variação de preço por volume do período, indicando se um movimento está recebendo ignição, está em seu climax ou se já não existe mais interesse.
FREE
このプロダクトを購入した人は以下も購入しています
Описание индикатора MONEY Индикатор MONEY предназначен для анализа волатильности и выявления значительных рыночных движений (всплесков). Он использует ATR (Average True Range) для определения момента, когда цена выходит за пределы обычного диапазона, и сигнализирует об этом трейдеру с помощью стрелок на графике. Основные параметры: • Минимальное количество свечей – задает период для анализа всплесков. • Алерты (уведомления) – включение или отключение звуковых и текстовых сигналов. • Период AT
指示する     ロシア     -        utilizar con   el indicador の ESP 推奨事項 -   TPSpro トレンド プロフェッショナル版 -   MT5のバージョン 最も重要なことは、将来においても最も重要なことです。 機能のプリンシパル: ゾーンのほとんどは、ベンダーとコンプラドールによってアクティブ化されます。 状況を直感的に把握できるよう、初期の衝動を修正します。 LOGIC AI: MUESTRA zonas (círculos) parabuscar puntos de entrada cuando se activa una plantilla 視覚的に優れた視覚効果があり、最も重要な機能がすべて揃っていることに注意してください。 優れたニベレス/ゾーンの視覚化 (modo MTF) 世界で最も人気のある場所/ゾーンです。これを使用するのに最適な方法です (   TPSproTREND PRO   )。 アルゴリズム プロフェッショナル セパラド パソ ア パソ パラ オペラ それは、オペラハウスやコントラ・デ・エラの指導におい
VERSION MT4        —        ИНСТРУКЦИЯ RUS           —        INSTRUCTIONS  ENG 主な機能: レンダリングなしで正確な入力信号! シグナルが表示されると、それは関連性を維持します。これは、シグナルを提供してからそれを変更し、その結果、入金された資金が失われる可能性があるリドローインジケーターとの重要な違いです。より高い確率と精度で市場に参入できるようになりました。矢印が表示された後、ターゲットに到達する (利益確定) か反転シグナルが表示されるまで、ローソク足に色を付ける機能もあります。 STOP-LOSS/TAKE-PROFITゾーンの表示 エントリーポイントを検索する際の視覚的な明瞭さを改善するために、最適な市場エントリーポイントが検索される購入/販売ゾーンを最初に表示するモジュールが作成されました。ストップロスレベルを操作するための追加のインテリジェントロジックは、時間の経過とともにそのサイズを縮小するのに役立ち、それによって取引に参加するときの初期リスクを軽減します(Move SL)。 より高いタイ
Quantum TrendPulse を ご紹介します。これは、   SuperTrend   、   RSI   、および Stochastic のパワーを 1 つの包括的なインジケーターに組み合わせて、取引の可能性を最大限に引き出す究極の取引ツールです。精度と効率を求めるトレーダー向けに設計されたこのインジケーターは、市場のトレンド、勢いの変化、最適なエントリー ポイントとエグジット ポイントを自信を持って特定するのに役立ちます。 主な特徴: SuperTrend 統合: 現在の市場動向に簡単に追従し、収益性の波に乗ることができます。 RSI精度: 買われすぎと売られすぎのレベルを検出し、市場の反転のタイミングに最適で、SuperTrendのフィルターとして使用されます。 確率的精度: 確率的振動を活用して、変動の激しい市場で隠れたチャンスを見つけます。SuperTrend のフィルターとして使用されます。 マルチタイムフレーム分析:   M5 から H1 または H4 まで、さまざまなタイムフレームで市場を常に把握します。 カスタマイズ可能なアラート: カスタム取引条件が満たされ
CBT Quantum Maverick 高効率バイナリーオプション取引システム CBT Quantum Maverickは、高いパフォーマンスとシンプルさを追求するトレーダー向けに設計されたバイナリーオプション取引システムです。カスタマイズの必要がなく、最適化された状態で使用を開始できます。シグナルに従うだけで、少しの練習でマスターできます。 主な特徴: シグナルの精度: 現在のローソク足を基に次のローソク足の取引シグナルを生成し、頻繁な再描画がありません。 多様な市場対応: バイナリーオプション取引に特化し、さまざまなブローカーや資産クラスに対応しています。 対応可能: Deriv Synthetic Charts :すべてのタイムフレームで使用可能。 OTCチャート :Quotex、PocketOption、Binomo、Stockity、IQOption、Exnova、OlympTrade、Deriv、Binolla、Homebrokerなどのブローカーに対応。MT5へのインポートは最初の1週間無料、その後は有料サービス。 FX、仮想通貨、商品市場 :幅広い資産利用が可能
Royal Scalping Indicator is an advanced price adaptive indicator designed to generate high-quality trading signals. Built-in multi-timeframe and multi-currency capabilities make it even more powerful to have configurations based on different symbols and timeframes. This indicator is perfect for scalp trades as well as swing trades. Royal Scalping is not just an indicator, but a trading strategy itself. Features Price Adaptive Trend Detector Algorithm Multi-Timeframe and Multi-Currency Trend Low
Timeframes Trend Scanner   is a trend analyzer or trend screener indicator that helps you know the trend in   all timeframes of selected symbol you are watching . This indicator provides clear & detailed analysis results on a beautiful dashboard, let you able to use this result right away without need to do any additional analysis. How it works Step 1: Calculate values of 23 selected & trusted technical indicators (Oscillator & Moving Average indicators) Step 2: Analyze all indicators using bes
Visual Heatmap Book Analyser This indicator monitors the market liquidity and generates colors based on order patterns, quantities, and renewal activities in the book. This allows you to visualize the order flow and identify areas of high and low liquidity and activity. The indicator uses machine learning techniques to analyze the order behavior in the book, enabling it to detect patterns and trends in orders, allowing you to make informed decisions about your trading operations. The color pale
これはMT5のインジケーターで、再描画なしで取引に参入するための正確なシグナルを提供します。 外国為替、暗号通貨、金属、株式、インデックスなど、あらゆる金融資産に適用できます。かなり正確な見積もりを提供し、取引を開始して終了するのに最適な時期を教えてくれます。1つのシグナルを処理しただけでインジケーターの元が取れた例の 動画 (6:22)をご覧ください。Entry PointsPro インジケーターの助けを借りたほとんどのトレーダーの最初の1週間の結果が改善しています。 Telegramグループ に登録してください。Entry Points Proインジケーターのメリットは次の通りです。 再描画のないエントリーシグナル 再描画されるインジケーターでは一度表示されたシグナルが削除されて大きな金銭的損失につながることがありますが、これと異なり、表示されて確認されたシグナルは消えることがありません。 エラーなしの取引開始 インジケーターアルゴリズムによって取引を開始する(資産を売買する)理想的な瞬間を見つけることができます。それを使用するすべてのトレーダーの成功率が向上します。 あら
[ MT4 Version ] Are you tired of spending months on demo or live accounts to test your trading strategies? The Backtesting Simulator is the ultimate tool designed to elevate your backtesting experience to new heights. Utilizing Metatrader historical symbol information, it offers an unparalleled simulation of real market conditions. Take control of your testing speed, test ideas quickly or at a slower pace, and witness remarkable improvements in your testing performance. Forget about wasting tim
Pro Thunder V10: バイナリーオプション取引の究極のインジケーター! Pro Thunder V10 で取引を次のレベルへ引き上げましょう!最先端の ニューラルネットワークAI技術 に基づいたこの革新的なインジケーターは、比類のない精度と信頼性を提供するよう設計されています。リアルタイムの非リペイント信号から、変動する市場条件でもシームレスなパフォーマンスまで、 Pro Thunder V10 はあなたの取引における究極のパートナーです。 主な特徴: 圧倒的な精度: 高精度の信号で市場を制覇。重要なニュースイベントを含むあらゆる市場状況で実証済み。 OTC対応: OlympTrade、Pocket Option、Quotex、Binomo、IQ Option などのプラットフォームで完璧に動作。 MT5専用: 最も先進的な取引プラットフォームである MetaTrader 5 のために特別に設計されています。 パフォーマンスダッシュボード: 勝敗や信号を直感的に追跡できる使いやすい画面。 永久アクセス: 一度の購入で、すべてのアップデートに生涯アク
MetaForecast M5
Vahidreza Heidar Gholami
5 (3)
MetaForecastは、価格データのハーモニクスに基づいて、どんな市場の未来を予測し視覚化します。市場が常に予測可能ではありませんが、価格にパターンがある場合、MetaForecastは可能な限り正確な未来を予測できます。他の類似製品と比較して、MetaForecastは市場のトレンドを分析することでより正確な結果を生成することができます。 入力パラメータ Past size (過去のサイズ) MetaForecastが将来の予測を生成するために使用するバーの数を指定します。モデルは選択したバー上に描かれた黄色の線で表されます。 Future size (将来のサイズ) 予測すべき将来のバーの数を指定します。予測された将来は、ピンクの線で表示され、その上に青い回帰線が描かれます。 Degree (程度) この入力は、MetaForecastが市場で行う分析のレベルを決定します。 Degree 説明  0 Degree 0の場合、価格の全てのピークや谷、そして詳細をカバーするために、「Past size」の入力に大きな値を使用することが推奨されています。  1 (推奨) Degre
KT Trend Trading Suite is a multi-featured indicator that incorporates a trend following strategy combined with multiple breakout points as the entry signals. Once a new trend is established, it provides several entry opportunities to ride the established trend successfully. A pullback threshold is used to avoid the less significant entry points. MT4 Version is available here  https://www.mql5.com/en/market/product/46268 Features It combines several market dynamics into a single equation to
トレンドトレーディング は、タイミングのプルバックとブレイクアウトにより、市場で起こっているトレンドから可能な限り利益を得るように設計された指標です。確立されたトレンドの中で価格が何をしているかを分析することにより、取引の機会を見つけます。 [ インストールガイド | 更新ガイド | トラブルシューティング | よくある質問 | すべての製品 ] 自信を持って効率的に金融市場を取引する むち打ちにならずに確立されたトレンドから利益を得る 収益性の高いプルバック、ブレイクアウト、早期の逆転を認識する この指標は、独自の品質とパフォーマンスを分析します 複数時間枠のダッシュボードを実装します インジケーターは再描画されていません 電子メール/音声/視覚アラートを実装します 確立されたトレンドは多くの取引機会を提供しますが、ほとんどのトレンド指標はそれらを完全に無視しています。インジケーターの解釈はかなり簡単です: (1) トレンドの変化 (2) トレンドの方向への後退 (3) トレンドの方向へのブレイクアウト 赤いダッシュ は下降トレンド中の修正です 青いダッシュ は上昇トレンド中
今、147ドル(いくつかの更新後に499ドルに増加します) - 無制限のアカウント(PCSまたはMac) RelicusRoad ユーザー マニュアル + トレーニング ビデオ + プライベート Discord グループへのアクセス + VIP ステータス 市場の新しい見方 RelicusRoad は、外国為替、先物、暗号通貨、株式、および指数の世界で最も強力な取引インジケーターであり、トレーダーに収益を維持するために必要なすべての情報とツールを提供します。初心者から上級者まで、すべてのトレーダーが成功するためのテクニカル分析と取引計画を提供します。これは、将来の市場を予測するのに十分な情報を提供する重要な取引指標です。意味をなさないチャート上のいくつかの異なる指標ではなく、完全な解決策を信じています.これは、信号、矢印 + 価格アクション情報を表示するオールインワンのインジケーターで、他に類を見ない非常に正確です。 強力な AI に基づいて、RelicusRoad は不足している情報とツールを提供して、あなたを教育し、トレーディングのプロ、成功したトレーダーにします。 ほと
This indicator is based on the mathematics of the great trader W.D. Ganna. With its help, you can easily find strong levels by analyzing swings to find the optimal entry point. The indicator works on all instruments and all timeframes. The indicator is fully manual and has control buttons. All you need to do is press the NEW button, a segment will appear, which you can place on any movement, swing or even 1 candle that you want to analyze. By placing the segment, press the OK button. A grid (th
CONTACT US  after purchase to get the Indicator Manual. Try Now—Limited Discount for the next 10 Buyers! Download the  Metatrader 4 Version Read the product description carefully before purchasing the product.  Due to regulatory restrictions, our service is unavailable in certain countries such as India, Pakistan, and Bangladesh. Disclaimer: • Our products are available only on mql5.com. • We never contact anyone or sell our products privately. • We do not provide any personal trading advice.
This indicator identifies and displays zones, as it were areas of strength, where the price will unfold. The indicator can work on any chart, any instrument, at any timeframe. The indicator has two modes. The indicator is equipped with a control panel with buttons for convenience and split into two modes. Manual mode: To work with manual mode, you need to press the NEW button, a segment will appear. This segment is stretched over the movement and the LVL button is pressed. The level is displayed
Was: $249  Now: $149   Market Profile defines a number of day types that can help the trader to determine market behaviour. A key feature is the Value Area, representing the range of price action where 70% of trading took place. Understanding the Value Area can give traders valuable insight into market direction and establish the higher odds trade. It is an excellent addition to any system you may be using. Inspired by Jim Dalton’s book “Mind Over Markets”, this indicator is designed to suit the
スイングトレーディング は、トレンドの方向のスイングと可能な反転スイングを検出するように設計された最初のインジケーターです。トレーディングの文献で広く説明されているベースラインスイングトレーディングアプローチを使用します。インディケータは、いくつかの価格と時間のベクトルを調査して、全体的なトレンドの方向を追跡し、市場が売られ過ぎまたは買われ過ぎて修正の準備ができている状況を検出します。 [ インストールガイド | 更新ガイド | トラブルシューティング | よくある質問 | すべての製品 ] むち打ちを起こさずに市場スイングの利益 インジケーターは常にトレンドの方向を表示します 色付きの価格帯は機会のベースラインを表します 色付きのダッシュは、可能な反転スイングを表します この指標は、独自の品質とパフォーマンスを分析します 複数時間枠のダッシュボードを実装します カスタマイズ可能なトレンドおよびスイング期間 電子メール/サウンド/プッシュアラートを実装します インジケータは再描画またはバックペインティングではありません Swing Tradingとは Swing Tradingは
現在33%オフ 初心者にもエキスパートトレーダーにも最適なソリューション このインジケーターは独自の機能と新しい公式を多数内蔵しており、ユニークで高品質かつ手頃な取引ツールです。このアップデートでは、2つの時間枠ゾーンを表示できるようになります。より長いTFだけでなく、チャートTFとより長いTF(ネストゾーンを表示)の両方を表示できます。すべてのSupply Demandトレーダーの皆さんのお気に召すはずです。:) 重要情報の公開 Advanced Supply Demandの可能性を最大化するには、 https://www.mql5.com/ja/blogs/post/720245 にアクセスしてください。   エントリーまたはターゲットの正確なトリガーポイントを正確に特定できれば取引がどのように改善されるか想像してみてください。新しい基盤となるアルゴリズムに基づいて構築されているため、買い手と売り手の間の潜在的な不均衡をさらに簡単に特定できます。これは、最も強い需要と供給のゾーンと、過去のパフォーマンス(古いゾーンを表示)がグラフィカルに表現されるためです。これらの機能は、最適な
LIMITED! JUST 10 COPIES AVAILABLE!  BONUS AUX VIP Club 2024 : Include EA CAP, CEP, LDH, PSC307 & AO4C to enhance the performance of this tool to its maximum potential  Click Here to Download Files   ( for users only ) FREE Trading Education Available Daily via Zoom --- For More Info or Instant Message Click link ---  https://t.me/abcdwave Transform your trading with the "Five Magic Bullets" Indicator, tailored for traders who embrace the power of Elliott Wave Chaos Theory. Spec
Was: $299  Now: $149  Supply Demand uses previous price action to identify potential imbalances between buyers and sellers. The key is to identify the better odds zones, not just the untouched ones. Blahtech Supply Demand indicator delivers functionality previously unavailable on any trading platform. This 4-in-1 indicator not only highlights the higher probability zones using a multi-criteria strength engine, but also combines it with multi-timeframe trend analysis, previously confirmed swings
市場の真の隠れたパターンを明らかにする、 PREDATOR AURORA トレーディングシステム——ハイブリッドトレーディング指標の最終ボス。ほかの人には見えないものを見てください! PREDATOR AURORAトレーディングシステムは、平凡の影にひれ伏すことを拒む人々のために設計された強力なツールです。これは単なる別の指標ではなく、あなたのチートコードです;それはあなたの不公平なアドバンテージであり、市場の動きを致命的な精度で追跡する洗練されたハイブリッドハンティングシステムです。このジャングルでは、最も強い者だけが生き残ります。自然界で最も恐ろしい捕食者からインスパイアを受けたPREDATOR AURORAは、変化する市場条件にシームレスに進化する高度な適応アルゴリズムを採用しています。影に潜む捕食者のように、市場のノイズを見抜き、他の人が決して発見できない高確率のトレーディングチャンスを明らかにします。 **主な特徴:** - **適応型ハンティングメカニズム:** 市場のボラティリティに瞬時に調整し、無慈悲な効率であらゆるトレーディング環境を支配します。 - *
TPA True Price Action indicator reveals the true price action of the market makers through 100% non-repainting signals strictly at the close of a candle! TPA shows entries and re-entries, every time the bulls are definitely stronger than the bears and vice versa. Not to confuse with red/green candles. The shift of power gets confirmed at the earliest stage and is ONE exit strategy of several. There are available now two free parts of the TPA User Guide for our customers. The first "The Basics"
Elliott Wave Trend was designed for the scientific wave counting. This tool focuses to get rid of the vagueness of the classic Elliott Wave Counting using the guideline from the template and pattern approach. In doing so, firstly Elliott Wave Trend offers the template for your wave counting. Secondly, it offers Wave Structural Score to assist to identify accurate wave formation. It offers both impulse wave Structural Score and corrective wave Structure Score. Structural Score is the rating to sh
Royal Wave Pro M5
Vahidreza Heidar Gholami
3.5 (4)
Royal Wave is a Trend-Power oscillator which has been programmed to locate and signal low-risk entry and exit zones. Its core algorithm statistically analyzes the market and generates trading signals for overbought, oversold and low volatile areas. By using a well-designed alerting system, this indicator makes it easier to make proper decisions regarding where to enter and where to exit trades. Features Trend-Power Algorithm Low risk Entry Zones and Exit Zones Predictions for Overbought and Over
Introduction to Fractal Pattern Scanner Fractal Indicator refers to the technical indicator that makes use of the fractal geometry found in the financial market. Fractal Pattern Scanner is the advanced Fractal Indicator that brings the latest trading technology after the extensive research and development work in the fractal geometry in the financial market. The most important feature in Fractal Pattern Scanner is the ability to measure the turning point probability as well as the trend probabil
Hello I Want to introduce The Forex Buy Sell Arrow Premium MT5 i recently release this premium indicator! its 1000% Non Repaint Indicator, It Work Perfectly Well,, i tested it day by day, Just mind blowing Result,  Including Powerful trend Algorithm! How It Work? well, it work market trend formula, when trend Bullish Or when trend Bearish,  Recommend Timeframe M30, H1 it work all timeframe, and all currency pair, 100% non repaint, How to take signal From Forex Buy Sell Arrow Premium Ind
Volume Profile, Footprint and Market Profile TPO (Time Price Opportunity). Volume and TPO histogram bar and line charts. Volume Footprint charts. TPO letter and block marker collapsed and split structure charts. Static, dynamic and flexible range segmentation and compositing methods with relative and absolute visualizations. Session hours filtering and segment concatenation with Market Watch and custom user specifications. Graphical layering, positioning and styling options to suit the user's a
作者のその他のプロダクト
このスクリプトは、乱数ジェネレータを使用した貿易取引のシミュレーションに基づいています。これにより、同じ入力パラメータでもまったく異なる結果を得ることができます。スクリプトを実行すると、ダイアログボックスが開き、そこで外部変数に必要な値を設定できます。 ブロックでは、TradingOptionsは取引のシミュレーションに必要な基本パラメータを定義します。 StartBalance   - トレードバランスの初期サイズを設定します。 NumberTrade   - スクリプトの実行時にモデル化される取引トランザクションの数を設定します。多かれ少なかれ有意な結果を得るためには、このパラメータが30より大きいことが必要です。 ProbilityWinning   - 勝ち取引の確率。パーセンテージで示され、1から99までの有効値。 Min.StopLoss   -  StopLossの最小値をポイントで示します。これは、取引操作をモデル化するときに使用されます。 Max.StopLoss   -  StopLossの最大値をポイント単位で設定します。 PositiveWin  - この変数
FREE
The script analyzes the history of quotes and gives recommendations on the minimum deposit. The calculations take into account the variability of prices and the standard deviation. Margin requirements for the instrument are also taken into account. The result of the script is the minimum recommended deposit for trading the given currency pair.
FREE
MinDeposit
Aleksej Poljakov
5 (1)
The script analyzes the history of quotes and gives recommendations on the minimum deposit. The calculations take into account the variability of prices and the standard deviation. Margin requirements for the instrument are also taken into account. The result of the script is the minimum recommended deposit for trading the given currency pair.
FREE
このスクリプトは、トレーダーが可能な利益と損失の比率が最適になる貿易取引の平均期間を決定できるように設計されています。 まず、貿易取引の最適期間を決定するための一般的なアプローチを見てみましょう。以下の変数を紹介します。 R   - トランザクションの結果 T   - トランザクションが開かれていた時間 W - 前のトランザクションの終了と次のトランザクションの開始の間の時間 すべてのトレーダーは、最短時間で最大の利益を得ることを目指しています。この欲求は次の簡単な表現で説明できます。 R/(T+W)→max 。 変数 T と W がトレードの合計期間と行われたトランザクションの数の両方に依存することは明らかです。トランザクションの平均期間を ATD 、トランザクションの合計数を N とします。その場合、トランザクションの平均期間は、合計の平方根に比例して増加するはずです。つまり、 ATD~√N しかし、現存する十分に根拠のある質問があります - 他の取引期間と同等の取引期間はありますか?そして、取引期間はトレーディング業務の結果にどのように影響しますか?提起された質問への回答を得るた
FREE
ストップロスとテイクプロフィットのレベルを選択すると、トレーディングの全体的なパフォーマンスに非常に強い影響を与える可能性があります。貿易取引の明白なパラメータ - 可能な勝利または予想される損失の大きさ - に加えて、StopLossおよびTakeProfitのレベルもまた、取引の予想期間、および一般的な取引の収益性に影響します。 「 AIS-ODT 」スクリプトを使用して最適なトランザクション期間をすでに決定している場合は、StopLossおよびTakeProfitレベルに関連したパラメーターの決定を始めることができます。 これを行うには、以下の手順に従います。最初に、私達は1つの方向か別の方向のすべての可能な価格偏差を決定し、一定時間内にそれらを達成する確率を計算します。その後、その規模、確率、および利益の期待値を考慮して、StopLossとTakeProfitの最も最適なレベルを計算できます。 これを行うには、目的の通貨ペアと目的の時間枠のチャートでスクリプトを実行します。プロパティウィンドウでILBパラメータを使用して、取引ポジションの希望期間を小節数で設定します。ユーティリ
FREE
このスクリプトは、乱数ジェネレータを使用した貿易取引のシミュレーションに基づいています。これにより、同じ入力パラメータでもまったく異なる結果を得ることができます。スクリプトを実行すると、ダイアログボックスが開き、そこで外部変数に必要な値を設定できます。 ブロックでは、TradingOptionsは取引のシミュレーションに必要な基本パラメータを定義します。 StartBalance   - トレードバランスの初期サイズを設定します。 NumberTrade   - スクリプトの実行時にモデル化される取引トランザクションの数を設定します。多かれ少なかれ有意な結果を得るためには、このパラメータが30より大きいことが必要です。 ProbilityWinning   - 勝ち取引の確率。パーセンテージで示され、1から99までの有効値。 Min.StopLoss   -  StopLossの最小値をポイントで示します。これは、取引操作をモデル化するときに使用されます。 Max.StopLoss   -  StopLossの最大値をポイント単位で設定します。 PositiveWin - この変数は
FREE
このスクリプトは、トレーダーが可能な利益と損失の比率が最適になる貿易取引の平均期間を決定できるように設計されています。 まず、貿易取引の最適期間を決定するための一般的なアプローチを見てみましょう。以下の変数を紹介します。 R   - トランザクションの結果 T   - トランザクションが開かれていた時間 W  - 前のトランザクションの終了と次のトランザクションの開始の間の時間 すべてのトレーダーは、最短時間で最大の利益を得ることを目指しています。この欲求は次の簡単な表現で説明できます。 R/(T+W)→max 。 変数  T  と  W  がトレードの合計期間と行われたトランザクションの数の両方に依存することは明らかです。トランザクションの平均期間を  ATD  、トランザクションの合計数を  N  とします。その場合、トランザクションの平均期間は、合計の平方根に比例して増加するはずです。つまり、 ATD~√N しかし、現存する十分に根拠のある質問があります - 他の取引期間と同等の取引期間はありますか?そして、取引期間はトレーディング業務の結果にどのように影響しますか?提起された質
FREE
The script allows selecting the required 'Filter level' value of the AIS-MTF indicator. Run the script on the required chart and selected timeframe. Once its operation is complete, the HPS.csv file will be created in the Files folder. Open the file. You will see three columns. The 'Filter lvl' column represents the value of the 'Filter level' for the AIS-MTF indicator. Am. dev. - degree and direction of the indicator's deviation from the price level (sorted in ascending order). Negative values i
FREE
This script allows selecting the TakeProfit and StopLoss levels. It analyzes the history data, and then calculates the probability of reaching a given price level. How the script works Suppose you have a trading strategy and you want to select the TakeProfit and StopLoss levels. Run the script and set the parameter: Number of Bars - the average position holding time in bars. Once the script operation is complete, the AIS-PPL.csv file will be created in the Files folder in the terminal data cata
FREE
AIS 正しい平均インジケーターを使用すると、市場でのトレンドの動きの始まりを設定できます。インジケーターのもう 1 つの重要な品質は、トレンドの終わりの明確なシグナルです。指標は再描画または再計算されません。 表示値 h_AE - AE チャネルの上限 l_AE - AE チャンネルの下限 h_EC - 現在のバーの高予測値 l_EC - 現在のバーの低い予測値 インジケーターを操作するときのシグナル 主な信号は、チャネル AE と EC の交差点です。 l_EC ラインが h_AE ラインより上にある場合、上昇トレンドが始まる可能性があります。 h_EC ラインが l_AE ラインを下回った後、下降トレンドの始まりが予想されます。 この場合、h_AE ラインと l_AE ラインの間のチャネル幅に注意する必要があります。両者の差が大きければ大きいほど、トレンドは強くなります。 AEチャンネルによる局所的な高値・安値の達成にも注意が必要です。この時、価格変動のトレンドが最も強くなります。 カスタマイズ可能な指標パラメータ インディケータを設定するには、時間枠に応じて
AIS 加重移動平均インジケーターは、加重移動平均を計算し、トレンド市場の動きの始まりを判断できるようにします。 重み係数は、各バーの特定の機能を考慮して計算されます。これにより、ランダムな市場の動きを除外できます。 トレンドの開始を確認する主なシグナルは、インジケーター ラインの方向の変化と、インジケーター ラインを超える価格です。 WH (青い線) は高値の加重平均です。 WL (赤い線) は安値の加重平均です。 WS (緑色の線) は、すべての価格ポイントの加重平均です。 オプション LH - 値を計算するバーの数。 LH をすばやく選択するには、まず、より高い時間枠の倍数である値を確認する必要があります。 たとえば、インジケータは M15 に設定されます。 次に、LHの次の値を確認します M30/M15=2 H1/M15 = 4 H4/M15 = 16 D1/M15 = 96 W1/M15=480 それらの中間の値も興味深い場合があります。
AIS Advanced Grade Feasibility インジケーターは、価格が将来到達する可能性のあるレベルを予測するように設計されています。彼の仕事は、最後の 3 つのバーを分析し、それに基づいて予測を作成することです。この指標は、任意の時間枠および任意の通貨ペアで使用できます。設定の助けを借りて、予測の望ましい品質を達成できます。 予測の深さ - 望ましい予測の深さをバーで設定します。このパラメーターは、18 ~ 31 の範囲で選択することをお勧めします。 これらの制限を超えることができます。ただし、この場合、予測レベルの「固着」(18 未満の値の場合)、またはレベルの過度の幅 (31 より大きい値の場合) のいずれかが可能です。 信頼水準 1、信頼水準 2、および信頼水準 3 - 信頼水準を予測します。 1~99の範囲で設定可能。信頼度 1 は信頼度 2 よりも大きく、信頼度 3 は最も小さくする必要があります。 これらの各レベルは、予測の深さパラメーターによって決定されるバーの数について、価格がこの値に到達する確率のパーセンテージを示します。 Color lvl
The indicator is designed to measure the price volatility. This allows determining the moments for opening or closing trade positions more accurately. High intensity of the market indicates the instability of its movement, but allows for better results. And, conversely, low intensity of the market indicates the stability of its movement. Parameters Bars to process - the number of bars to measure the price movements. A low value of this parameter allows determining the moments of rapid price mov
This indicator uses the Fibonacci p-numbers to smooth a price series. This allows combining the advantages of the simple and exponential moving averages. The smoothing coefficients depend on the level of the p-number, which is set in the indicator parameters. The higher the level, the greater the influence of the simple moving average and the less significant the exponential moving average. Parameters Fibonacci Numbers Order - order of the Fibonacci p-number, specified by trader. Valid values a
The indicator is based on the analysis of interaction of two filters. The first filter is the popular Moving Average. It helps to identify linear price movements and to smooth minor price fluctuations. The second filter is the Sliding Median. It is a non-linear filter. It allows to filter out noise and single spikes in the price movement. A predictive filter implemented in this indicator is based on the difference between these filters. The indicator is trained during operation and is therefore
This indicator studies the price action as a combination of micro-trends. All micro-trends are analyzed and averaged. Price movement is filtered based on this averaging. IP_High and IP_Low (blue and red dashed lines) show the instantaneous price movement. They display the forecast only for the current price values, taking into account only the number of bars defined by the 'Filter level' parameter. SP_High and SP_Low (blue and red solid lines) smooth the price movements with respect to history.
このインジケーターは、単純な線形平滑化プロセスを実装します。 指数平滑化の欠点の 1 つは、信号が急速に減衰することです。これにより、価格帯の長期トレンドを完全に追跡することは不可能になります。線形平滑化により、信号のフィルタリングをより正確かつ細かく調整できます。 インジケーターは、パラメーターを選択して構成されます。 LP - このパラメーターを使用すると、平滑化期間を選択できます。値が大きいほど、インジケーターが表示する長期的なトレンドが多くなります。有効な値は 0 ~ 255 です。 SP - このパラメーターはインジケーターの感度に影響します。このパラメータが大きいほど、価格系列の最後の値の影響が大きくなります.このパラメータの値がゼロの場合、インジケータは LP+1 に等しい期間の単純移動平均を表示します。有効な値は 0 ~ 255 です。
This script allows selecting the TakeProfit and StopLoss levels. It analyzes the history data, and then calculates the probability of reaching a given price level. How the script works Suppose you have a trading strategy and you want to select the TakeProfit and StopLoss levels. Run the script and set the parameter: Number of Bars - the average position holding time in bars. Once the script operation is complete, the AIS-PPL.csv file will be created in the Files folder in the terminal data cata
FREE
この指標は、中央値プロパティと移動平均プロパティの組み合わせに基づくシーケンシャルハイブリッドフィルターです。 中央値を使用すると、異常値と価格系列の値のランダムなインパルスを除外できます。同時に、メディアンフィルタは価格変動のトレンドに影響を与えず、それを変更しません。 メディアンフィルタは非線形なので、単純移動平均を使用した平均化を使用してその値を平滑化します。このアプローチにより、トレンドだけでなく、価格変動の周期的な要素もより正確に特定できます。さらに、それは価格の変化に対するインディケータの感度を高め、そしてプライスシリーズとインディケータの読みの間の遅れを減らします。これにより、指標は新しいトレンドの始まりと FL パラメーターを使用して、フィルタ古いトレンドの終わりについてかなり正確に警告することができます。 ーの深さと感度を調整できます。許容値は0から63です。同時に、 2 * FL + 1 バーを使用して指標値を計算します。したがって、FLの値が大きいほど、価格チャートの傾向が強く表示されます。
この指標は、2つの修正されたLanczosフィルタの組み合わせです。 最初のフィルターは、価格を推定するのに役立ちます。過去の値に基づいて、彼は現在のバー内で起こりうる価格変動を予測します。つまり、過去の傾向が変わらない場合の価格はどうなるかを示しています。 ウィンドウ内の価格を平滑化および平均化するための2番目のフィルタ。フィルタのレベルによって決まります。ウェイトの選択のおかげで、このフィルタは価格変動の中にある周期成分に最も積極的に反応します。 指標は EF および IF パラメータを使用して調整できます。 EF と IF の値を選択することで、トレンド価格変動の始まりに関するシグナルを得ることができます。 EF   - 指数フィルタのウィンドウサイズ。有効な値は EF = 0 ... 255 です。計算中に処理された小節の数は 2 * EF + 1 です。このパラメータが大きいほど、価格系列の過去の値の影響が強くなります。結果は実線でプロットされています。 IF   - 平均化ウィンドウのサイズを調整します。  IF = 0 ... 255 の値計算されるバーの数は 2 * I
外国為替市場における価格変動の性質を見てみましょう。これらの変動が起こる理由に注意を払わないでください。このアプローチにより、価格変動に影響を与える主な要因を特定することができます。 たとえば、EUR-USD通貨ペアのバーの始値とH1タイムフレームを考えてみましょう。これらの価格について、Lameray図(図1)を構築します。 この図では、価格変動は基本的に線形方程式に従って発生することがわかります。この方程式のパラメータを決定するために、最小二乗法を使用できます。この特定の例では、始値を変更するための方程式は次の形式を取りました。 Open [i] = 0.99989 * Open [i + 1] + 0.00013。 この式が価格変動をどの程度適切に表しているかを確認しましょう。これを行うために、線形成分を取り除き、残差を分析します(図2)。 図から明らかになるように、これらの剰余はかなり混沌としており、それらをノイズと見なすと、次の小節の始値を予測するためのかなり簡単なシステムが得られます。
この指標はより有益です。彼の研究は、市場における価格の動きが特定の色のノイズとして表現されるという仮定に基づいており、それは価格値の分布のパラメータに依存します。これにより、さまざまな角度から価格変動を分析することができ、価格変動を特定の色のノイズと見なして、市場の現在の状況に関する情報を入手し、価格の動向に関する予測を行うことができます。 インディケータの読みを分析するとき、インディケータラインの位置は考慮に入れられます - それらは現在のバーの始値の上下にそしてそれからどれだけ離れて位置しています。 ホワイトノイズ(White Noise) - このアプローチは、価格(現在と先史時代の両方)が電力で等しいと考えられているという事実によって特徴付けられ、それはそれを単純な移動平均と組み合わせます。ホワイトノイズ信号は、文字を確認している可能性が高く、現在の価格から逸脱するほど、市場のトレンドの動きが強くなります。逆に、ホワイトノイズラインが始値に近い場合、これはトレンドの終わりまたは横方向の価格変動のいずれかの証拠です。 フリッカーノイズ(Flicker Noise)はトレンドの上
「 AIS Color Noise Filter 」指標のいくつかの欠点にもかかわらず、それを使用して価格系列と予測価格を平滑化するという考えは非常に魅力的に見えます。 これはいくつかの理由によるものです。 第一に、いくつかのノイズ成分を考慮に入れることは、互いに独立した要因について予測を構築することを可能にし、それは予測の質を改善することができる。 第二に、価格系列の雑音特性は全履歴を通して非常に安定して振舞い、それは安定した結果を得ることを可能にする。 そして最後に、ノイズの変動性により、予測システムが非常に敏感になり、価格の変化に対する反応が非常に速くなることを期待できます。 その結果、すべての単純化にもかかわらず、価格が移動するチャネルを正確に予測できるという指標が得られました。この指標の主な利点は、その高速さと習得の容易さです。主な不利点は、指標が予測に最も重要な要素を選択できないことです。 LH は、予測が行われる履歴データの長さを設定するパラメータです。その許容値は0から255ですが、標識が処理する小節の数はこのパラメーターで指定された数より1単位以上多いです。 
非常に頻繁に、金融シリーズの研究でそれらの平滑化を適用します。平滑化を使用すると、高周波成分を除去することができます - それらはランダムな要因によって引き起こされているため、無関係であると考えられています。平滑化には常に、データを平均化する何らかの方法が含まれます。この方法では、時系列のランダムな変化が相互に吸収します。ほとんどの場合、この目的のために、指数平滑法と同様に単純または加重移動平均法が使用されます。 これらの方法にはそれぞれ、長所と短所があります。したがって、単純な移動平均は単純で直感的ですが、その適用には時系列の周期成分と傾向成分の​​相対的な安定性が必要です。さらに、信号遅延は移動平均の特性です。指数平滑法はラグ効果がありません。しかし、ここでも欠陥があります - 指数平滑化は、系列をランダムな異常値と整列させる場合にのみ有効です。 単純平均と指数平均の間の妥当な妥協点は、加重移動平均の使用です。しかしながら、特定の重量値を選ぶという問題がある。これをまとめてみましょう。 それで、最初に私達が平滑化手順から達成したいことを定義します: •まず、価格系列からランダムな
長期の非ランダム成分を分離するためには、価格がどれだけ変化したのかだけでなく、これらの変化がどのように発生したのかも知る必要があります。言い換えれば - 私たちは価格レベルの値だけでなく、これらのレベルが互いに置き換わる順序にも興味があります。このアプローチを通して、ある時点での価格変動に影響を与える(または影響を与える可能性がある)長期的で安定した要因を見つけることができます。そしてこれらの要因の知識はあなたが多かれ少なかれ正確な予測をすることを可能にします。 金融系列の分析からどの程度具体的な結果を得たいのかを判断しましょう。 •まず、トレンドが市場に存在する場合は、そのトレンドを強調する必要があります。 •次に、定期的な要素を特定する必要があります。 •第三に、結果は予測に使用するのに十分安定しているべきである。 •そして最後に、私たちの分析方法は現在の市場の状況に適応するはずです。 指定された条件を満たすために、相対的な価格変動の回帰分析を使用し、このモデルに基づいて指標を作ります。この指標のアルゴリズムは履歴データからの学習に基づいており、その作業はトレーダーの完全な管理下
強力な分析方法の1つは、Levyプロセスを使用した金融シリーズのモデリングです。これらのプロセスの主な利点は、最も単純なものから最も複雑なものまで、膨大な数の現象をモデル化するために使用できることです。市場におけるフラクタルな価格変動の考えは、レヴィ過程の特別な場合にすぎないと言えば十分でしょう。一方、パラメータを適切に選択すると、どのLevyプロセスも単純な移動平均として表すことができます。図1は、フラグメントを数倍に拡大したLevyプロセスの例を示しています。 価格チャートを滑らかにするためにLevyプロセスを使用する可能性を考えてみましょう。まず、線形プロセスをシミュレートするために使用できるように、Levyプロセスのパラメータを選択する必要があります。それから、異なる符号の係数を含む重みのシステムを得ます。このおかげで、私たちは財務範囲を平準化するだけでなく、そこに存在する反トレンドと定期的な要素を追跡することもできるでしょう。 インジケータの動作は、パラメータ LF を選択することによって設定されます。分析されるストーリーの深さを決定します。このパラメーターの許容値は、0か
非常に頻繁に、トレーダーは価格が近い将来に変化する可能性がある範囲を決定するという課題に直面しています。この目的のために、ジョンソン分布タイプSBを使用することができます。この配布の主な利点は、少量の累積データでも使用できることです。この分布のパラメータを決定する際に使用される経験的アプローチにより、価格チャネルの最大レベルと最小レベルを正確に決定することができます。 これらの値はさまざまな状況で使用できます。たとえば、マーケットオーダーのストップロスやテイクプロフィットレベル、未決注文のエントリーポイントを設定するために使用できます。また、これらのレベルはトレーリングストップを使用するときに方向付けることができます。さらに、十分に大きい履歴では、インディケータは上昇トレンドまたは下降トレンドの始まりを知らせることができます。そのような傾向があったならばまあ、またはその終わりについて。 この指標の主な不利な点は、価格の排出に対する極めて高い感度と、市場の状況の変化に対する反応がやや遅いことです。 青と赤の線は、それぞれ価格チャネルの最大値と最小値を示しています。緑色の線は、特定の市場
この指標により、価格がいずれかのレベルに達する可能性を判断できます。そのアルゴリズムは非常に単純で、特定の通貨ペアの価格レベルに関する統計データの使用に基づいています。収集された履歴データのおかげで、現在のバーの間に価格が変化する範囲を決定することが可能です。 そのシンプルさにもかかわらず、この指標は取引において非常に貴重な支援を提供できます。そのため、トレーディングポジションのTakeProfitレベルとStopLossレベルを決定することができます。保留中の注文の価格の決定と、TrailingStopの価格レベルの決定の両方に役立ちます。 さらに、この指標は既存の戦略に統合できます。たとえば、ある種の日中戦略を使用します。次に、D1時間枠でこのインジケーターを設定することで、新しいトレーディングポジションを開くことは既に望ましくないことを克服した後、レベルを取得できます。 このインディケーターの主な欠点は、純粋に履歴データに依存しており、特定の現在の市場の変化にまったく反応しないことです。 このインディケーターの設定は、入力パラメーター-L1 ... L4-を選択することにより実
持続可能な分布は、金融シリーズをスムーズにするために使用できます。かなり深い履歴を使用して分布パラメーターを計算できるため、場合によっては、このような平滑化は他の方法と比較してさらに効果的です。 図は、10年間のH1時間枠でのEUR-USD通貨ペアの始値の分布の例を示しています(図1)。魅力的ですね。 この指標の根底にある主な考え方は、価格の分散によって持続可能な分布のパラメーターを決定し、データを使用して金融シリーズを平滑化することです。このアプローチのおかげで、平滑化された値は、特定の市場状況で最も可能性の高い価格値になる傾向があります。 インジケータの動作は、パラメータLBを使用して設定されます。その値は、バーで表される平滑化されたシリーズの長さを決定します。また、許容値は1〜255の範囲です。 青い線は平滑化された高値を示し、赤線は安値を示し、緑の線は終値を示します。 このインジケーターの主な欠点は、インジケーターが履歴のすべての部分で等しく安定するように、スムージングウィンドウの幅を設定できないことです。したがって、トレーダーは特定の要件に合わせてパラメーターを選
フィルタ:
220072256
4226
220072256 2022.04.15 14:50 
 

Thanks for the availability of this good developer for helping me configure his fantastic indicators.

レビューに返信