Super Spread Spreed MT5
- インディケータ
- Mariia Logvinenko
- バージョン: 1.0
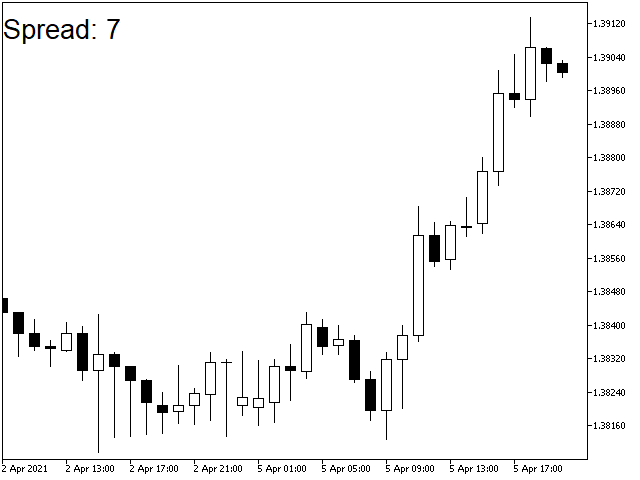
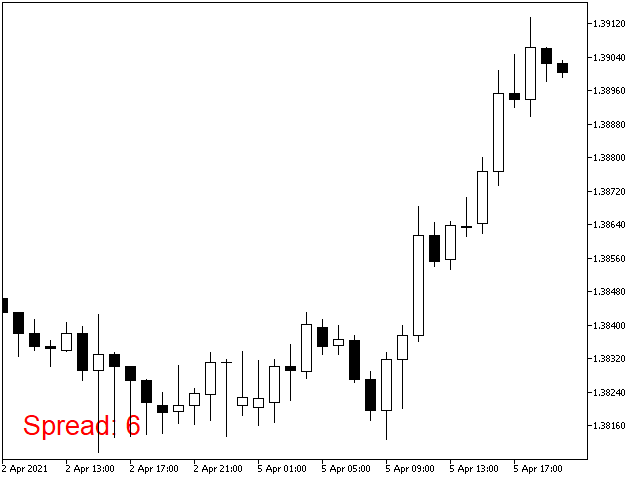
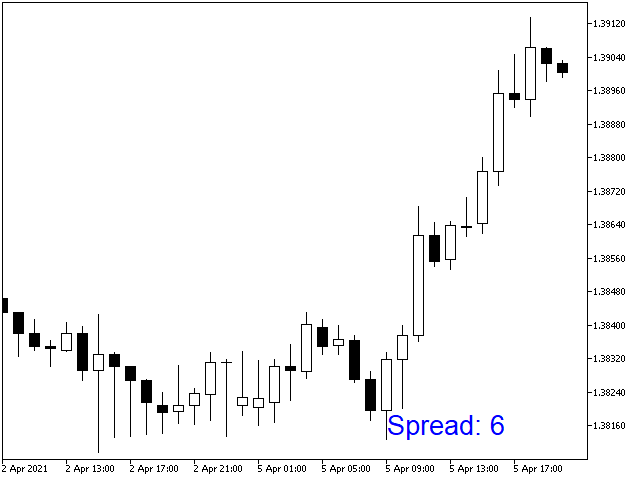
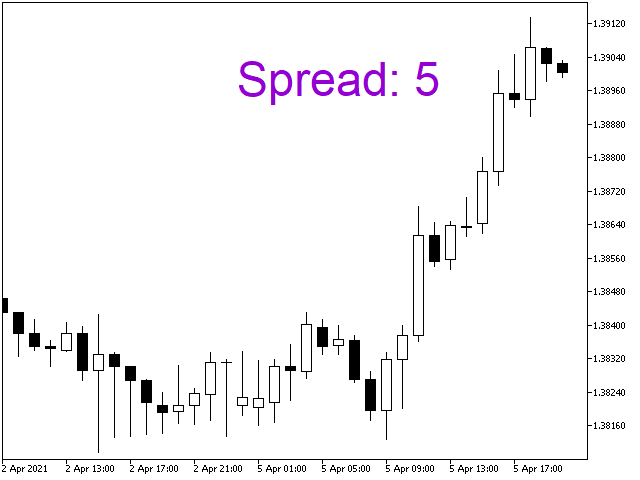
The indicator displays the size of the spread for the current instrument on the chart. Very flexible in settings. It is possible to set the maximum value of the spread, upon exceeding which, the color of the spread label will change, and a signal will sound (if enabled in the settings). The indicator will be very convenient for people who trade on the news. You will never enter a trade with a large spread, as the indicator will notify you of this both visually and soundly.
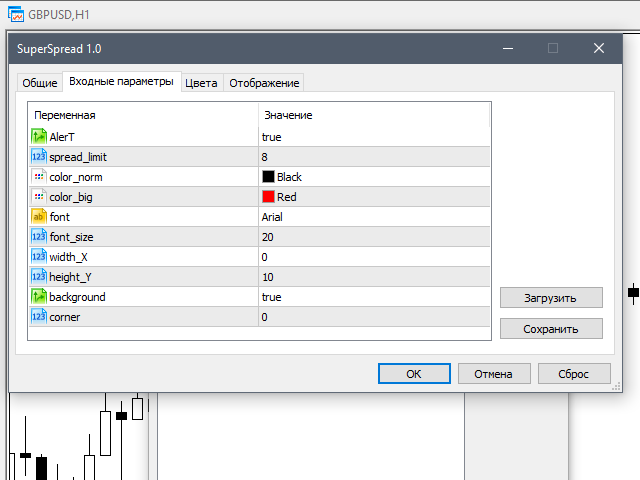
Input parameters:
AlerT - true - a sound alert is turned on when the spread limit is exceeded
spread_limit - maximum spread, above which the signal sounds and the color changes
color_norm - normal spread color
color_big - high spread color
font - font
font_size - font size
width_X - X coordinate
height_Y - Y coordinate
background - true - display in the background
corner - in which to display the inscription


To my surprise, this is ONE OF THE MOST ACCURATE SCALPING INDICATORS I HAVE EVER USED!!! You see, It works as a scalping hint like this: Configure it very near to the edge of the security's spread threshold. When the sound alert starts to chime franticly, open the position (long if you are in a bullish candle, short if you are in bearish). And just wait 'till it goes up or down a little, as expected. Make sure you don't get greedy with a lot of pips to get the profit, remember, you are scalping. And voilá! Scalping made easy and accurately!!! Maybe the author can turn this into an beast of a Scalping EA?? (I don't know, putting the chimes per second as an indicator for the EA to open a position). Good job Mariia!