Super Spread Spreed
- インディケータ
- Mariia Logvinenko
- バージョン: 1.0
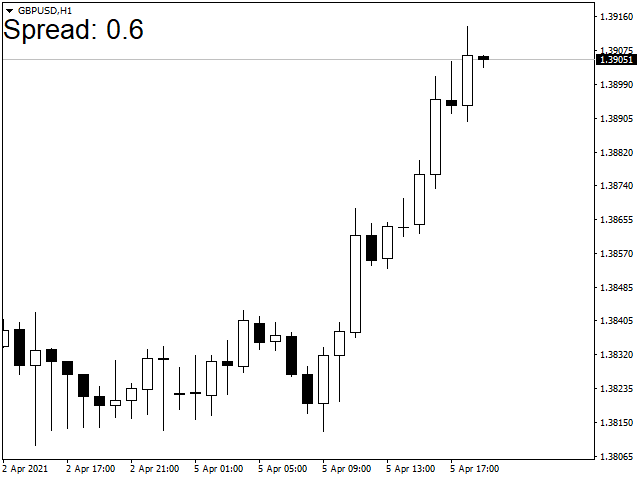
The indicator displays the size of the spread for the current instrument on the chart. Very flexible in settings. It is possible to set the maximum value of the spread, upon exceeding which, the color of the spread label will change, and a signal will sound (if enabled in the settings). The indicator will be very convenient for people who trade on the news. You will never enter a trade with a large spread, as the indicator will notify you of this both visually and soundly.
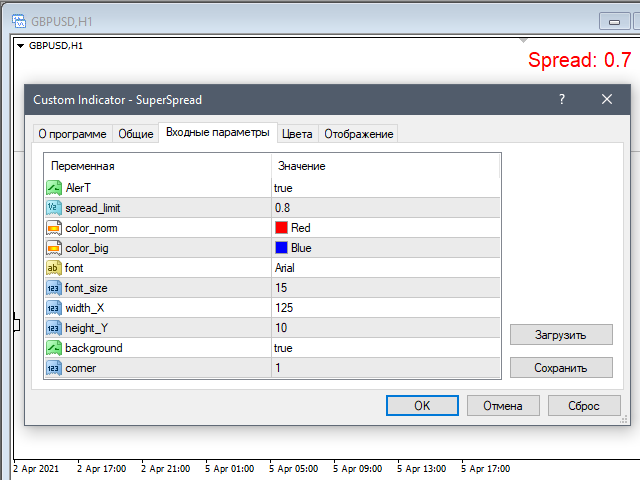
Input parameters:
AlerT - true - a sound alert is turned on when the spread limit is exceeded
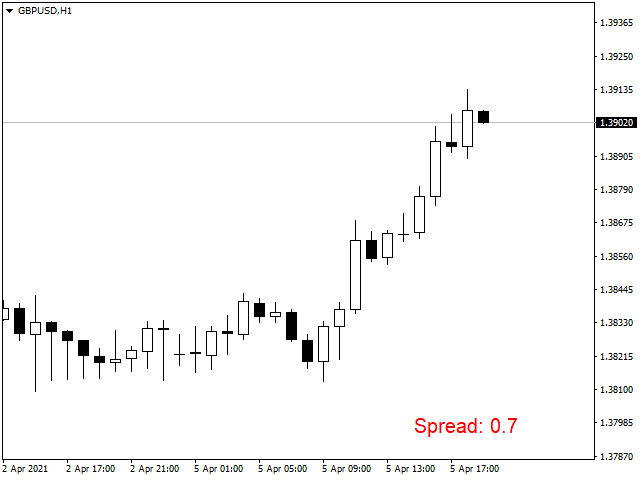
spread_limit - maximum spread, above which the signal sounds and the color changes
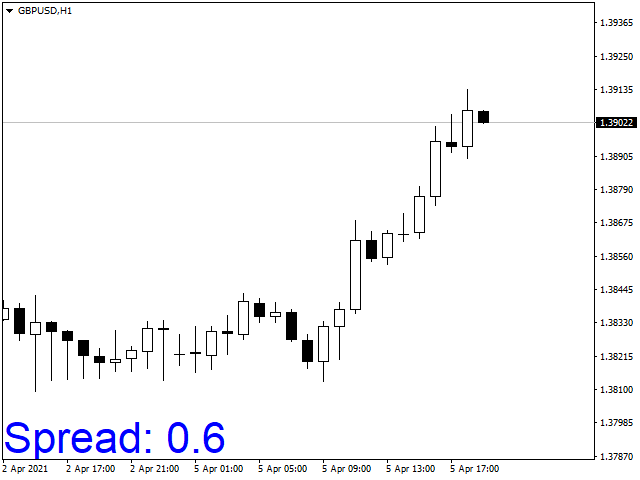
color_norm - normal spread color
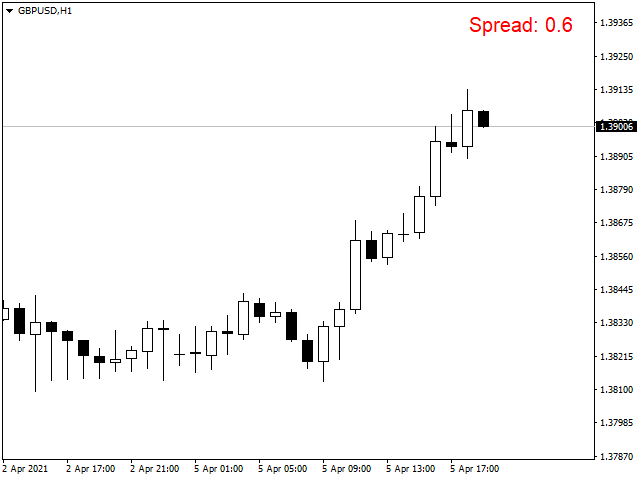
color_big - high spread color
font - font
font_size - font size
width_X - X coordinate
height_Y - Y coordinate
background - true - display in the background
corner - in which to display the inscription
ES BUENO