• 概要
  • レビュー (17)
  • コメント (26)

KT Renko Live Charts MT5

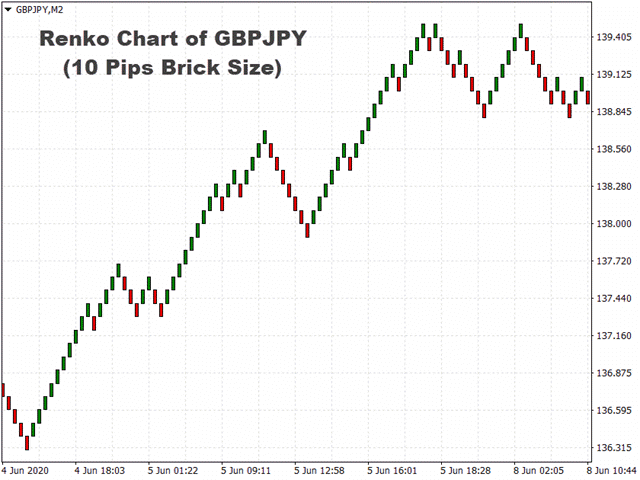
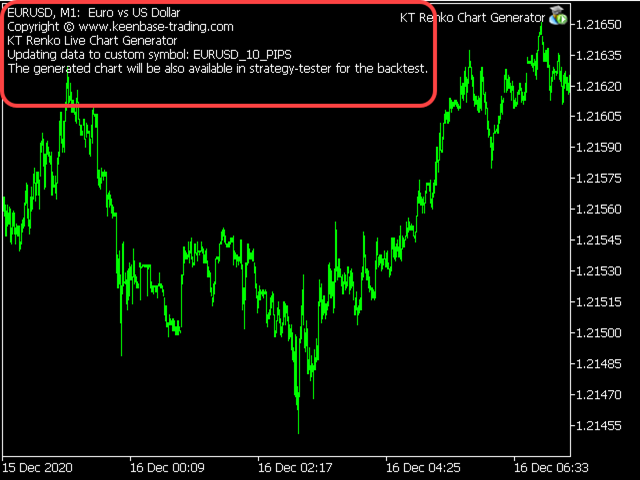
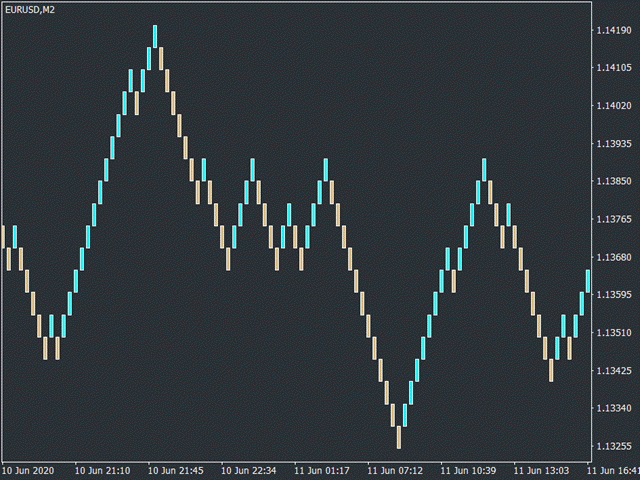
KT Renko Live Chart ユーティリティは、MT5 上で Renko チャートを生成するためのツールです。生成された Renko チャートは、投機目的の分析だけでなく、リアルタイムの自動売買にも使用できます。このユーティリティで作成された Renko チャートは、多くのカスタムインジケーターおよび自動売買EAと互換性があります。

当社の Renko Patterns インジケーターおよび Renko Patterns EA と完全に互換性があります。


機能

  • 複雑な設定不要のシンプルな Renko チャート作成ユーティリティ。MT5 上ですぐに使えます。
  • 多くのカスタムインジケーターや EA に対応し、完全自動売買に活用可能です。
  • 戦略テスターを使用して、Renko チャート上でのバックテストが可能です。 
  • Renko のヒゲ(ウィック)をオン/オフで切り替えられます。

入力パラメーター

  • レンコボックスサイズ(pips): チャート作成に使用するブリックサイズ(pips)を入力してください。
  • ヒゲの表示: レンコウィックの表示をオン/オフ切り替え。

トラブルシューティング

Q. Renko チャートに新しいティックが表示されません。

A. 親チャートとオフラインチャートの両方を閉じ、MetaTrader を再起動してから、再度チャートを生成してください。


Q. チャートが未完成または歪んで表示されます。
A. 選択したブリックサイズに対して十分な過去データが親チャートにあることを確認してください。


Q. なぜ Renko チャートに取引ポジションが表示されないのですか?
A. MT5 は Renko チャートを別のシンボルとして扱います。インジケーターや EA の使用は可能ですが、ポジションは元のチャートでのみ表示されます。

おすすめのプロダクト
Gino Renko
Stephane, Andr Valette
1 (1)
Another renko-based indicator. It returns different usable values ​​for an EA, and is directly displayed on the main chart. Its setting is very simple: The size of the renko The number of bars taken into account The falling color The color on the rise Returned values: Buffer 0 : Value of the middle Buffer 1 : Value of the Top Buffer 2 : Value of the Bottom Buffer 3 : Direction of renko (0.0 for top ; 1.0 for bottom) Buffer 4 : Ratio of the renko, for example, if it is twice, 3 times, ro more of
Renko Plus
Eadvisors Software Inc.
With Renko Plus you can use the features in the Indicator functionality, just add it to the Metatrader5 chart.             The Renko chart is a type of chart, developed by the Japanese, that is constructed using price movement rather than standardized prices and time intervals like most charts. It is believed to be named after the Japanese word for bricks, "renga", as the graphic looks like a series of bricks.             A new brick is created when the price moves a specified pri
Gino Renko EA
Stephane, Andr Valette
Here is an EA based on the Renko indicator, it can be used with currencies, commodities, and forex. Just associate it with the corresponding graph. The indicator used for the EA is available here, but it is not necessary for its operation, they are 2 independent products: https://www.mql5.com/fr/market/product/87852?source=Site +Market+MT5+Indicator+Search+Rating006%3agino+renko Personally I don't like renko like EA, and I haven't done any tests to find out which configuration is the best. Th
Advanced 4xZeovo MT5 Indicator (MetaTrader 5)   Product Description  4xZeovo is a powerful trading indicator system monitoring 24/7 financial markets. Metatrader5 tool designed to find the best buying/selling opportunities and notifies the user.    Making life easy for traders in helping with the two most difficult decisions with the use of advanced innovate trading indicators aiming to encourage users to hold the winning positions and take profit at the best times.    Equipped with a unique tra
This SMT (Smart Money Technique) divergence indicator identifies discrepancies in price movement between two different trading symbols, helping traders detect potential market reversals. This tool compares the price action of two correlated assets, such as two currency pairs or indices, to spot divergences where one asset's price moves in the opposite direction of the other. For example, while one symbol may be making higher highs, the other might be making lower highs, signaling a divergence. T
FREE
Introduction to Smart Renko The main characteristics of Renko Charting concern price movement. To give you some idea on its working principle, Renko chart is constructed by placing a brick over or below when the price make the movement beyond a predefined range, called brick height. Therefore, naturally one can see clear price movement with less noise than other charting type. Renko charting can provide much clearer trend direction and it helps to identify important support and resistance level
O Alpha B3 Renko Trader  é um robô especialista para negociação no Bovespa B3  (miniíndice e minidólar) que une a análise de candlesticks do gráfico Renko (calculado internamente, sem imagens gráficas) com a estratégia Alpha B3 . O robô permite configurar, para os sinais de entrada, o tamanho do brick do gráfico Renko, bem como um número de candlesticks para análise. Além disso, você deve configurar os stops fixos, em pontos. O robô permite também a configuração de funções, tais como número de c
Macd Rsi
Ignacio Agustin Mene Franco
macd rsi It is a macd indicator added to the rsi to capture perfect entries in the average crossovers! As seen in the indicator, it has 2 lines, one of gold color and the other violet line, where the cross of the violet with the gold downwards is a sell signal when it crosses the violet up from the gold it is a buy signal! very good to make shorts works for forex markets and synthetic indices It is used in any temporality! Good profit! World Investor.
HLC bar MT5 Wyckoff
Eduardo Da Costa Custodio Santos
MT5のインジケーター「HLC_bar_MT5Wyckoff」は、取引時の分析を容易にするために作成されました。 HLCバーはRichardWyckoffによって使用され、現在「VSA」操作で広く使用されています。 Wyckoffは、High、Low、およびCloseを使用すると、グラフがはるかにクリーンになり、分析が容易になることを発見しました。 区分 "HLC_bar_MT5 Wyckoff"により、以下が可能になります。 #バーの幅を変更します。 #バーを同じ色のままにします。 #そして、同じ価格で開閉したバーを強調表示します。 色と幅は設定で簡単に変更できます インジケーターを使用するには、インジケーターをチャートにドラッグするだけです。
This indicator uses a mathematical calculation algorithm . This algorithm calculates the remainder between the updated model and the actual values and produces the possible progress of the graph on the graph. It is not a super prophet in trading, but it is very good for the trader when entering the market and to analyze it before entering. Applicable for all currencies. Данный индикатор использует алгоритм математических вычислений . Данный алгоритм вычисляет остаток между обновленной моделью и
All about time and price by ICT. This indicator provides a comprehensive view of ICT killzones, Silver Bullet times, and ICT Macros, enhancing your trading experience.  In those time windows price either seeks liquidity or imbalances and you often find the most energetic price moves and turning points. Features: Automatic Adaptation: The ICT killzones intelligently adapt to the specific chart you are using. For Forex charts, it follows the ICT Forex times: In EST timezone: Session: Asia: 20h00-0
Auto Channel Trader
Ross Adam Langlands Nelson
The Auto Channel Trader creates a channel by plotting a line along the high points and low points of the chart, the EA then makes long trades near the bottom of the channel and short trades near the top of the channel. The channel is created by finding high points for the top line and low points for the bottom line, these points are shown with arrows. A line of best fit is then plotted through these points and extended until the end of the chart.  The length of the channel is determined by the M
Bands are a form of technical analysis that traders use to plot trend lines that are two standard deviations away from the simple moving average price of a security. The goal is to help a trader know when to enter or exit a position by identifying when an asset has been overbought or oversold. This indicator will show upper and lover bands. You can change input parameters nPeriod and  nMethod to calculate those bands for each timeframe. Aqua clouds represent up or down trends.
This non-trading expert utilizes so called custom symbols feature ( available in MQL API as well) to build renko charts based on history of real ticks of selected standard symbol. RenkoFromRealTicks generates custom symbol quotes, thus you may open many charts to apply different EAs and indicators to the renko. It also transmits real ticks to update renko charts in real time. The generated renko chart uses M1 timeframe. It makes no sense to switch the renko chart to a timeframe other than M1. T
小さな価格変動をフィルタリングし、大きなトレンドに焦点を当てる . Renkoチャート指標は、小さな価格変動をフィルタリングして、全体のトレンドに集中する手助けをします。 価格が指定された量だけ動くことで、Renkoブロックが作成されます。 これにより、価格が動いている現在のトレンド方向を簡単に特定できます。 多機能ユーティリティ : 66以上の機能を含む  |   ご質問があればご連絡ください   |    MT4バージョン インジケーターの設定で、次のように設定できます: 計算設定: ブロック サイズの 計算 方法 : ピップ   / ポイント; ブロックサイズ; 計算に 使用される 時間枠 ; インジケーターのスタイル: ブロックの色; プログラムファイルは " Indicators " ディレクトリに配置してください。
This MT5 indicator provides real-time updates of classic Renko charts. Renko charts focus on price movement, filtering out noise and highlighting trends. What are Renko candles? Renko charts display price movement using "bricks" of equal size, ignoring time. A new brick is drawn only when the price moves by a specified amount. They help visualize trends by removing time-based noise. Parameters - BrickSizePoints  (20): Renko brick size in points - HistoryDepthSec  (3600): Historical data to ini
FREE
Renko Builder GLX1
Eranga Thilina Dhanushka Gallage
GLX1 Renko Builder   Expert Advisor (EA) can create the Renko bar charts on any symbol. The Renko charts are generated as real-time custom symbol charts which can be further used for technical analysis with any MT5 compatible indicator.  Find the free   GLX1 Renko Euro   Expert Advisor from here.  https://www.mql5.com/en/market/product/115074 Included Features: Truly responsive Renko Charting on a custom symbol chart Accurate automatic live chart update Ability to attach any MT5 indicator Abi
数列の一つに「森林火災数列」があります。これは、最も美しい新しいシーケンスの 1 つとして認識されています。その主な特徴は、このシーケンスが線形トレンドを回避することです。最短のものであってもです。この指標の基礎を形成したのはこのプロパティです。 財務時系列を分析する場合、この指標は可能なすべての傾向オプションを拒否しようとします。そして失敗した場合にのみ、トレンドの存在を認識し、適切なシグナルを発します。このアプローチにより、新しいトレンドの始まりの瞬間を正しく判断できます。ただし、偽陽性の可能性もあります。それらの数を減らすために、このインジケーターに追加のフィルターが追加されました。新しいバーが開くとシグナルが生成されます。いずれの場合も再描画は発生しません。 指標パラメータ: Applied Price   - 適用価格定数; Period Main   - インディケータのメイン期間、その有効な値は 5 ~ 60 です。 Period Additional   - 追加の期間。このパラメーターの有効な値は 5 ~ 40 です。 Signal Filter   - 追加の信号
Fibo Expertt
Ignacio Agustin Mene Franco
Fibo expert! It is an automatic fibonacci indicator. adapting to any temporality, to catch those rebounds, or the path of that trend, special to make longs in H1 or H4 clear the trend, but it also works for scalp in m1 up to m15 works for all forex pairs and for all pairs of synthetic indices, ideal for volatility 75 in synthetics no more to enjoy good profit World Investor.
Indicador "MR BEAST - Detectador de Mejores Spikes" para el Índice BOOM1000 (M1) El indicador "MR BEAST - Detectador de Mejores Spikes" es una herramienta especializada y altamente precisa diseñada exclusivamente para operar en el índice CRASH 1000, con un enfoque específico en el marco temporal de 1 minuto (M1). Desarrollado por el reconocido trader Mr. Beast, este indicador ha sido meticulosamente diseñado para identificar únicamente los mejores spikes, permitiendo a los operadores capitalizar
The Expert Advisor is used to create Renko chart, realtime updates, easy for technical analysis. Backtest your strategy with all indicators with Renko chart in MetaTrader 5. Parameters Box Size : input the number of box size. Show Wicks : if true , draw a candle with high/low. History Start: input the date to creat first candle. Maximum Bars: limit number of bars on renko chart How to use Attach the Expert Advisor to a chart (timeframe M1), for which you want to create a renko. Input box size a
Easy Trade Panel Expert for MT5 The Easy Trade Panel is a specialized tool designed for risk control and capital allocation in trading. This expert includes two sections: the first focuses on order execution, position sizing, and risk-reward configuration, while the second is dedicated to trade management. «Indicator Installation & User Guide» MT5 Indicator Installation  |  Order Block Indicator for MT4  | ALL Products By   TradingFinderLab  | Best MT5 Indicator:   Refined Order Block Indicator
FREE
Do you find it difficult to track and manage your open positions across multiple different symbols in MetaTrader 5? Do you need a quick and comprehensive overview of your current market exposure and the performance of each symbol individually? The "Dynamic Exposure Table" indicator is your ideal tool! This indicator displays a clear and detailed table in a separate window below the chart, summarizing all your open positions and intelligently grouping them by symbol, giving you a complete view of
Point Black
Ignacio Agustin Mene Franco
Black Card Pack indicator 5/1 point black It has the strategy of professional bollingers where each arrow gives you a different entry signal. It is used to operate in m1 and in d1 It is used for scalping and intraday, modified for forex markets ! suitable for all pairs modified for synthetic index markets suitable for all pairs! Ideal for volatility and jumps!
マニュアルトレードでは、 KT Renko Patterns インジケーター が提供する多くのトレードチャンスが、Renkoチャートの急激な価格変動によって見逃されることがあります。 KT Renko Patterns EA は、「KT Renko Patterns インジケーター」に基づいた100%自動取引戦略を実装することで、この問題を解決します。インジケーターからパターンとシグナルを取得した後、事前チェックと評価を行い、効率的に取引を実行します。 すべての必要なコンポーネントはEAに統合されています。そのため、 KT Renko Patterns インジケーター を購入しなくても、このEAを正常に動作させることができます。 10ピップRenkoボックス用の セットファイル をダウンロードして、同様のバックテストを実行してください。 特徴 KT Renko Patterns インジケーター を活用して完全自動取引を実行し、大幅な時間短縮が可能。 無料のRenkoチャート生成ツールと完全互換。 追加のダウンロードは不要。必要なすべてのコンポーネントがEAに統合済み。 ストップ
Trend Direction ADX indicator Trend Direction ADX is part of a serie of indicators used to characterize market conditions. Almost any strategy only work under certain market conditions. Therefore it is important to be able to characterize market conditions at any time: trend direction, trend strength, volatility, etc.. Trend Direction ADX is an indicator to be used to characterize trend direction: trending up trending down ranging Trend Direction ADX is based on ADX standard indicator. Tre
Fractal 358 Plus is a predictive indicator that provides the clearest sight of price movements. Identifying graphic patterns such as Caixote (Crate), Pivot and Inside Candle , it shows entries and exits spots, as well as threats to your trades in the markets. It comes ready to use with B3 Mini Index (WIN$ series) and can be adjusted to use with any asset and timeframe. Fractal 358 unravels price movement Based on the Fibonacci sequence, Fractal 358 is a new and different way of reading and und
MT4版  |  FAQ Owl Smart Levels Indicator は、 Bill Williams の高度なフラクタル、市場の正しい波構造を構築する Valable ZigZag、エントリの正確なレベルをマークする Fibonacci レベルなどの一般的な市場分析ツールを含む 1 つのインジケーター内の完全な取引システムです。 利益を得るために市場と場所に。 戦略の詳細な説明 インジケータを操作するための指示 顧問-取引助手 プライベートユーザーチャット ->購入後に私に書いて、私はプライベートチャットにあなたを追加し、あなたはそこにすべてのボーナスをダウンロードすることができます 力はシンプルさにあります! Owl Smart Levels 取引システムは非常に使いやすいので、専門家にも、市場を勉強し始めて自分で取引戦略を選択し始めたばかりの人にも適しています。 戦略と指標に秘密の数式や計算方法が隠されているわけではなく、すべての戦略指標は公開されています。 Owl Smart Levels を使用すると、取引を開始するためのシグナルをすばやく確認し、注文を出すための
Renko Chart
Marcin Konieczny
3.56 (9)
This indicator allows to display Renko charts in the indicator window. Renko charts show only price movements that are bigger than the specified box size. It helps to eliminate noise and allows to focus on main trends. Time is not a factor here. Only price movements are taken into account. That's why Renko chart is not synchronized with the main chart it is attached to. Indicator works in two modes: CLOSE - only close prices are taken into account while building the chart HIGH_LOW - only high/l
FREE
Renko indicator helps develop Renko charts on different symbols. Advantages Drag and drop the indicator on M1 timeframe of the symbol chart Realtime updates Indicator can be used for Expert Advisors and technical analysis Backtest your strategy using Renko indicator Parameters BOX SIZE: Input the number of box size. The box size reflects the difference of the symbol price. So, a 50 box size would reflect a 5 pip value difference in a currency pair symbol Show Wicks: If true , high or low of th
このプロダクトを購入した人は以下も購入しています
Trade Assistant MT5
Evgeniy Kravchenko
4.41 (177)
取引 ごとのリスクの 計算、新規注文 の 簡単 な 設置、部分的 な 決済機能 を 持 つ 注文管理、 7 種類 のトレーリングストップなど 、便利 な 機能 を 備 えています 。 追加の資料と説明書 インストール手順   -   アプリケーションの手順   -   デモアカウント用アプリケーションの試用版 ライン機能 チャート上にオープニングライン、ストップロス、テイクプロフィットを表示します。この機能により、新規注文を簡単に設定することができ、注文を出す前にその特徴を確認することができます。   リスク計算 リスク計算機能は、設定されたリスクとストップロス注文のサイズを考慮して、新規注文のボリュームを計算します。ストップロスの大きさを自由に設定できると同時に、設定したリスクを守ることができます。 Lot calc ボタン - リスク 計算 を 有効 / 無効 にします 。 Risk フィールドでは 、必要 なリスクの 値 を 0 から 100 までのパーセンテージまたは 預金通貨 で 設定 します 。 設定」 タブで 、 リスク 計算 の 種類 を 選択 します :「 $ 通
Trade Manager EAへようこそ。これは、取引をより直感的、正確、そして効率的にするために設計された究極の リスク管理ツール です。これは単なるオーダー実行ツールではなく、包括的な取引計画、ポジション管理、リスク管理のためのソリューションです。初心者から上級者、迅速な実行を必要とするスキャルパーまで、Trade Manager EAはあらゆるニーズに対応し、為替、指数、商品、暗号通貨などさまざまな市場で柔軟に対応します。 Trade Manager EAを使用すると、複雑な計算が過去のものになります。市場を分析し、エントリーポイント、ストップロス、テイクプロフィットのレベルをチャート上のラインでマークし、リスクを設定するだけで、Trade Managerが最適なポジションサイズを即座に計算し、SLとTPをピップ、ポイント、口座通貨でリアルタイムに表示します。すべての取引が簡単かつ効果的に管理されます。 主な機能: ポジションサイズ計算機 :定義されたリスクに基づいて取引サイズを瞬時に決定します。 簡単な取引計画 :エントリー、ストップロス、テイクプロフィットを設定するためのド
TradePanel MT5
Alfiya Fazylova
4.85 (127)
Trade Panel は、多機能の取引アシスタントです。このアプリケーションには手動取引用の 50 を超える取引機能が含まれており、ほとんどの取引操作を自動化できます。 注意、アプリケーションはストラテジー テスターでは動作しません。購入する前に、デモアカウントでデモ版をテストできます。デモ版 ここ 。 完全な手順 こちら 。 取引。 ワンクリックで取引操作を実行できます: 自動リスク計算を使用して未決の注文とポジションをオープンします。 ワンクリックで複数の注文とポジションをオープンします。 注文グリッドを開きます。 ワンクリックで複数のシンボルの注文とポジションを開きます。 未決の注文とポジションをグループごとにクローズします。 ポジション反転 (買いを閉じて売りを開く、または売りを閉じて買いを開く)。 ポジションをロックします(買いポジションと売りポジションの量を均等にする追加のポジションをオープンします)。 ワンクリックですべてのポジションを部分的にクローズします。 すべてのポジションのテイクプロフィットとストップロスを同じ価格レベルに設定します。 すべてのポジションのストッ
Local Trade Copier EA MT5
Juvenille Emperor Limited
4.98 (86)
Local Trade Copier EA MT5 による、驚くほど高速な取引コピーを体験してください。1分で簡単にセットアップできるこの取引コピー機は、同じWindowsコンピュータまたはWindows VPS上の複数のMetaTrader端末間で取引をコピーすることができ、0.5秒未満の高速コピースピードを実現します。 初心者であろうとプロのトレーダーであろうと、 Local Trade Copier EA MT5 には、あなたの特定のニーズに合わせてカスタマイズするための幅広いオプションが用意されています。これは、利益の可能性を高めたい人にとって究極のソリューションです。 今すぐ試してみて、これが市場で最も速くて簡単なトレードコピー機である理由を理解してください。 ヒント: デモアカウントで Local Trade Copier EA MT5 デモバージョンをダウンロードして試すことができます: ここ ダウンロードした無料のデモ ファイルを MT5 >> ファイル >> データ フォルダを開く >> MQL5 >> Experts フォルダに貼り付けて、ターミナルを再起動しま
The product will copy all telegram signal to MT5 ( which you are member) , also it can work as remote copier.  Easy to set up, copy order instant, can work with almost signal formats, image signal,  s upport to translate other language to English Work with all type of channel or group, even channel have "Restrict Saving Content", work with  multi channel, multi MT5 Work as remote copier: with signal have ticket number, it will copy exactly via ticket number. Support to backtest signal. How to s
Tired of complex order placement and manual calculations? Trade Dashboard is your solution. With its user-friendly interface, placing orders becomes effortless, by a single click, you can open trades, set stop loss and take profit levels, manage trade lot size, and calculate risk to reward ratios, allowing you to only focus on your strategy. Say goodbye to manual calculations and streamline your trading experience with Trade Dashboard. Download  Demo Version  right now. You can find  Details of
注意 :このエキスパートアドバイザーはストラテジーテスターでは動作しません。試用版をご希望の方は、私のプロフィールをご覧ください。 取扱説明書 自動ジャーナルをダウンロードするには、私のプロフィールをご覧ください RiskGuard Management – プロフェッショナルトレーディング、妥協なし RiskGuard Management は、利益を最大化し損失を最小限に抑えるために高度なリスク管理を活用したいすべてのトレーダーにとって、究極のパートナーです。ただのツールではなく、トレーディングプランの遵守、感情的なミスの回避、最大限の効率での運用をサポートする インテリジェントなシステム です。 資金を完全に保護 ロットサイズを動的に計算する高度なリスク管理 毎日のトレードプランに従って自動でポジションをクローズ 各取引のリスクを最適化するQuantumテクノロジー データのエクスポートと自動ジャーナル機能付きのプロフェッショナルな分析とレポート Quantum:トレーディングの常識を変える革新機能 Quantumはあなたのトレーディング統計と現在のドローダウンを分析し、各トレ
Cerberus Equity Watcher
Samuel Bandi Roccatello
5 (3)
Cerberus the Equity Watcher はリスク管理ツールであり、アカウントの資産を常に監視し、不完全な EA や裁量的なトレーダーの場合は感情的な行動によって引き起こされる大きなドローダウンを回避します。これは、バグを含む可能性のある EA や、予想外の市況でうまく機能しない可能性のある EA に依存するシステマティック トレーダーにとって非常に役立ちます。 Cerberus では、最小エクイティ値と (オプションで) 最大値を設定できます。これらのいずれかに達すると、すべてのポジションがフラットになり、すべての未決注文がクローズされ、すべての EA が「強制終了」されます。すべての位置を平坦化すると、ユーザーの携帯電話に通知が送信され、画面に明確なメッセージが表示されます。 「平坦化」の後、Cerberus は株式価値を監視し続け、再初期化されるまでそれ以上の取引の試みを停止し続けます。 Cerberus によって実行されるすべての操作は、画面に明確に表示され、Expert advisor タブに報告され、通知がユーザーに送信されます。ユーザーのミスを避けるために、
MT5 to Telegram Signal Provider は、Telegramのチャット、チャンネル、またはグループに 指定された シグナルを送信することができる、完全にカスタマイズ可能な簡単なユーティリティです。これにより、あなたのアカウントは シグナルプロバイダー になります。 競合する製品とは異なり、DLLのインポートは使用していません。 [ デモ ] [ マニュアル ] [ MT4版 ] [ Discord版 ] [ Telegramチャンネル ] セットアップ ステップバイステップの ユーザーガイド が利用可能です。 Telegram APIの知識は必要ありません。必要な全ては開発者から提供されます。 主な特長 購読者に送信する注文の詳細をカスタマイズする機能 例えば、Bronze、Silver、Goldといった階層型のサブスクリプションモデルを作成できます。Goldサブスクリプションでは、すべてのシグナルが提供されます。 id、シンボル、またはコメントによって注文をフィルターできます 注文が実行されたチャートのスクリーンショットが含まれます 追加の確認のために
Trade Manager は、リスクを自動的に計算しながら、取引を迅速に開始および終了するのに役立ちます。 過剰取引、復讐取引、感情的な取引を防止する機能が含まれています。 取引は自動的に管理され、アカウントのパフォーマンス指標はグラフで視覚化できます。 これらの機能により、このパネルはすべてのマニュアル トレーダーにとって理想的なものとなり、MetaTrader 5 プラットフォームの強化に役立ちます。多言語サポート。 MT4バージョン  |  ユーザーガイド + デモ Trade Manager はストラテジー テスターでは機能しません。 デモについてはユーザーガイドをご覧ください。 危機管理 % または $ に基づくリスクの自動調整 固定ロットサイズを使用するか、ボリュームとピップに基づいた自動ロットサイズ計算を使用するオプション RR、Pips、または価格を使用した損益分岐点ストップロス設定トレーリングストップロス設定 目標に達したときにすべての取引を自動的に終了するための 1 日あたりの最大損失 (%)。 過度のドローダウンからアカウントを保護し、オーバートレードを防ぎます
あなたがメンバーである任意のチャネルから(プライベートおよび制限されたものを含む)シグナルを直接あなたのMT5にコピーします。  このツールは、トレードを管理し監視するために必要な多くの機能を提供しながら、ユーザーを考慮して設計されています。 この製品は使いやすく、視覚的に魅力的なグラフィカルインターフェースで提供されています。設定をカスタマイズして、数分で製品を使用を開始できます! ユーザーガイド + デモ  | MT4版 | Discord版 デモを試してみたい場合は、ユーザーガイドにアクセスしてください。 Telegram To MT5 受信機は、ストラテジーテスターで動作しません! Telegram To MT5の特徴 複数のチャネルから一度にシグナルをコピー プライベートおよび制限されたチャネルからシグナルをコピー BotトークンまたはChat IDは必要ありません   (必要に応じて使用することができます) リスク%または固定ロットを使用して取引 特定のシンボルを除外 すべてのシグナルをコピーするか、コピーするシグナルをカスタマイズするかを選択 すべてのシグナルを認
Grid Manual MT5
Alfiya Fazylova
4.89 (18)
「Grid Manual」は、注文のグリッドを操作するための取引パネルです。 ユーティリティはユニバーサルで、柔軟な設定と直感的なインターフェイスを備えています。 それは、損失を平均化する方向だけでなく、利益を増やす方向でも注文のグリッドで機能します。 トレーダーは注文のグリッドを作成して維持する必要はありません。 すべてが「Grid Manual」によって行われます。 注文を開くだけで十分であり、「Grid Manual」は注文のグリッドを自動的に作成し、非常に閉じるまでそれに付随します。 完全な説明とデモバージョン ここ。 ユーティリティの主な機能と機能 ユーティリティは、モバイル端末から開かれた注文を含め、あらゆる方法で開かれた注文を処理します。 「制限」と「停止」の2種類のグリッドで機能します。 グリッド間隔の計算には、固定と動的(ATRインジケーターに基づく)の2つの方法で機能します。 オープンオーダーグリッドの設定を変更できます。 チャート上の各注文グリッドの損益分岐点を表示します。 各注文グリッドの利益率を表示します。 ワンクリックでグリッドから収益性の高い注文を閉じるこ
Custom Alerts: 複数の市場を同時にモニターし、重要なチャンスを逃さない 概要 Custom Alerts は、複数の銘柄で発生する潜在的なセットアップを統合して追跡したいトレーダーに向けたダイナミックなソリューションです。FX Power、FX Volume、IX Power などの主力ツールから得られるデータを統合することで、 Custom Alerts は、複数のチャートを切り替えたり、絶好の機会を逃したりするリスクなしに、市場での重要な変化を自動的に通知します。よりスマートかつ効率的にトレードしたい方は、 Custom Alerts を活用してモニタリング能力を大幅に向上させましょう。 1. なぜ Custom Alerts がトレーダーにとって非常に有益なのか 全てを一括管理するマーケットモニタリング • Custom Alerts は、主要8通貨、ゴールド、および最大7つの指数や商品など、さまざまな銘柄からのシグナルを集約・統合します。 • 多数のチャートを切り替える手間を省き、明確かつ一元化された通知を受け取ることが可能です。 戦略に合わせたカスタムア
Trade copier MT5
Alfiya Fazylova
4.53 (30)
Trade Copierは、取引口座間の取引をコピーして同期するように設計された専門的なユーティリティです。 コピーは、同じコンピューターまたはvps にインストールされている、サプライヤーのアカウント/端末から受信者のアカウント/端末に行われます。 購入する前に、デモ アカウントでデモ バージョンをテストできます。 デモ版 こちら 。 詳細な説明は こちら 。 主な機能と利点: MT5ネッティングアカウントを含む、MT5> MT5、MT4> MT5、MT5> MT4のコピーをサポートします。 高いコピー速度(0.5秒未満)。 ベンダーモードと受信者モードは同じ製品内に実装されています。 チャートから直接リアルタイムでコピーを制御できる、簡単で直感的なインターフェイス。 接続が切断されたり、端末が再起動されたりしても、設定と位置が失われることはありません。 コピーするシンボルを選択できます。また、受信者のシンボルを置き換えることもできます(例:EURUSD> USDJPY)。 バックコピーをサポートします。 特定の注文のみのコピーを有効にする機能。 取引開始価格の最大差と最大遅延時間を
YuClusters
Yury Kulikov
4.93 (41)
Attention: You can view the program operation in the free version  YuClusters DEMO .  YuClusters is a professional market analysis system. The trader has unique opportunities to analyze the flow of orders, trade volumes, price movements using various charts, profiles, indicators, and graphical objects. YuClusters operates on data based on Time&Sales or ticks information, depending on what is available in the quotes of a financial instrument. YuClusters allows you to build graphs by combining da
多機能ツール 搭載機能: ロット計算機、プライスアクション、リスク/リワードレシオ、トレードマネージャー、需要供給ゾーンなどをはじめ65以上の機能。 バージョ:デモ版   |   ユーザーマニュアル   |    MT4版 このユーティリティはストラテジー テスターでは機能しません。 ここからデモ   バージョンをダウンロードして製品をテストできます。 ご不明な点や改善提案、バグの発見などございましたら、 連絡してください 。 取引プロセスを簡素化、高速化、自動化します。このダッシュボードで標準端末機能を拡張します 1. 新しい取引を開始します : ロット / リスク / RR の計算 1. Lot計算機(リスクサイズに基づく取引量計算 2. リスク計算機(ロットサイズに基づくリスク量) 3. リスク/リワードレシオ (R/R) 4. 注文のアクティベーション トリガー + Buy StopLimit / Sell StopLimit 5. 仮想 SL / TP レベル (隠しSL、TP: ブローカーには見えない) 6.  Smart SL / エントリー レベル: バーがそれを超
Exp COPYLOT CLIENT for MT5
Vladislav Andruschenko
3.9 (31)
MT5のトレードコピー機は、МetaТrader5プラットフォームのトレードコピー機です 。 それは間の 外国為替取引をコピーします   任意のは 、MT5 - MT5、MT4 - MT5   COPYLOT MT5版の アカウント (またはを MT4 - MT4   MT5 - MT4   COPYLOT MT4版用) 信頼できるコピー機! MT4のバージョン 完全な説明   +DEMO +PDF 購入する方法 インストールする方法     ログファイルの取得方法     テストと最適化の方法     Expforex のすべての製品 МТ4ターミナルでトレードをコピーすることもできます(   МТ4   -   МТ4、МТ5   -   МТ4   ):   MT4のCOPYLOT CLIENT このバージョンには、端末間 МТ5   -   МТ5、МТ4   -   МТ5が含まれ ます。 ディールコピー機は、2/3/10端末間でディール/ポジションをコピーするために作成されます。 デモ口座と投資口座からのコピーがサポートされています。 プログラムは、複数の端末バインデ
Community, update news, feature discussions, complaints, suggestions, and first-line support are organized in a free Discord server . Use   Webmoney  to pay in crypto. Lazy Trader is your personal risk management assistant that independently finds the best market entries, manages positions, and helps you extract maximum profit from every trading idea! It monitors charts from M1 to W1 , finds optimal entry points based on your parameters, and manages trades without your involvement: -   Got a
2025 happy new year -25% discount ($199 -> $149) Advanced trading tool: One click smart orders that execute under your conditions Developed by trader for trading community:  position size calculator (lot size), open position after price action, strategy builder, set and forget trading, mobile notifications... Risk Management -  Risk percentage position size calculator, gain percentage, target risk reward ratio, spread and commissions are included in calculations 7 Advanced order types  - Set a
Seconds Chart — MetaTrader 5で秒足チャートを作成するユニークなツールです。 Seconds Chart を使用すると、秒単位のタイムフレームでチャートを構築でき、標準的な分足や時間足チャートでは得られない柔軟性と分析精度を実現します。例えば、 S15 は15秒足を表します。あらゆるインジケーター、エキスパートアドバイザー、スクリプトを利用可能で、標準的なチャートと同様に便利に操作できます。 標準的なツールとは異なり、 Seconds Chart は超短期のタイムフレームでも高い精度と遅延なく作業できるように設計されています。 Seconds Chartの利点 1秒から900秒 までのタイムフレームをサポート。 組み込みのティックデータベースにより、ヒストリカルデータを 瞬時にロード 。 リアルタイムでデータが更新され、 遅延やラグなし 。 複数の秒足チャートを同時に作成可能。 Seconds Chartが最適な用途 スキャルピング や高頻度取引。 正確なエントリーとエグジット。 短期タイムフレームでの取引戦略のテスト。 タイムフレームの設定 デフォルトの設定
The Expert Advisor is a risk manager helping users to control their trading. In the settings, it is possible to specify the parameters at which the risk manager force closes the opened trades and closes the terminal as well, if it is needed to prevent opening trades on emotions, which do not correspond to the trading strategy. Risk Manager settings Check limit to close   - check the equity limit Limit to close   - minimum account equity triggering loss prevention measures Check day limit to cl
EA DIDI アラート - ATM システム検針器 金融市場で最高の取引機会を活用するのに役立つツールをお探しですか? 次に、ATM SystemsのDIDI Alert - Agulhadas Detectorは、DIDI INDEXを通じてDidi Aguiarの強力なNeedles Setup取引戦略を使用する市場で唯一のアドバイザーであり、この戦略の他の専任アドバイザーとは異なり、利用可能なさまざまなリソースを備えていることを知っておく必要があります。非常に完成度が高く、機能的で実用的です。ボリンジャーバンドのニーズ、トレンド、空き状況を特定し、「完全なニーズ」が検出されると、プッシュ通知や電子メールを介してアラートを発します。また、ボリンジャーバンドの結果を迅速かつ簡単に表示するための直感的なグラフィカルダッシュボードも提供します。分析。 DIDI Alert は最先端の人工知能を使用して開発され、コードのすべての行が最適化および洗練され、最大限のパフォーマンスと精度を保証します。さらに、DIDI Alert は、世界最大かつ最も信頼できる取引コミュニティである MQL
Local Trade Copier EA は、MAMまたはPAMMアカウントを必要とせずに、外部ソースからのトレードシグナルを実行する必要がある、または同時に複数のアカウントを管理する必要がある個々のトレーダーまたはアカウントマネージャー向けのソリューションです。最大8つのマスターアカウントから無制限のスレーブアカウントにコピーします [ インストールガイド | アップデートガイド | トラブルシューティング | FAQ | すべての製品 ] 100%セルフホスト インストールと使用が簡単 インストーラー、構成ファイル、サーバー、メモリパイプ、DLLは使用されていません EAを永久に使用するための1000回のアクティベーション ローカル実行、ネットワーク遅延なし それはあなたがこれまでに必要とするすべての機能を実装します: 最大8つのマスターアカウントと無制限のスレーブアカウント すべてのブローカーおよびDD / NDD / ECN / STP実行で動作します 異なる口座通貨の口座で動作します ライブアカウントとデモアカウントの間で区別なく機能します マスターアカウントとスレーブア
DrawDown Limiter
Haidar, Lionel Haj Ali
5 (20)
Drawdown Limiter EA You are in the right place if you were searching for Drawdown control, Drawdown limiter, Balance protection, Equity Protection or Daily Drawdown Limit related to Prop Firm, FTMO, or Funded account trading, or if you want to protect your trading account. Have you suffered from controlling your drawdown when trading funded accounts? This EA is meant for you. Prop firms usually set a rule called “Trader Daily Drawdown”, and if it is not respected, you are disqualified.  I am an
ワンクリックで取引できるトレーディングパネル。ポジションと注文の操作!チャートまたはキーボードから取引。 当社の取引パネルを使用すると、チャートから直接シングルクリックで取引を実行でき、標準の MetaTrader コントロールよりも 30 倍高速に取引操作を実行できます。 パラメータと関数の自動計算により、トレーダーにとって取引がより速く、より便利になります。 グラフィックのヒント、情報ラベル、取引取引に関する完全な情報はチャート MetaTrader にあります。 MT4のバージョン 完全な説明   +DEMO +PDF 購入する方法 インストールする方法     ログファイルの取得方法     テストと最適化の方法     Expforex のすべての製品 手動取引用の取引パネル。チャート(チャートウィンドウ)またはキーボードから取引できます。  開閉、リバース、ロックポジションと注文を処理する МetaТrader5 のメインオーダーのトレーディングコントロールパネル:売買、売却、売却、売却、売却、閉じる、削除、修正、トレーリングストップ、ストップロス、takeproft
この製品は、ニュースタイム中にすべてのエキスパートアドバイザーと手動チャートをフィルタリングするため、急激な価格変動によるマニュアルトレードのセットアップの破壊や他のエキスパートアドバイザーによって入力された取引について心配する必要はありません。この製品には、ニュースのリリース前にオープンポジションとペンディングオーダーを処理できる完全な注文管理システムも付属しています。 The News Filter  を購入すると、将来のエキスパートアドバイザーのためにビルトインのニュースフィルターに頼る必要はなく、今後はすべてのエキスパートアドバイザーをここからフィルタリングできます。 ニュース選択 ニュースソースは、Forex Factoryの経済カレンダーから取得されます。 USD、EUR、GBP、JPY、AUD、CAD、CHF、NZD、CNYなど、任意の通貨数に基づいて選択できます。 Non-Farm(NFP)、FOMC、CPIなどのキーワード識別に基づいて選択することもできます。 影響レベルによってフィルタリングするニュースを選択することができ、低、中、高の影響範囲から選択できます。
MT5のエキスパートアドバイザーリスクマネージャーは非常に重要であり、私の意見ではすべてのトレーダーにとって必要なプログラムです。 このエキスパートアドバイザーを使用すると、取引口座のリスクを管理することができます。リスクと利益の管理は、金銭的およびパーセンテージの両方で実行できます。 エキスパートアドバイザーが機能するには、それを通貨ペアチャートに添付し、許容可能なリスク値を預金通貨または現在の残高の%で設定するだけです。 PROMO BUY 1 GET 2 FREE -   https://www.mql5.com/en/blogs/post/754725 アドバイザ機能 このリスクマネージャーは、リスクの管理を支援します。 -取引のために -1日あたり - 1週間 - ひと月ほど 制御することもできます 1)取引時の最大許容ロット 2)1日あたりの最大注文数 3)1日あたりの最大利益 4)エクイティを引き受ける利益を設定する それだけではありません。設定で自動設定を指定した場合、アドバイザーはデフォルトのSLとTPを設定することもできます。 アドバイザーは各イ
コピー機->便利で高速なインターフェースインタラクション、ユーザーはすぐに使用できます     ->>>> WindowsコンピュータまたはVPS Windowsでの使用を推奨 特徴: 多様でパーソナライズされたコピー取引設定:1. 異なるシグナルソースに異なるロットモードを設定できます。2. フォワードコピー取引とリバースコピー取引に異なるシグナルソースを設定できます。3. シグナルはコメントで設定できます。4. 契約ロットに応じてロットを調整するかどうか 多様でパーソナライズされたコピー注文設定2:1.品種ごとに異なるロットモードを設定できます2.順方向コピー注文と逆方向コピー注文に異なる品種を設定できます3.コメントでシグナルを設定できます4.契約ロットに応じてロットを調整するかどうか コメントフィルタリング、MAGICフィルタリング、シグナルロットフィルタリング、ローカル製品フィルタリング 勤務時間設定 逆同期SLAVE終了 注文バインド機能: 任意の注文を設定されたシグナルソース注文にバインドできます (テーブルをダブルクリックして編集します) アカウントリスク管理 基本
-25% discount ($149 -> $111) Everything for chart Technical Analysis indicator mt5 in one tool Draw your supply demand zone with rectangle and support resistance with trendline and get alerts to mobile phone or email alert -  Risk reward indicator mt5 Video tutorials, manuals, DEMO download   here .   Find contacts on my   profile . 1.   Extended rectangles and trendlines Object will be extended to the right edge of the chart when price will draw new candles on chart. This is rectangle extende
This is exactly what the name says. Visual strategy builder . One of a kind. Turn your trading strategies and ideas into Expert Advisors without writing single line of code. Generate mql source code files with a few clicks and get your fully functional Expert Advisors, which are ready for live execution, strategy tester and cloud optimization. There are very few options for those who have no programming skills and can not create their trading solutions in the MQL language. Now, with Bots Builde
作者のその他のプロダクト
If you trade Forex, having detailed information about the currency strength and currency pairs correlation can take your trading to new heights. The correlation will help to cut your risk in half, and strength analysis will help to maximize the profits. This indicator provides a hybrid approach for selecting the most appropriate currency pairs using the strength analysis and currency pairs correlation. How to use the Currency Strength Analysis Suppose your trading strategy provides a buying opp
KT Asian Breakout インジケーターは、アジア市場の重要な時間帯を分析し、価格のブレイクアウト方向に基づいた双方向の売買シグナルを生成します。価格がセッション高値を超えると買いシグナルが発生し、セッション安値を下回ると売りシグナルが発生します。 注意事項 セッションボックスが縦に広すぎる場合、新たな取引は避けるべきです。すでにセッション内で価格の動きが完了している可能性が高いためです。 ブレイクアウトのローソク足が大きすぎる場合、価格は一時的に反転した後に、シグナルの方向へ進むことがよくあります。 機能 買い/売りシグナルには、ストップロスと利益目標が含まれています。 KT Asian Breakout インジケーターは、第一、第二、第三の利益目標を成功基準として継続的にパフォーマンスをチェックします。 勝敗シグナル数、成功率、1シグナルあたりの平均ピップスなど、3つの主要なパフォーマンス指標を表示します。 ブレイクアウトのローソク足が大きすぎる場合、チャート上に警告メッセージを表示します。 推奨設定 時間足: 15分。 通貨ペア: すべての JPY ペア。 入力
KT Psar Arrows
KEENBASE SOFTWARE SOLUTIONS
KT Psar Arrows plots the arrows on chart using the standard Parabolic SAR indicator. A bullish arrow is plotted when the candle's high touch the SAR. A bearish arrow is plotted when the candle's low touch the SAR. The signals are generated in the real-time without waiting for the bar close.  Features A beneficial tool for traders who want to experiment with the trading strategies that include the use of Parabolic Sar indicator.  Can be used to find turning points in the market. Use custom PSAR
KT Auto Fibo
KEENBASE SOFTWARE SOLUTIONS
KT Auto Fibo draws Fibonacci retracement levels based on the ongoing trend direction. The Highs and Lows are automatically selected using the Maximum and Minimum points available on the chart. You can zoom in/out and scroll to adjust the Fibonacci levels accordingly. Modes Auto:  It draws the Fibonacci levels automatically based on the chart area. Manual: It draws the Fibonacci levels only one time. After that, you can change the anchor points manually. Usage: Helps to predict the future profi
KT Volatility oscillator analyze the past and current market data with a mathematical formula to display the result in a form of an oscillator. The growing and deteriorating waves are equivalent to high and low volatility in the asset.  In a nutshell, volatility is simply a measurement of the price fluctuation of an asset over a certain period of time. Without volatility, there would not much movement in the market and traders would not be able to profit from the price movements. Use of Volatil
KT MA Crossover MT5
KEENBASE SOFTWARE SOLUTIONS
KT MA Crossover は、選択した移動平均線のクロスに基づいて買いと売りの矢印をチャートに描画します。さらに、各シグナルに対して適切なアラートを生成し、MFE(最も有利な価格変動)も表示します。これにより、トレーダーは過去のシグナルのパフォーマンスをより深く理解できます。 移動平均のクロスオーバーは、世界中のトレーダーがよく使う基本的な戦略の1つです。一般的には、速い移動平均と遅い移動平均を組み合わせて、その交差の方向によって買いまたは売りのエントリーシグナルを判断します。 買いシグナル:速いMAが遅いMAを上から下にクロスしたとき。 売りシグナル:速いMAが遅いMAを下から上にクロスしたとき。 特徴 各移動平均の設定は完全にカスタマイズ可能です。 各シグナルに対して MFE の値を表示します。 軽量に設計され、動作が非常にスムーズです。 すべてのMetaTraderアラート機能に対応しています。 デメリット  移動平均は過去のデータに基づくため、遅行性のある指標です。特にレンジ相場では、移動平均のクロスがランダムに見える場合があり、多くのダマしシグナルを発生させる可能
KT Momentum Arrows MT5
KEENBASE SOFTWARE SOLUTIONS
5 (2)
KT Momentum Arrows インジケーターは、一方向への急激なボラティリティとバンドの乖離に基づいて計算される、瞬間的なブレイクアウトを検出するツールです。動きの強さとタイミングを捉えることに特化しており、モメンタムトレードに最適です。 価格が上部バンドを上抜けして終値が確定したときに買いシグナルが、下部バンドを下抜けしたときに売りシグナルが発生します。 バンドの広がりとボラティリティの両方に影響を与える「係数(Magnitude Coefficient)」が入力として用いられます。通貨ペアや時間軸に応じて最適な値を選定し、分析することが推奨されます。 主な特徴 リペイントなし! モメンタムトレーダーにとって優れたエントリーツール。 勝率、平均利益、勝ち/負けなどのパフォーマンス分析機能付き。 デイトレード、スイングトレード、スキャルピングに対応。 入力パラメーター 履歴バー数:  インジケーター計算に使用するローソク足の数。 マグニチュード係数:  バンドの拡張とボラティリティ計測に使う単一の係数。 パフォーマンス分析:  利益傾向のラインを含む分析を表示/非表示に切
KT RSI Divergence robot is a 100% automated expert advisor that trades regular and hidden divergence built between the price and Relative Strength Index (RSI) oscillator. The divergence signals are fetched from our freely available RSI divergence indicator. Not every divergence ends up in a successful price reversal, that's why this ea combines the raw divergences signals with its inbuilt technical analysis module to exploit the price inefficiency that occurs after some selected divergence sig
Use of support and resistance in systematic trading is very subjective. Every trader has their own idea and way to plotting the support and resistance levels on the chart. KT Support and Resistance indicator take out this ambiguity out of the situation and automatically draws support and resistance levels following an algorithmic approach using a unique multi-timeframe analysis. When launched on the chart, It immediately scan the most significant extreme points across all the available timefra
ダイバージェンス(乖離)は、市場における価格の反転を示す重要なシグナルのひとつです。KT Stoch Divergence は、価格とストキャスティクスオシレーターの間に発生するレギュラーおよびヒドゥンダイバージェンスを視覚的に表示します。 KT Stoch Divergence の注意点 ストキャスティクスのダイバージェンスだけをエントリーシグナルにするのはリスクがあります。すべてのダイバージェンスが反転を意味するわけではありません。プライスアクションやトレンドの方向と組み合わせて使用するのがおすすめです。 特徴 価格とストキャスティクス間のレギュラーおよびヒドゥンダイバージェンスをマーク。 トレンドの反転・継続両方に対応した戦略に使用可能。 エキスパートアドバイザー(EA)への組み込みに完全対応。 非対称なダイバージェンスは除外し、精度を向上。 エントリーだけでなく、エグジットにも利用可能。 すべてのMTアラート機能に対応。 そもそもダイバージェンスとは? 一般的に、価格が高値を更新するとき、オシレーターも高値を更新すべきです。同様に、安値を更新するときは、オシレーターも安
KT Trend Magic MT5
KEENBASE SOFTWARE SOLUTIONS
KT Trend Magic shows the trend depiction on chart using the combination of market momentum and volatility. A smoothing coefficient is used to smooth out the noise from the signal.It can be used to find out the new entries or confirm the trades produced by other EA or indicator. Features Drag n drop MTF scanner which scans for the new signals across multiple time-frames. Find new entries in the trend direction. Improve the accuracy of other indicators when used in conjunction. Can be used as a d
KT Trend Magic
KEENBASE SOFTWARE SOLUTIONS
KT Trend Magic shows the trend depiction on chart using the combination of market momentum and volatility. A smoothing coefficient is used to smooth out the noise from the signal.It can be used to find out the new entries or confirm the trades produced by other EA/Indicators. Usage Drag n drop MTF scanner which scans for the new signals across multiple time-frames. Find new entries in the trend direction. Improve the accuracy of other indicators when used in conjunction. Can be used as a dynami
KT COG Advanced MT4
KEENBASE SOFTWARE SOLUTIONS
1 (1)
KT COG is an advanced implementation of the center of gravity indicator presented by John F. Ehlers in the May 2002 edition of Technical Analysis of Stocks & Commodities magazine. It's a leading indicator which can be used to identify the potential reversal points with the minimum lag. The COG oscillator catches the price swings quite effectively. MT5 version of the same indicator is available here KT COG Advanced MT5 Calculation of COG The COG indicator is consist of the two lines. The main l
KT CCI Divergence shows the regular and hidden divergence created between the price and CCI oscillator. Divergence is one of the vital signals that depicts the upcoming price reversal in the market. Manually spotting the divergence between price and CCI can be a hectic and ambiguous task. Limitations of KT CCI Divergence   Using the CCI divergence as a standalone entry signal can be risky. Every divergence can't be interpreted as a strong reversal signal. For better results, try to combine it w
ACB Breakout Arrows
KEENBASE SOFTWARE SOLUTIONS
4.15 (34)
The ACB Breakout Arrows indicator provides a crucial entry signal in the market by detecting a special breakout pattern. The indicator constantly scans the chart for a settling momentum in one direction and provide the accurate entry signal right before the major move.  Get multi-symbol and multi-timeframe scanner from here - Scanner for ACB Breakout Arrows MT4 Key features Stoploss and Take Profit levels are provided by the indicator. Comes with a MTF Scanner dashboard which tracks the breako
ACB Trade Filter MT4
KEENBASE SOFTWARE SOLUTIONS
5 (1)
The ACB Trade Filter indicator provides a solution for filtering out the low probability trading setups in a trading strategy. The indicator uses a sophisticated filtration algorithm based on the market sentiment and trend. Applications Works great with our indicator " ACB Breakout Arrows ". Filter out low probability signals from any indicator. Avoid overtrading and minimize the losses. Trade in the direction of market sentiment and trend. Avoid the choppiness in the market. How to use Only L
KT Momentum Arrows
KEENBASE SOFTWARE SOLUTIONS
KT Momentum Arrows インジケーターは、一方向への急激なボラティリティとバンドの乖離に基づいて計算される、瞬間的なブレイクアウトを検出するツールです。動きの強さとタイミングを捉えることに特化しており、モメンタムトレードに最適です。 価格が上部バンドを上抜けして終値が確定したときに買いシグナルが、下部バンドを下抜けしたときに売りシグナルが発生します。 バンドの広がりとボラティリティの両方に影響を与える「係数(Magnitude Coefficient)」が入力として用いられます。通貨ペアや時間軸に応じて最適な値を選定し、分析することが推奨されます。 主な特徴 リペイントなし! モメンタムトレーダーにとって優れたエントリーツール。 勝率、平均利益、勝ち/負けなどのパフォーマンス分析機能付き。 デイトレード、スイングトレード、スキャルピングに対応。 入力パラメーター 履歴バー数:  インジケーター計算に使用するローソク足の数。 マグニチュード係数:  バンドの拡張とボラティリティ計測に使う単一の係数。 パフォーマンス分析:  利益傾向のラインを含む分析を表示/非表示に切
KT Pin Bar
KEENBASE SOFTWARE SOLUTIONS
KT Pin Bar identifies the pin bar formation which is a type of price action pattern which depicts a sign of reversal or rejection of the trend. When combined with support and resistance, BRN and other significant levels, Pin Bar pattern proved to be a very strong sign of reversal. Basically, a pin bar is characterized by a small body relative to the bar length which is closed either in upper or lower 50% part of its length. They have very large wicks and small candle body. A pin bar candlestic
KT Ichimoku Trader
KEENBASE SOFTWARE SOLUTIONS
1 (1)
KT Ichimoku Trader is a fully automated expert advisor that offers five popular trading strategies based on the Ichimoku indicator. Each strategy has it's own entry and exit method without any interference to other strategies. The Ichimoku system can be applied to all major currency pairs and metals. However, we found that it performs reasonably well mainly on two pairs.   MT5 Version is available here  https://www.mql5.com/en/market/product/35043 Features Trade up to 5 famous trading strategi
KT COG Robot
KEENBASE SOFTWARE SOLUTIONS
KT COG Robot is a fully automated Expert Advisor based on the KT COG Indicator . The COG indicator was originally presented by John F. Ehlers in the May 2002 edition of Technical Analysis of Stocks & Commodities magazine. The EA fires a long trade when COG line cross above the signal line and a short trade is fired when the COG line cross below the signal line.  Adaptive Filtration Our adaptive filtration algorithm combines the original COG formula with the major trend direction and market acce
ACB Breakout Arrows EA
KEENBASE SOFTWARE SOLUTIONS
This is a 100% automated expert advisor based on our custom indicator named "ACB Breakout Arrows" . The entries are based on a breakout pattern that constantly occurs in a bi-directional manner. The intensity of entry signals can be manipulated using the external input called "Signal Sensitivity". MT5 Version is available here  https://www.mql5.com/en/market/product/35785 Trades Confirmation ACB Breakout Arrows EA provides an ability to filter the entries using our another custom indicator nam
KT Asian Breakout
KEENBASE SOFTWARE SOLUTIONS
4 (1)
KT Asian Breakout carefully analyzes the range-bound market during the Asian session and then fires a long or short trade after doing some preassessment based on its inbuilt technical analysis module. The executed orders are closed within a day before the completion of the next day session. The inbuilt technical analysis module checks for the session range and compares it with the last 20 days price movement. If it finds any erratic price movement within the session, the orders are not executed
KT London Breakout
KEENBASE SOFTWARE SOLUTIONS
First thirty minutes are essential for a trading session. The early reaction of traders and market players sets a path for the rest of the day. KT London Breakout EA takes advantage of this phenomenon, and after analyzing the first thirty minutes of London session, it places two bidirectional pending orders. One of pending order is eventually canceled after realizing the market direction with certainty. It has been strictly tested and developed for EUR/JPY using 30-Min Time Frame. You can expe
MACD Divergence Seeker
KEENBASE SOFTWARE SOLUTIONS
KT MACD Divergence Seeker trades the regular and hidden divergence signals generated by our free indicator named KT MACD Divergence indicator. Trading the standalone divergences can be a risky affair that's why the KT MACD Divergence Seeker combines the standard divergence signals with an advanced analysis module to exploit the price inefficiencies on some FX pairs. What is the Divergence exactly? As a general conception if the price is making higher highs, then macd should also be making hig
MACD Divergence MT4
KEENBASE SOFTWARE SOLUTIONS
KT MACD Divergence shows the regular and hidden divergences build between the price and oscillator. If your trading strategy anticipates the trend reversal, you can include the MACD regular divergence to speculate the potential turning points. And if your trading strategy based on the trend continuation, MACD hidden divergence would be a good fit. Limitations of KT MACD Divergence Using the macd divergence as a standalone entry signal can be a risky affair. Every divergence can't be interprete
KT Bollinger Bands Trader is a 100% automated expert advisor that's incorporated a mean reversion trading strategy using the Bollinger bands during the period of low volatility. Price often reacts at the upper or lower line of Bollinger bands, but a reversal not always occurs. However, there is more chance of price reversal during the time of low volatility. Entries A buy trade is activated when price correctly aligns below the bottom line of Bollinger bands. A sell trade is activated when pric
KT Heiken Ashi Smoothed is a smoothed version of the standard Heiken Ashi. Moreover, it also plots buy/sell arrows on a trend change. A buy arrow is plotted when it change to a bullish state from bearish state. A sell arrow is plotted when it change to a bearish state from bullish state. Mobile notifications, Email, Sound and Pop-up alerts included. What exactly is Heiken Ashi Smoothed? It filters out the false signals and noise in the standard Heiken Ashi. It applies the set of two moving ave
KT MA Crossover MT4
KEENBASE SOFTWARE SOLUTIONS
KT MA Crossover は、選択した移動平均線のクロスに基づいて買いと売りの矢印をチャートに描画します。さらに、各シグナルに対して適切なアラートを生成し、MFE(最も有利な価格変動)も表示します。これにより、トレーダーは過去のシグナルのパフォーマンスをより深く理解できます。 移動平均のクロスオーバーは、世界中のトレーダーがよく使う基本的な戦略の1つです。一般的には、速い移動平均と遅い移動平均を組み合わせて、その交差の方向によって買いまたは売りのエントリーシグナルを判断します。 買いシグナル:速いMAが遅いMAを上から下にクロスしたとき。 売りシグナル:速いMAが遅いMAを下から上にクロスしたとき。 特徴 各移動平均の設定は完全にカスタマイズ可能です。 各シグナルに対して MFE の値を表示します。 軽量に設計され、動作が非常にスムーズです。 すべてのMetaTraderアラート機能に対応しています。 デメリット  移動平均は過去のデータに基づくため、遅行性のある指標です。特にレンジ相場では、移動平均のクロスがランダムに見える場合があり、多くのダマしシグナルを発生させる可能
KT Round Numbers MT4
KEENBASE SOFTWARE SOLUTIONS
KT Round Numbers plots the round number levels which are also commonly known as psychological levels in the Forex world. In the context of Forex trading, round number levels are those levels in which there are two or more zeroes at the end. They are named as 00 levels on the chart. Some traders also consider the halfway points as a valid round number level. They are named as 50 levels on the chart. Use of round number levels in trading Round number levels work as strong support and resistance
フィルタ:
Phs Francis
30
Phs Francis 2024.10.11 00:34 
 

ユーザーは評価に対して何もコメントを残しませんでした

KEENBASE SOFTWARE SOLUTIONS
50486
開発者からの返信 Nitin Raj 2024.10.11 12:37
Dear Phs Francis, Thank you for your feedback. I truly appreciate you bringing this to my attention. I’m sorry to hear that your experience with the product has been frustrating. To clarify, EAs can indeed work on custom Renko charts, but you are correct in pointing out a key detail—manual input of the symbol name is required in the EA settings. By default, many EAs try to fetch the symbol from the chart window, which may display names like EURUSD_10_PIPS(Renko chart) that don’t exist on your broker's server. This is where manually inputting the correct symbol name becomes crucial. I completely understand that this should have been better explained in the product description, and I apologize for the oversight. I’ll make sure this information is communicated moving forward, and I’d be happy to assist you personally in setting it up if needed. Your satisfaction is important to me, and I’m committed to making sure the product works as expected for you. Best regards,
Nitin
sunnychow
9051
sunnychow 2024.04.23 15:42 
 

ユーザーは評価に対して何もコメントを残しませんでした

Osama Echchakery
11931
Osama Echchakery 2023.11.28 19:01 
 

ユーザーは評価に対して何もコメントを残しませんでした

Manea Marian
1105
Manea Marian 2022.09.20 10:58 
 

ユーザーは評価に対して何もコメントを残しませんでした

ti4no
14
ti4no 2022.03.21 22:00 
 

ユーザーは評価に対して何もコメントを残しませんでした

popendekl
39
popendekl 2022.02.23 13:55 
 

ユーザーは評価に対して何もコメントを残しませんでした

clovismr
96
clovismr 2022.02.21 15:12 
 

ユーザーは評価に対して何もコメントを残しませんでした

S JENKINS
566
S JENKINS 2022.01.27 01:37 
 

ユーザーは評価に対して何もコメントを残しませんでした

4xtrader2009
266
4xtrader2009 2021.09.24 22:30 
 

ユーザーは評価に対して何もコメントを残しませんでした

Vanderocha
14
Vanderocha 2021.08.02 20:40 
 

ユーザーは評価に対して何もコメントを残しませんでした

AltosT
80
AltosT 2021.07.18 06:35 
 

ユーザーは評価に対して何もコメントを残しませんでした

scottonamission
29
scottonamission 2021.06.26 22:53 
 

ユーザーは評価に対して何もコメントを残しませんでした

KEENBASE SOFTWARE SOLUTIONS
50486
開発者からの返信 Nitin Raj 2021.07.20 17:41
That is not a bug. MT5 considers the Renko chart as a separate custom symbol. That's why one-click trading doesn't work, and trade levels don't show up on the Renko chart.
Evgeny Belyaev
89940
Evgeny Belyaev 2021.06.14 00:16 
 

ユーザーは評価に対して何もコメントを残しませんでした

KEENBASE SOFTWARE SOLUTIONS
50486
開発者からの返信 Nitin Raj 2021.06.16 10:31
Thanks, Evgeny :)
Dener Jose De Souza
200
Dener Jose De Souza 2021.05.14 18:07 
 

ユーザーは評価に対して何もコメントを残しませんでした

mariofo
21
mariofo 2021.03.27 14:40 
 

ユーザーは評価に対して何もコメントを残しませんでした

27138469
24
27138469 2021.02.27 22:01 
 

ユーザーは評価に対して何もコメントを残しませんでした

Wan Ping Fei
1690
Wan Ping Fei 2020.12.19 14:16 
 

ユーザーは評価に対して何もコメントを残しませんでした

レビューに返信