Boom Reversal
- インディケータ
- OLAMIDE SEUN BELLO
- バージョン: 2.0
- アップデート済み: 24 3月 2020
- アクティベーション: 5
インジケータについて
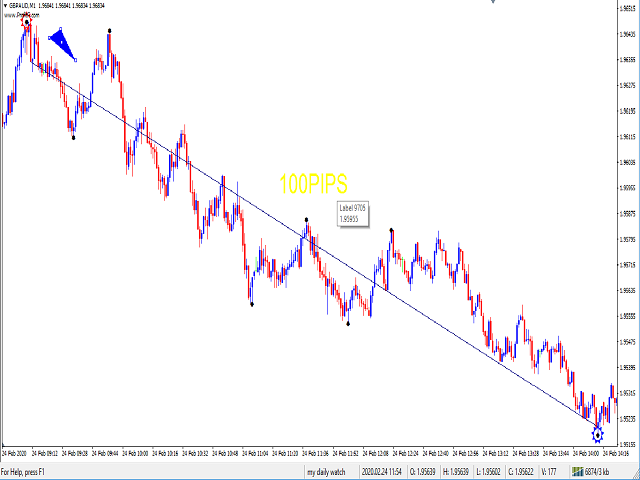
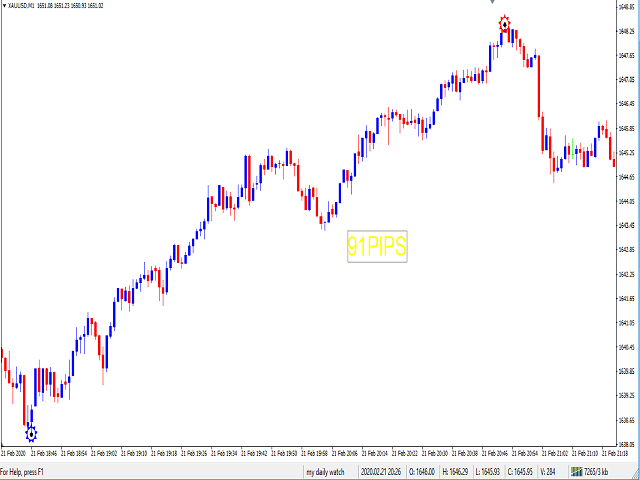
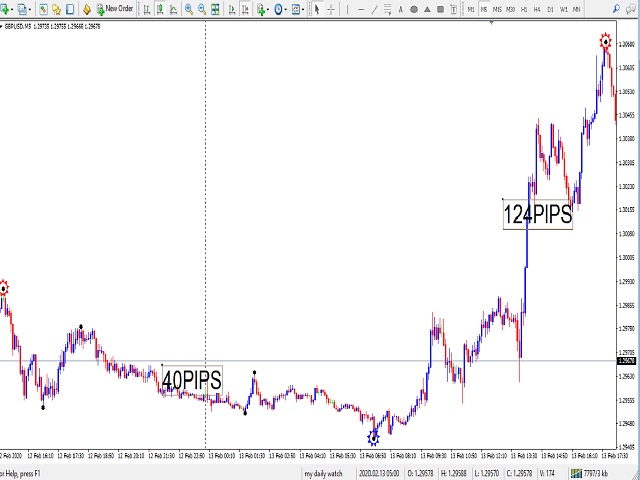
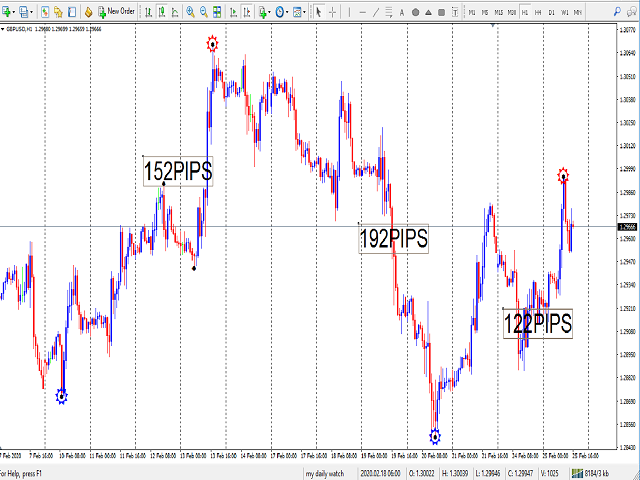
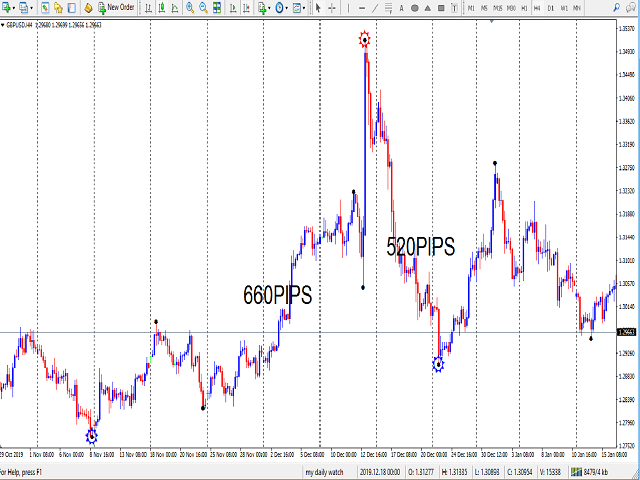
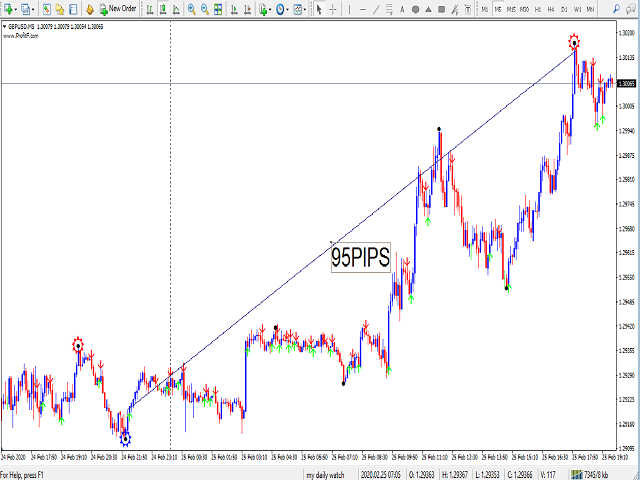
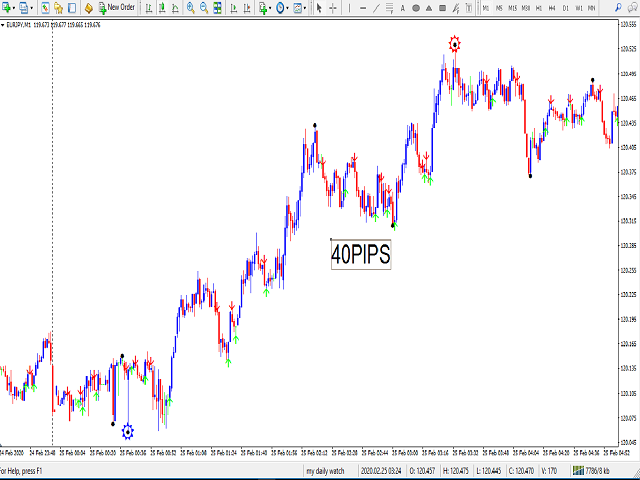
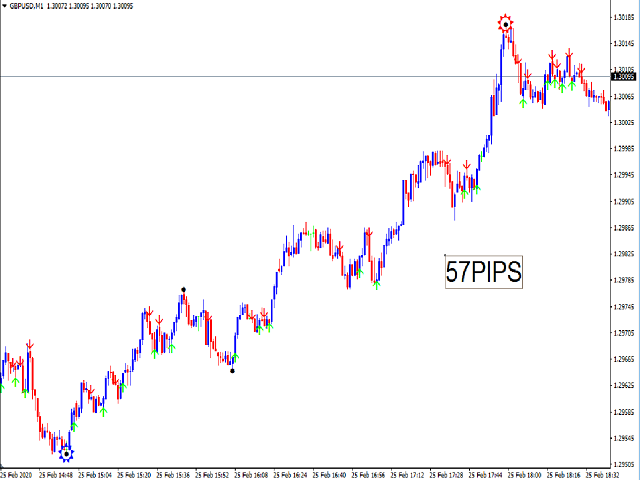
指標は、初期の傾向反転を識別します
どのタイプのトレーダーでも使用できます。スキャルパー、デイトレーダー、スイングトレーダー
すべての時間枠で機能します
携帯電話に通知を送信します
使い方 ?
ブルーまたはレッドブームリバーサルインジケーターペイント
私の戦略
スキャルパー用
購入:15分間または30分間の時間枠でブルーブーム反転インジケーターを探し、1分間の時間フレームに戻り、ブルーブーム反転インジケーターがペイントされたらトレードを行います
売り:15分間または30分間の時間枠でREDブーム反転インジケーターを探し、1分間のタイムフレームに戻り、赤色ブーム反転インジケーターがペイントされたら取引を行います
デイトレーダー用
購入:1Hタイムフレームでブルーブーム反転インジケーターを探し、5分間または15分間の時間フレームに戻り、ブルーブーム反転インジケーターがペイントされたらトレードを行います
売り:1H時間枠でREDブーム反転インジケータを探し、5分間または15分間の時間枠に戻り、赤色ブーム反転インジケータがペイントされたら取引を行います
スイングトレーダー用
購入:1Dタイムフレームでブルーブーム反転インジケーターを探し、1Hまたは4Hタイムフレームに戻り、ブルーブーム反転インジケーターがペイントされたらトレードを行います
売り:1DタイムフレームでREDブーム反転インジケーターを探し、1Hまたは4Hのタイムフレームに戻り、レッドブーム反転インジケーターがペイントされたらトレードを行います
*****注:より高い時間枠でテストし、日付を選択して反転インジケータを印刷し、書き留めてから、より短い時間枠でその日付で別のテストを実行します
ルールに従う場合、このインジケータは機能します
******必要な調整を行うには、この指標を確認してください*****
Indicator does not have alerts. No response from author.