Boom Reversal
- Göstergeler
- OLAMIDE SEUN BELLO
- Sürüm: 2.0
- Güncellendi: 24 Mart 2020
- Etkinleştirmeler: 5
MARCH BONUS FOR FIRST 10 BUYER AT THE PRICE OF 30$, PRICE WILL INCREASE AFTER BACK TO 70$ BY 17TH MARCH 2020
ABOUT THE INDICATOR
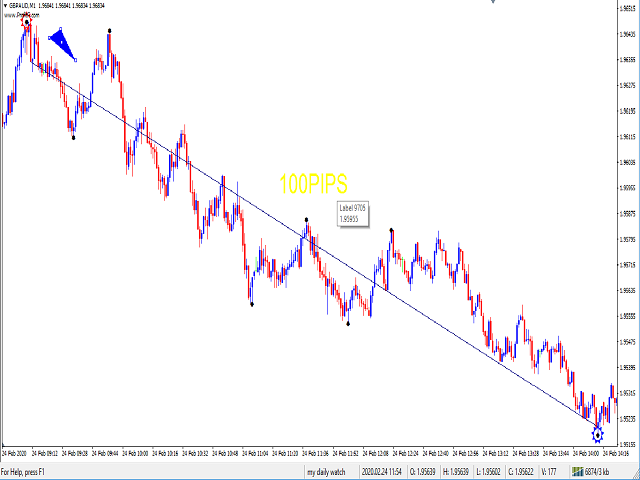
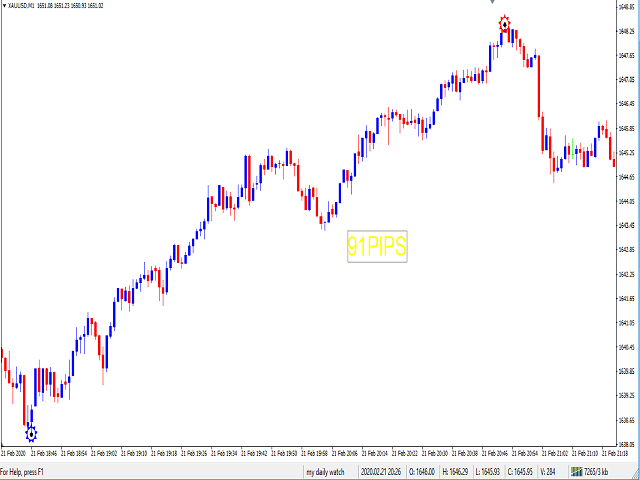
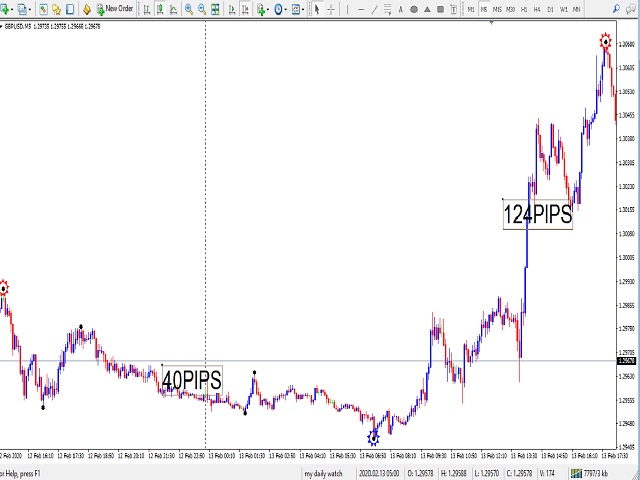
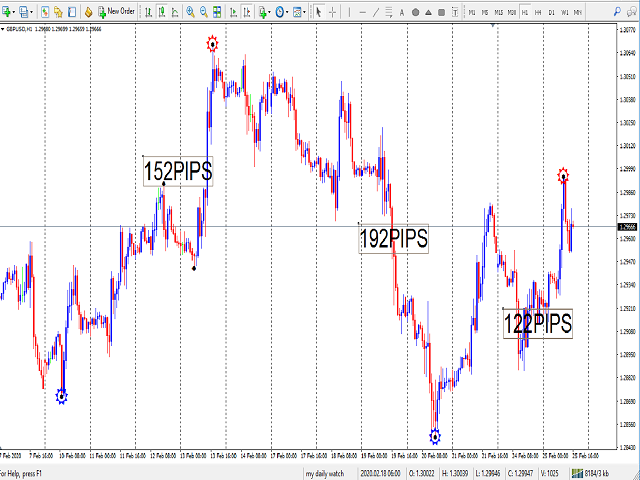
the indicator identify early trend reversal
it can be use by any type of trader; scalper, day trader, swing trader
it works for all timeframe
IT SEND NOTIFICATION DOWN TO YOUR MOBILE PHONE
HOW TO USE ?
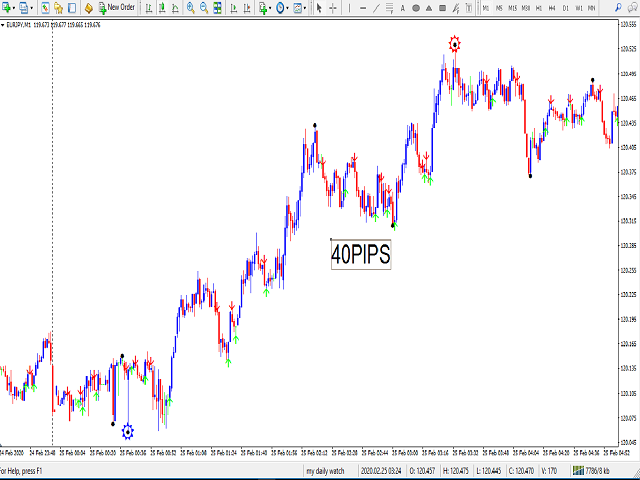
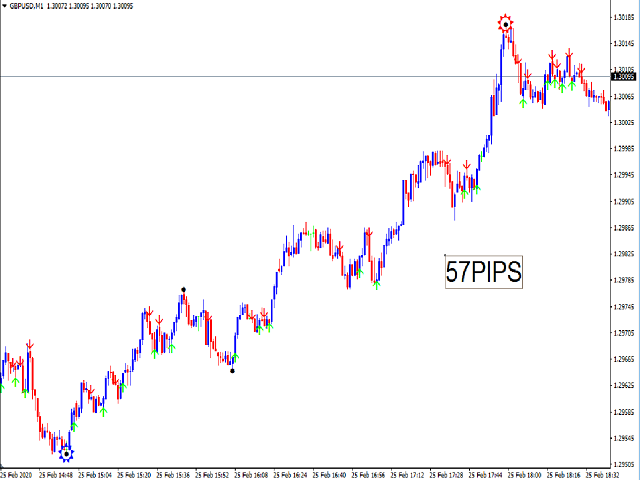
take trade when the BLUE OR RED BOOM REVERSAL INDICATOR PAINTS
MY STRATEGY
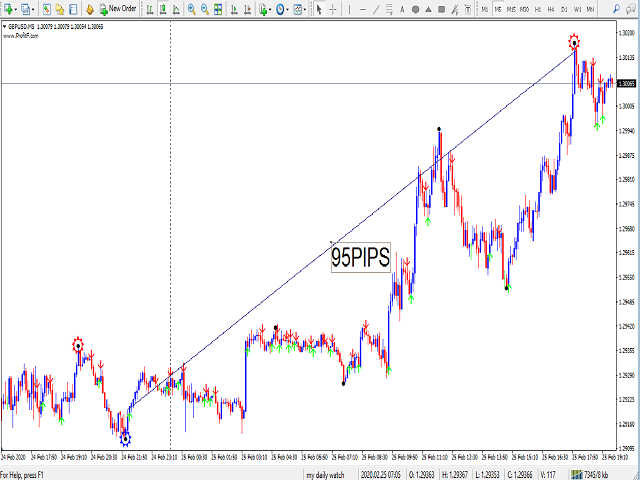
FOR SCALPER
BUY: look for Blue boom reversal indicator on 15Mins or 30Mins Timeframe and return to 1Mins timeframe, take trades when the Blue boom reversal indicator paints
SELL: look for RED boom reversal indicator on 15Mins or 30Mins Timeframe and return to 1Mins timeframe, take trades when the Red boom reversal indicator paints
FOR DAY TRADER
BUY: look for Blue boom reversal indicator on 1H Timeframe and return to 5Mins OR 15Mins timeframe, take trades when the Blue boom reversal indicator paints
SELL: look for RED boom reversal indicator on 1H Timeframe and return to 5Mins OR 15Mins timeframe, take trades when the Red boom reversal indicator paints
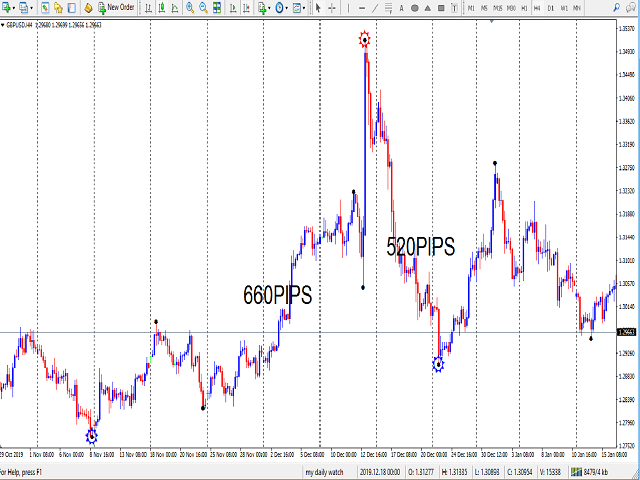
FOR SWING TRADER
BUY: look for Blue boom reversal indicator on 1D Timeframe and return to 1H OR 4H timeframe, take trades when the Blue boom reversal indicator paints
SELL: look for RED boom reversal indicator on 1D Timeframe and return to 1H OR 4H timeframe, take trades when the Red boom reversal indicator paints
*****NOTE: for test with higher time frame and pick a the date a reversal indicator print, write it down then run another test with that date with smaller time frame
This indicator works if you follow the rules
******PLEASE REVIEW THIS INDICATOR TO MAKE NECESSARY ADJUSTMENT*****
Indicator does not have alerts. No response from author.