Ultimate Double Top Bottom Reversal Scanner
- インディケータ
- FXsolutions
- バージョン: 1.11
- アップデート済み: 6 10月 2019
- アクティベーション: 10
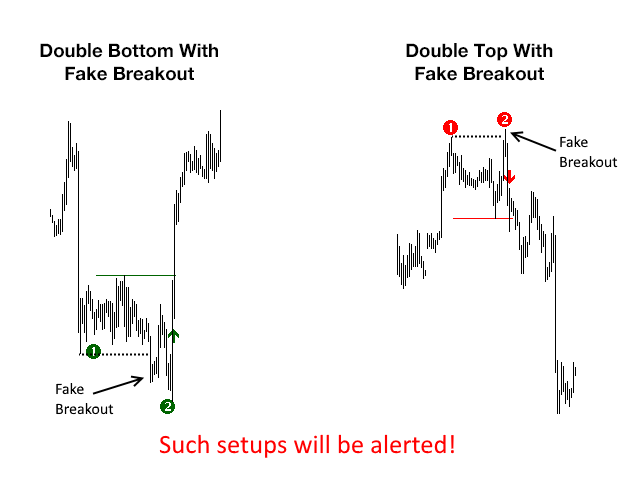
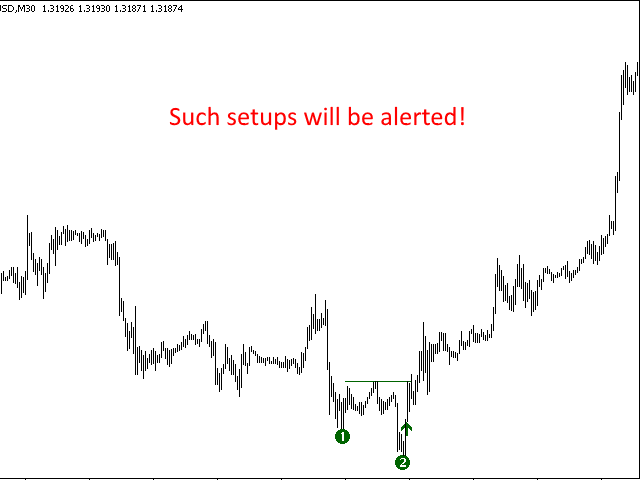
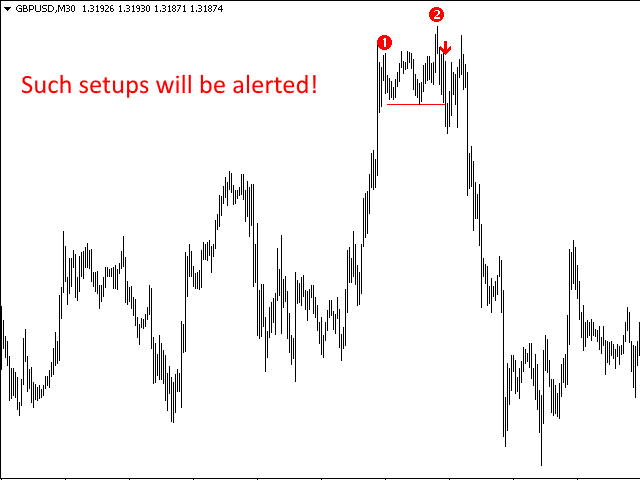
This indicator scans for you up to 30 trading instruments and up to 8 timeframes for occurrences of the high probability reversal patterns: Double Tops/Bottoms with fake breakouts.
Please read also the blog post "Professional Trading With Double Tops/Bottoms And Divergences!" which explains the concepts behind the ULTIMATE Double Top/Bottom indicator and how you can use a professional top-down approach.
You can get alerts via MetaTrader 4, email and push notifications at the moment when a signal occurs on any timeframe and any trading instrument you have configured.
You need to install this indicator on only one single chart. The indicator then scans up to 30 instruments and 8 timeframes automatically for you!
Important
When launched in the strategy tester of MetaTrader 4 (when you test the demo version), the indicator will draw the signals on the chart. This feature is added, so that you can evaluate the signals which will be alerted in real time.
The purpose of this indicator is to alert signals so that you will be able to trade these signals even with a normal day job. Therefore, on live charts you will only see the dashboard view as shown in the video. This indicator will NOT draw signals on live charts.
If you need the signals visible on live charts, then you can additionally purchase the Ultimate Double Top Bottom Reversal Indicator
Parameters
- alertsLong: True = Yes, False = No - if true, then the indicator alerts occurrences of "Double Bottom" signals for long entries
- alertsShort: True = Yes, False = No - if true, then the indicator alerts occurrences of "Double Top" signals for short entries
- alertsViaMT4: True = Yes, False = No - if true, then the indicator gives alerts via MetaTrader 4 popup
- alertsViaEmail: True = Yes, False = No - if true, then the indicator gives alerts via email
- alertsViaPush: True = Yes, False = No - if true, then the indicator gives alerts direct to your mobile phone
- alertsM1: True = Yes, False = No - if true, then the indicator searches for "Double Top/Bottom" signals on M1
- alertsM5: True = Yes, False = No - if true, then the indicator searches for "Double Top/Bottom" signals on M5
- alertsM15: True = Yes, False = No - if true, then the indicator searches for "Double Top/Bottom" signals on M15
- alertsM30: True = Yes, False = No - if true, then the indicator searches for "Double Top/Bottom" signals on M30
- alertsH1: True = Yes, False = No - if true, then the indicator searches for "Double Top/Bottom" signals on H1
- alertsH4: True = Yes, False = No - if true, then the indicator searches for "Double Top/Bottom" signals on H4
- alertsD1: True = Yes, False = No - if true, then the indicator searches for "Double Top/Bottom" signals on D1
- alertsW1: True = Yes, False = No - if true, then the indicator searches for "Double Top/Bottom" signals on W1
- templateName: - if you press a button on the chart (which contains the name of an instrument), then the appropriate chart will open and a template with the specified name will be attached
- checkEveryXSeconds - every X seconds, the indicator checks the next instrument/timeframe for the occurrence of a "Double Top/Bottom" signal
- i1-i30 - define up to 30 instruments, which will be monitored/checked for the occurrence of a "Double Top/Bottom" signal


A very good signals product that makes consistent money knowing how to use it correctly of course. a must buy for active traders imo.