• 概要
  • レビュー
  • コメント

Wave Trend MT4

MT5 Version 

Wave Trend MT4

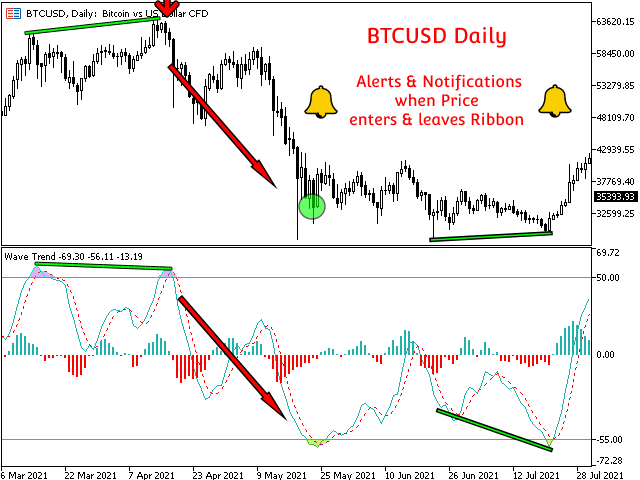
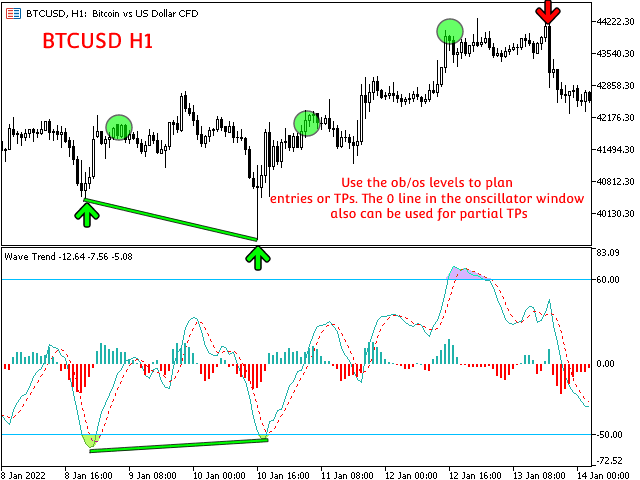
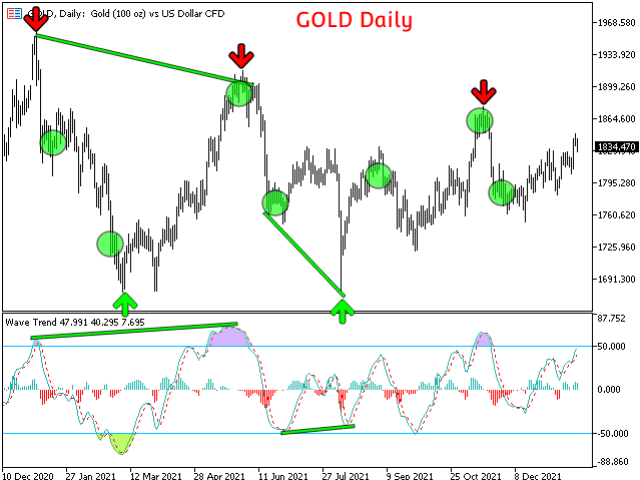
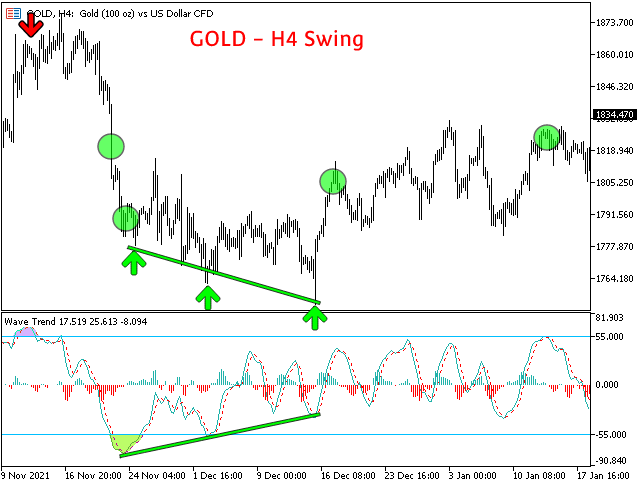
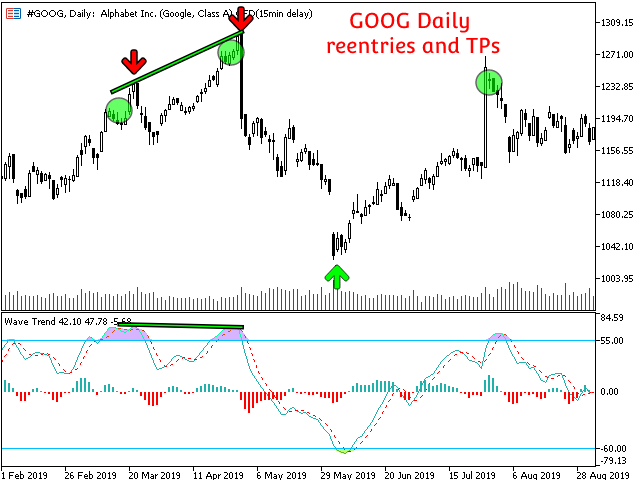
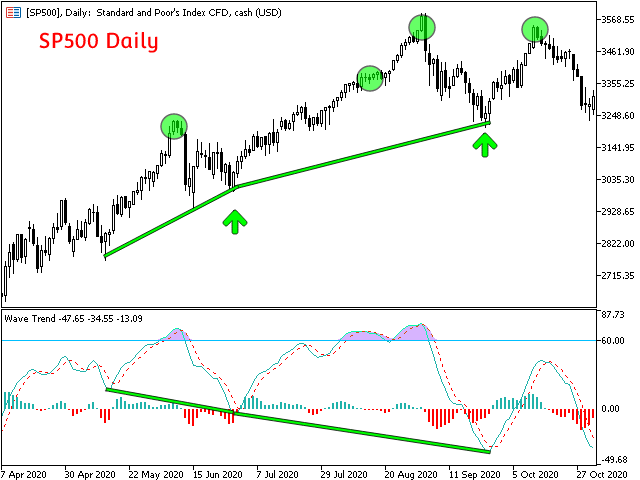
Wave Trend is an oscillator, which helps identifing in a extremely accurate manner market reversals. The Oscillator being obove the overbought level and a cross down of the fast into the slow MA usually indicates a good SELL signal. If the oscillators is below the oversold level and the fast MA crosses over the slower MA usually highlights a good BUY signal. The Wave Trend indicator can be also used when divergences appear against the price, indicating the current movement is losing strenght and may be coming to an end. A combination between signals in high and low timeframes can be used to find awesome entry points.

TRY IT FOR FREE NOW!!

Wave Trend is the   first indicator in the market that allows the user to 100% customize the Moving Average type and the price data source to use for the calculations. This flexibility makes the Wave Trend indicator easily adaptable for any Asset and Timeframe.

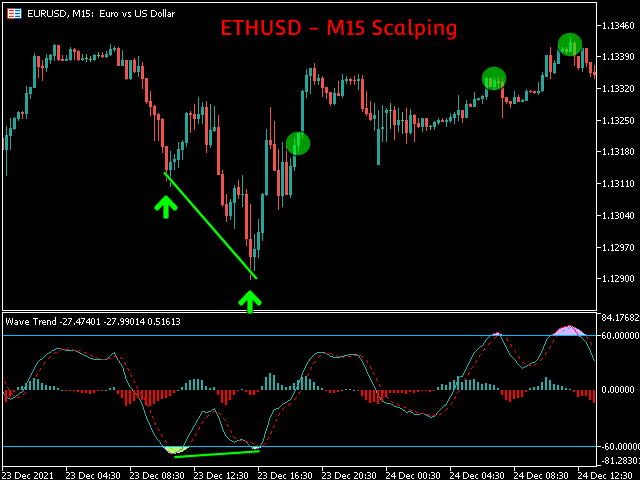
Ideal for HOLD, SCALPING and SWING strategies

At the same time, Wave Trend MT4 provides a system of alerts and notifications on the mobile phone and on the MT4 Terminal when the prices enters the overbought or oversold levels.

Some of the characteristics of the indicator are the following:

  • Time saving
  • Ease of decision-making for entries and taking full or partial benefits
  • Highly customizable
  • Functional in all pairs (Crypto, Forex, Stocks, Indices, Commodities ...)
  • Perfect for Scalping or Swing trading
  • Alerts and notifications on the MT4 terminal and on the mobile phone
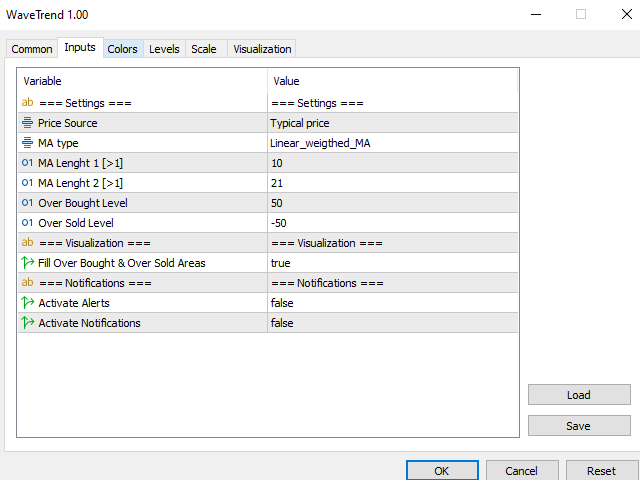
Input parameters

Settings:

  • Price Source: Price source for the calculations
  • MA type: Moving average type for the algorithm(SMA, EMA, Linear Weighted MA, Smoothed MA)
  • MA Lenght 1 [>1]: MA Period for the first MA
  • MA Lenght 2 [>1]: MA Period for the second MA
  • Over Bought Level: Level to set the over bought area
  • Over Sold Level: Level to set the over sold area
    Visualization:

    • Fill Over Bought and Over Sold Areas: Fill the Over Bought and Over Sold areas in the indicator's window

    Notifications:

    • Activate Alerts: Enables alerts on the MT4 Terminal if price enters the OB/OS levels
    • Activate Notifications: Enables phone Notifications

    Support and questions

    Do not hesitate to contact me for any questions and support

    Author

    Diego Arribas, private investor and speculator, automation engineer in the aerospace industry

    おすすめのプロダクト
    「Auto FIBO Pro」Crypto_Forex インジケーターは、取引の補助ツールとして最適です。 - インジケーターは、フィボナッチ レベルとローカル トレンド ライン (赤色) を自動的に計算してチャート上に配置します。 - フィボナッチ レベルは、価格が反転する可能性のある重要な領域を示します。 - 最も重要なレベルは、23.6%、38.2%、50%、61.8% です。 - リバーサル スキャルピングやゾーン グリッド取引に使用できます。 - Auto FIBO Pro インジケーターを使用して、現在のシステムを改善する機会も多数あります。 - Info Spread Swap Display があり、接続されている外国為替ペアの現在のスプレッドとスワップを表示します。 - ディスプレイには、アカウントの残高、エクイティ、マージンも表示されます。 - Info Spread Swap Display は、チャートのどのコーナーにも配置できます。 0 - 左上コーナー、1 - 右上、2 - 左下、3 - 右下。 // 素晴らしいトレーディング ロボットとインジケーター
    Owl smart levels
    Sergey Ermolov
    4.28 (36)
    MT5版  |   FAQ Owl Smart Levels Indicator   は、 Bill Williams   の高度なフラクタル、市場の正しい波構造を構築する Valable ZigZag、エントリの正確なレベルをマークする Fibonacci レベルなどの一般的な市場分析ツールを含む 1 つのインジケーター内の完全な取引システムです。 利益を得るために市場と場所に。 戦略の詳細な説明 インジケータを操作するための指示 顧問-取引助手 プライベートユーザーチャット ->購入後に私に書いて、私はプライベートチャットにあなたを追加し、あなたはそこにすべてのボーナスをダウンロードすることができます 力はシンプルさにあります! Owl Smart Levels   取引システムは非常に使いやすいので、専門家にも、市場を勉強し始めて自分で取引戦略を選択し始めたばかりの人にも適しています。 戦略と指標に秘密の数式や計算方法が隠されているわけではなく、すべての戦略指標は公開されています。 Owl Smart Levels を使用すると、取引を開始するためのシグナルをすばやく確認し、注
    Noize Absorption Index - is the manual trading system that measures the difference of pressure between bears forces and bulls forces. Green line - is a noize free index that showing curent situation. Zero value of index shows totally choppy/flat market.Values above zero level shows how powerfull bullish wave is and values below zero measures bearish forces.Up arrow appears on bearish market when it's ready to reverse, dn arrow appears on weak bullish market, as a result of reverse expectation. S
    Super Reversal Pattern Indicator Unlock the power of advanced pattern recognition with our Super Reversal Pattern Indicator. Designed for traders seeking precision and reliability, this indicator identifies one of the most effective reversal patterns in technical analysis, offering a significant edge in your trading strategy. Key Features: Non-Repainting Accuracy: Enjoy the confidence of non-repainting technology. Once a Super Reversal Pattern is detected, it remains static, providing consiste
    VR Cub
    Vladimir Pastushak
    VR Cub は、質の高いエントリーポイントを獲得するためのインジケーターです。このインジケーターは、数学的計算を容易にし、ポジションへのエントリーポイントの検索を簡素化するために開発されました。このインジケーターが作成されたトレーディング戦略は、長年にわたってその有効性が証明されてきました。取引戦略のシンプルさはその大きな利点であり、初心者のトレーダーでもうまく取引することができます。 VR Cub はポジション開始ポイントとテイクプロフィットとストップロスのターゲットレベルを計算し、効率と使いやすさを大幅に向上させます。取引の簡単なルールを理解するには、以下の戦略を使用した取引のスクリーンショットを見てください。 設定、設定ファイル、デモ版、説明書、問題解決方法は、以下から入手できます。 [ブログ] レビューを読んだり書いたりすることができます。 [リンク] のバージョン [MetaTrader 5] エントリーポイントの計算ルール ポジションをオープンする エントリーポイントを計算するには、VR Cub ツールを最後の高値から最後の安値までストレッチする必要があります。 最初
    Crypto_Forex MT4 用インジケーター「3 Black Crows パターン」 - インジケーター「3 Black Crows パターン」は、プライスアクション取引に非常に効果的です。再描画なし、遅延なし。 - インジケーターは、チャート上の弱気な「3 Black Crows」パターンを検出します。チャート上の赤い矢印信号 (画像を参照)。 - PC、モバイル、および電子メールアラート付き。 - また、その兄弟である強気な「3 White Soldiers パターン」インジケーターも利用できます (以下のリンクに従ってください)。 - インジケーター「3 Black Crows パターン」は、サポート/レジスタンスレベルと組み合わせるのに最適です。 // より優れたエキスパートアドバイザーとインジケーターは、こちらで入手できます: https://www.mql5.com/en/users/def1380/seller これは、この MQL5 ウェブサイトでのみ提供されるオリジナル製品です。
    This indicator is designed for trading based on the trading strategy presented by Alexander Elder. The thick and thin color histograms of the indicator correspond to the values ​​of MACD and OsMA with the parameters set by the user. If the indicator histogram is greater than zero, then the MACD or OsMA value is greater than zero. If the indicator histogram is less than zero, then the MACD or OsMA value is less than zero. As an additional element, the indicator indicates the direction of the mo
    トレンドオシレーターは、高度なカスタム Crypto_Forex インジケーター、効率的な取引ツールです! - 高度な新しい計算方法を使用 - パラメーター「計算価格」のオプションは 20 種類。 - これまで開発された中で最もスムーズなオシレーター。 - 上昇トレンドの場合は緑色、下降トレンドの場合は赤色。 - 売られすぎの値: 5 未満、買われすぎの値: 95 以上。 - このインジケーターを使用すると、標準戦略をアップグレードする機会が十分にあります。 - PC およびモバイルアラート付き。 // より優れたエキスパートアドバイザーとインジケーターは、こちらで入手できます: https://www.mql5.com/en/users/def1380/seller これは、この MQL5 Web サイトでのみ提供されるオリジナル製品です。
    これは、キャンドルの終値を予測する指標です。 このインジケータは、主にD1チャートでの使用を目的としていますが. この指標は、従来の外国為替取引とバイナリオプション取引の両方に適しています。 インジケーターは、スタンドアロンのトレーディングシステムとして使用することも、既存のトレーディングシステムへの追加として機能させることもできます。 このインジケーターは、現在のキャンドルを分析し、キャンドル自体の内部の特定の強度係数と、前のキャンドルのパラメーターを計算します。 したがって、この指標は、市場の動きのさらなる方向性と現在のキャンドルの終値を予測します。 この方法のおかげで、この指標は、短期の日中取引だけでなく、中期および長期の取引にも適しています。 インジケーターを使用すると、市場の状況の分析中にインジケーターが生成する潜在的な信号の数を設定できます。 インジケーターの設定には、このための特別なパラメーターがあります。 また、インジケーターは、チャート上のメッセージの形式で、電子メールで、およびPUSH通知の形式で、新しい信号について通知することができます。 購入後は必ず私に書いて
    This is a trend indicator without redrawing Developed instead of the binary options strategy (by the color of the Martingale candlestick) Also works well in forex trading When to open trades (binary options) A signal will appear in the place with a candle signaling the current candle It is recommended to open a deal for one candle of the current timeframe M1 and M5 When a blue dot appears, open a deal up When a red dot appears, open a trade down. How to open trades on Forex. When a signal is rec
    The Th3Eng PipFinite indicator is based on a very excellent analysis of the right trend direction with perfect custom algorithms. It show the true direction and the best point to start trading. With StopLoss point and Three Take Profit points. Also it show the right pivot of the price and small points to order to replace the dynamic support and resistance channel, Which surrounds the price. And Finally it draws a very helpful Box on the left side on the chart includes (take profits and Stop loss
    Alpha Trend signは私たちの取引システムを検証し、取引信号を明確に提示し、信号がドリフトすることはありません。 主な機能: •市場が活況を示している地域に応じて、指標に基づいて現在の相場がトレンド相場に属しているか、それとも揺れ相場に属しているかを直感的に判断することができる。 そして、指標の指示矢印に基づいて市場に切り込み、緑の矢印は購入を提示し、赤の矢印は販売を提示する。 •小周期変動による頻繁な取引信号の発生を回避するために、5分以上の時間周期で取引を行うことを推奨します。 •最適な取引タイミングを逃さないために、シグナルプロンプトをオンにすることもできます。 •本指標はトレンド相場をよく予測するだけでなく、幅広振動相場でも利益を得ることができる。 •本指標は大道至簡の原則に基づいており、異なる段階のトレーダーが使用するのに適している。 注意事項: •Alpha Trend signには明確な入退場信号があり、損失を与えないように逆位相操作を提案しない。 •Alpha Trend signは特に成熟した指標であり、デルのチー
    The Penta-O is a 6-point retracement harmonacci pattern which usually precedes big market movements. Penta-O patterns can expand and repaint quite a bit. To make things easier this indicator implements a twist: it waits for a donchian breakout in the right direction before signaling the trade. The end result is an otherwise repainting indicator with a very reliable trading signal. The donchian breakout period is entered as an input. [ Installation Guide | Update Guide | Troubleshooting | FAQ | A
    Chart Patterns Detect 15 patterns (Ascending Triangle, Descending Triangle, Rising Wedge, Falling Wedge, Bullish Flag, Bearish Flag, Bullish Rectangle, Bearish Rectangle Symmetrical triangle, Head and Shoulders, Inverted Head and Shoulders, Triple top, Triple Bottom, Double Top, Double Bottom) Use historical data to calculate the probability of each pattern to succeed (possibility to filter notification according to the chance of success) gives graphic indication about the invalidation level and
    This is a new strategy for SUPPLY DEMAND areas It is based on a calculation using the tick volume to detect the big price action in market for both bear /bull actions this smart volume action candles are used to determine the supply and demand areas prices in between main supply and demand lines indicate sideway market  up arrows will be shown when prices moves above the main supply and the secondary supply lines Down arrows will be shown when prices moves below the main demand and the secondary
    The indicator shows the potential trend direction by cyclical-wave dependence. Thus, all the rays of the intersection will be optimal rays, in the direction of which the price is expected to move, taking into account the indicator period. Rays can be used as a direction for potential market movement. But we must not forget that the approach must be comprehensive, the indicator signals require additional information to enter the market.
    フィボナッチリトレースと拡張ラインツール DiNapoliポイント取引方法とゴールデンセクション取引を使用するトレーダーにとって理想的なMT4プラットフォームのフィボナッチリトレースと拡張ラインツール 主な特長: あなたはフィボナッチリトレースメントの複数のセットを直接描くことができ、重要なリターンポイント間の関係は一目瞭然です。 2.フィボナッチ拡張を描画することができます。 3.フィボナッチフォールドバックとラインの延長は、簡単な観察と数値表示のために左右に動かすことができます。 4.チャートは非常に爽やかな 5.数字キーでサイクルを切り替えることができます。 ファンクションキー: 1。 [戻るを押す、要求に応じて描画する、最大8つのグループにする 2。拡張]を描くには[押す] 3。 \を押すと、現在のサイクルの下にあるすべての拡張機能と折り畳みが削除されます 4。フォールドバックを移動して削除して展開する (1)最初のフォールドバックセットのF5行をクリックします。 一度クリックすると(黄色に変わります)、キーボードのDeleteキーを押すと、フォーカ
    The indicator displays the data of the Stochastic oscillator from a higher timeframe on the chart. The main and signal lines are displayed in a separate window. The stepped response is not smoothed. The indicator is useful for practicing "manual" forex trading strategies, which use the data from several screens with different timeframes of a single symbol. The indicator uses the settings that are identical to the standard ones, and a drop-down list for selecting the timeframe. Indicator Paramet
    まず第一に、この取引インジケーターは再描画されず、再描画されず、遅延しないことを強調する価値があります。これにより、手動取引とロボット取引の両方に理想的なものになります。 ユーザーマニュアル:設定、入力、戦略。 アトミックアナリストは、価格の強さとモメンタムを利用して市場でより良いエッジを見つけるためのPA価格アクションインジケーターです。ノイズや誤ったシグナルを除去し、取引ポテンシャルを高めるための高度なフィルターを備えています。複雑なインジケーターの複数のレイヤーを使用して、アトミックアナリストはチャートをスキャンし、複雑な数学的計算をシンプルなシグナルと色に変換します。これにより、どのような初心者トレーダーでも理解して使用し、一貫した取引の決定を行うことができます。 「アトミックアナリスト」は、新規および経験豊富なトレーダー向けにカスタマイズされた包括的な取引ソリューションです。プレミアムインジケーターとトップノッチの機能を1つの取引戦略に組み合わせ、すべてのタイプのトレーダーにとって汎用性のある選択肢にします。 デイリートレーディングとスキャルピング戦略:高速で正確な
    The Infinity Expert Advisor is a scalper. When the resistance and support levels are broken, trades are opened in the direction of the price movement. Open positions are managed by several algorithms based on the current market situation (fixed stop loss and take profit, trailing stop, holding positions in case of trend indication, etc.). Requirements for the broker The EA is sensitive to spread, slippages and execution quality. It is strongly recommended not to use the EA for currencies with s
    We present you the indicator "Candle closing counter", which will become your indispensable assistant in the world of trading. That’s why knowing when the candle will close can help: If you like to trade using candle patterns, you will know when the candle will be closed. This indicator will allow you to check if a known pattern has formed and if there is a possibility of trading. The indicator will help you to prepare for market opening and market closure. You can set a timer to create a pre
    ROYAL DUTCH SKUNK USES THE TREND WAVE INDICATOR AND IT CAN IDENTIFY THE BEGINNING AND THE END OF A NEW WAVE TREND MOVEMENT. AS AN OSCILLATOR, THE INDICATOR IDENTIFIES THE OVERBOUGHT AND OVERSOLD ZONES. IT WORKS GREAT TO CATCH THE SHORT TERM PRICE REVERSALS AND USES A MARTINGALE STRATEGY TO CLOSE ALL TRADES IN PROFIT. USE DEFAULT SETTINGS ON H1 OR HIGHER TIME FRAME ON ANY PAIR FOR MORE ACCURATE TRADES WHY THIS EA : Smart entries calculated by 6 great strategies The EA can be run on even a $20000
    This indicator obeys the popular maxim that: "THE TREND IS YOUR FRIEND" It paints a Blue line for BUY and also paints a RED line for SELL. (you can change the colors). It gives alarms and alerts of all kinds. IT DOES NOT REPAINT COLOR and can be used for all currency pairs and timeframes. Yes, as easy and simple as that. Even a newbie can use it to make great and reliable trades. MetaTrader 5 version
    This is an arrow indicator without a future function,developed based on the most advanced profit trading algorithms.It has the most innovative and advanced dual trend analysis module, as well as the latest and highly effective market trend prediction algorithm.Trends are your friends, and following larger trends can earn the maximum profit in foreign exchange. This indicator helps traders identify current trends and track them. Someone once made a profit of 10 times in a week by relying on it.No
    "The trend is your friend" is one of the best known sayings in investing, because capturing large trendy price movements can be extremely profitable. However, trading with the trend is often easier said than done, because many indicators are based on price reversals not trends. These aren't very effective at identifying trendy periods, or predicting whether trends will continue. We developed the Trendiness Index to help address this problem by indicating the strength and direction of price trend
    Binary Options Support Resistance Indicator This indicator is designed for binary options trading and effectively shows retracements from support and resistance levels. Signals appear on the current candle. A red arrow pointing downwards indicates a potential selling opportunity, while a blue arrow pointing upwards suggests buying opportunities. All that needs adjustment is the color of the signal arrows. It is recommended to use it on the M1-M5 timeframes as signals are frequent on these timef
    Strong Retracement Points Pro demo edition! SRP (Strong Retracement/Reversal Points) is a powerful and unique support and resistance indicator. It displays the closest important levels which we expect the price retracement/reversal! If all level are broken from one side, it recalculates and draws new support and resistance levels, so the levels might be valid for several days depending on the market! If you are still hesitating to start using this wonderful tool, you can check this link to see h
    The indicator detects and displays Shark harmonic pattern (see the screenshot). The pattern is plotted by the extreme values of the ZigZag indicator (included in the resources, no need to install). After detecting the pattern, the indicator notifies of that by a pop-up window, a mobile notification and an email. The indicator highlights the process of the pattern formation and not just the complete pattern. In the former case, it is displayed in the contour triangles. After the pattern is comple
    [ZhiBiCCI]インディケータは全てのサイクル使用に適しており、そして全ての市場品種にも適しています。 [ZhiBiCCI]緑色の実線は強気の発散の逆転です。緑色の点線は古典的な強気の発散です。 [ZhiBiCCI]赤への実線は逆弱気の発散である。赤い点線は古典的な弱気の発散です。 [ZhiBiCCI]はパラメータ(アラート、メール送信、通知送信)で設定でき、(true)に設定するとインスタント信号をアラームウィンドウに送信し、Eメール、インスタントメッセージを送信できます。 パラメータ設定の説明 [displayAlert]:これはアラームスイッチで、trueに設定され、矢印が表示されればプロンプトに自動的に警告され、falseに設定されれば警告されません。 [sendmail_NO_OFF]:これはメールを送信するためのスイッチで、trueに設定します。矢印が表示されていればMT4で設定したメールボックスにメールを送信し、falseに設定されていればメールを送信しません。 [sendnotification_NO_OFF]:これはインスタントメッセージを送信するた
    Wave WOLD MT4外国為替インジケータは、Wolf waveを検索し、取引端末の現在のウィンドウに表示するように設計されています。 取引でオオカミの波を使用するトレーダーのための優れた指標。 取引戦略への適用は、効率と収益性を大幅に向上させます。 指標に関する情報 他のWolf wave指標とは異なり、Wave WOLD MT4外国為替指標は、その有効性を大幅に高める多くの機能を備えています: 最初のものは開いているWindows5Pointパラメータ(真の値)情報サポートを提供します。つまり、Wolf waveが登場したチャートのウィンドウを展開します。 たとえば、EURUSD、AUDUSD、GBPUSDチャートが開いていて、それぞれにWave WOLD MT4インジケーターがインストールされている場合、ユーロモデルが検出されると、対応するチャートが自動的に他のチャートの上に前景に表示され、多数の商品を取引するときに非常に便利になります。  2番目の機能は、ユーザーが自分で選択できるパラメータ(デフォルト設定(12,26,9))であるmacd上の組み込みの発散分析です。
    このプロダクトを購入した人は以下も購入しています
    Dynamic Forex28 Navigator - 次世代の Forex 取引ツール。 現在 49% オフ。 Dynamic Forex28 Navigator は、長年人気のインジケーターを進化させたもので、3 つの機能を 1 つにまとめています。 Advanced Currency Strength28 インジケーター (レビュー 695 件)  + Advanced Currency IMPULSE with ALERT (レビュー 520 件) + CS28 コンボ シグナル (ボーナス)。 インジケーターの詳細 https://www.mql5.com/en/blogs/post/758844 次世代の Strength インジケーターが提供するもの  オリジナルで気に入っていたすべての機能が、新機能と精度の向上によって強化されました。 主な機能: 独自の通貨強度計算式。 すべての時間枠でスムーズかつ正確な強度ライン。 トレンドの特定と正確なエントリーに最適です。 ダイナミックマーケットフィボナッチレベル (マーケットフィボナッチ)。 このインジケーターに固有
    !SPECIAL SALE!  An exclusive indicator that utilizes an innovative algorithm to swiftly and accurately determine the market trend. The indicator automatically calculates opening, closing, and profit levels, providing detailed trading statistics. With these features, you can choose the most appropriate trading instrument for the current market conditions. Additionally, you can easily integrate your own arrow indicators into Scalper Inside Pro to quickly evaluate their statistics and profitability
    Gold Venamax   - これは最高の株式テクニカル指標です。 指標アルゴリズムは資産の価格変動を分析し、ボラティリティと潜在的なエントリーゾーンを反映します。 インジケーターの機能: これは、快適で収益性の高い取引のためのマジックとトレンド矢印の 2 つのブロックを備えたスーパー インジケーターです。 チャート上にブロックを切り替えるための赤いボタンが表示されます。 マジックはインジケーター設定で設定されているため、異なるブロックを表示する 2 つのチャートにインジケーターをインストールできます。 Gold Venamax は、異なる矢印バッファー (GV と SD) を備えた 2 つのチャートに配置できます。 これを行うには、設定で異なる Magic を選択する必要があります。たとえば、あるマジック = 999、別のマジック = 666 を選択します。次に、チャート上の赤いボタンで矢印バッファを選択できます。 入力するのに最適な信号 = 両方のバッファ (GV および SD) の信号矢印 + 3 本すべての MA ライン (赤または青) の方向に従います + TMA
    Advanced Supply Demand
    Bernhard Schweigert
    4.91 (294)
    現在33%オフ 初心者にもエキスパートトレーダーにも最適なソリューション このインジケーターは独自の機能と新しい公式を多数内蔵しており、ユニークで高品質かつ手頃な取引ツールです。このアップデートでは、2つの時間枠ゾーンを表示できるようになります。より長いTFだけでなく、チャートTFとより長いTF(ネストゾーンを表示)の両方を表示できます。すべてのSupply Demandトレーダーの皆さんのお気に召すはずです。:) 重要情報の公開 Advanced Supply Demandの可能性を最大化するには、 https://www.mql5.com/ja/blogs/post/720245 にアクセスしてください。   エントリーまたはターゲットの正確なトリガーポイントを正確に特定できれば取引がどのように改善されるか想像してみてください。新しい基盤となるアルゴリズムに基づいて構築されているため、買い手と売り手の間の潜在的な不均衡をさらに簡単に特定できます。これは、最も強い需要と供給のゾーンと、過去のパフォーマンス(古いゾーンを表示)がグラフィカルに表現されるためです。これらの機能は、最適な
    現在20%OFF! 初心者やエキスパートトレーダーに最適なソリューションです。 このインディケータは、エキゾチックペア・コモディティ・インデックス・先物など、あらゆるシンボルの通貨の強さを表示することに特化したインディケータです。金、銀、原油、DAX、US30、MXN、TRY、CNHなどの通貨の強さを表示するために、9行目にどのシンボルでも追加することができます。独自の機能を多数搭載し、新しい計算式を採用したため、ユニークで高品質、かつ手頃な価格のトレーディングツールとなっています。新しいトレンドやスキャルピングチャンスのトリガーポイントを正確に把握することができるため、あなたのトレードがどのように改善されるか想像してみてください。 ユーザーマニュアル:ここをクリック   https://www.mql5.com/en/blogs/post/708876 すべての時間枠に対応します。あなたはすぐにトレンドを見ることができるようになります! 新しいアルゴリズムに基づいて設計されているため、潜在的な取引の特定と確認がより簡単になります。これは、8つの主要通貨と1つのシンボルの強弱
    System Trend Pro - This is the best trend trading indicator!!! You can get this indicator for free -  Quantum Entry PRO The indicator no repaint!!!   The indicator has   MTF   mode, which adds confidence to trading on the trend (   no repaint   ). How to trade? Everything is very simple, we wait for the first signal (big arrow), then wait for the second signal (small arrow) and enter the market in the direction of the arrow. (See screens 1 and 2.) Exit on the opposite signal or take 20-30 pips
    Golden Trend Indicator
    Noha Mohamed Fathy Younes Badr
    4.9 (10)
    Golden Trend indicator  is The best indicator for predicting trend movement this indicator never lags and never repaints and never back paints    and give  arrow buy and sell    before the candle appear  and it will help you and  will make your trading decisions clearer its work on all currencies and  gold and crypto and all time frame This unique  indicator uses very secret algorithms to catch the  trends, so you can trade using this indicator and see the trend clear on charts  manual guide and
    指示する     ロシア     -        utilizar con   el indicador の ESP 推奨事項 -   TPSpro トレンド プロフェッショナル版 -   MT5のバージョン 最も重要なことは、将来においても最も重要なことです。 機能のプリンシパル: ゾーンのほとんどは、ベンダーとコンプラドールによってアクティブ化されます。 状況を直感的に把握できるよう、初期の衝動を修正します。 LOGIC AI: MUESTRA zonas (círculos) parabuscar puntos de entrada cuando se activa una plantilla 視覚的に優れた視覚効果があり、最も重要な機能がすべて揃っていることに注意してください。 優れたニベレス/ゾーンの視覚化 (modo MTF) 世界で最も人気のある場所/ゾーンです。これを使用するのに最適な方法です (   TPSproTREND PRO   )。 アルゴリズム プロフェッショナル セパラド パソ ア パソ パラ オペラ それは、オペラハウスやコントラ・デ・エラの指導におい
    これはほぼ間違いなく、MetaTraderプラットフォームで見つけることができる最も完全な調和価格形成自動認識インジケーターです。 19種類のパターンを検出し、フィボナッチプロジェクションをあなたと同じように真剣に受け止め、潜在的逆転ゾーン(PRZ)を表示し、適切なストップロスとテイクプロフィットレベルを見つけます。 [ インストールガイド | 更新ガイド | トラブルシューティング | よくある質問 | すべての製品 ] 19の異なる調和価格形成を検出します プライマリ、派生および補完フィボナッチ投影(PRZ)をプロットします 過去の価格行動を評価し、過去のすべてのパターンを表示します この指標は、独自の品質とパフォーマンスを分析します 適切なストップロスとテイクプロフィットのレベルを表示します ブレイクアウトを使用して適切な取引を通知します すべてのパターン比をグラフにプロットします 電子メール/音声/視覚アラートを実装します スコット・M・カーニーの本に着想を得て、この指標は最も純粋で急を要するトレーダーのニーズを満たすように設計されています。ただし、トレードを容易にする
    Automated Trendlines
    Georgios Kalomoiropoulos
    5 (16)
    トレンドラインは、外国為替取引におけるテクニカル分析の最も重要なツールです。残念ながら、ほとんどのトレーダーはそれらを正しく描画していません。自動トレンドラインインジケーターは、市場のトレンドの動きを視覚化するのに役立つ本格的なトレーダー向けのプロフェッショナルツールです。 トレンドラインには、強気トレンドラインと弱気トレンドラインの2種類があります。 上昇トレンドでは、外国為替トレンドラインは価格変動の最低スイングポイントを介して描画されます。 少なくとも2つの「最低安値」を接続すると、トレンドラインが作成されます。 下降トレンドでは、トレンドラインは価格変動の最も高いスイングポイントを介して描画されます。 少なくとも2つの「最高値」を接続すると、トレンドラインが作成されます。 トレンドラインが壊れたとき? 弱気のろうそくが強気のトレンドラインの下で閉じ、ろうそくの高さがトレンドラインの上にあるとき、強気のトレンドラインは壊れます。 強気のろうそくが弱気のトレンドラインの上で閉じ、ろうそくの安値がトレンドラインの下にあるとき、弱気のトレンドラインは壊れます。 トレ
    現在26%オフ 初心者やエキスパートトレーダーに最適なソリューション! このインジケーターは、独自の機能と新しい計算式を取り入れた、ユニークで高品質、かつ手頃な価格のトレーディングツールです。たった1枚のチャートで28の為替ペアの通貨強度を読み取ることができます。新しいトレンドやスキャルピングチャンスの引き金となるポイントを正確に特定することができるので、あなたのトレードがどのように改善されるか想像してみてください。 ユーザーマニュアルはこちら  https://www.mql5.com/en/blogs/post/697384 これが最初の1本、オリジナルだ! 価値のないクローンを買わないでください。 特別な サブウィンドウの矢印で強い通貨の勢いを表示 GAPがあなたのトレードを導く! 基準通貨や気配値が売られすぎ・買われすぎのゾーン(外相フィボナッチレベル)にあるとき、個別チャートのメインウィンドウに警告表示。 通貨がレンジの外側から反落した場合、プルバック/リバーサルのアラート。 クロスパターンの特別なアラート 複数の時間枠を選択可能で、トレンドを素早く確認できます
    TPSpro TREND PRO は 、市場を自動的に分析し、トレンドとその各変化に関する情報を提供し、再描画せずに取引に参加するためのシグナルを提供するトレンド指標です。 インディケータは各ローソク足を使用し、個別に分析します。さまざまなインパルス(アップまたはダウンインパルス)を指します。通貨、仮想通貨、金属、株、指数の取引への正確なエントリーポイント! バージョンMT5                   インジケーターの完全な説明   インジケーター -   RFI LEVELS と併用することをお勧めします。 主な機能: レンダリングなしで正確な入力信号! シグナルが表示された場合、それは関連性を維持します。これは、シグナルを提供してからそれを変更する可能性があり、入金時の資金の損失につながる可能性があるリドローインジケーターとの重要な違いです。より高い確率と精度で市場に参入できるようになりました。矢印が表示された後、ターゲットに達する (利益確定) か反転シグナルが表示されるまで、ローソク足を色付けする機能もあります。 STOP LOSS / TAKE PROFITゾー
    TrendMaestro
    Stefano Frisetti
    5 (3)
    note: this indicator is for METATRADER4, if you want the version for METATRADER5 this is the link:  https://www.mql5.com/it/market/product/108106 TRENDMAESTRO ver 2.4 TRENDMAESTRO recognizes a new TREND in the bud, he never makes mistakes. The certainty of identifying a new TREND is priceless. DESCRIPTION TRENDMAESTRO identifies a new TREND in the bud, this indicator examines the volatility, volumes and momentum to identify the moment in which there is an explosion of one or more of these data a
    Wave Price Channel - 衝動と修正を検索するように設計された取引分析システム。 このインジケーターを使用すると、ボラティリティに基づいて構築された価格チャネルの方向に作業することができます。 チャネル上に上向きまたは下向きの矢印が描かれると、この方向に進むことが可能になります。この方向のシグナルは、価格の変化に敏感なドットインジケーターによって確認されます。 同じ色のドットが続く限り信号は継続します。矢印はあるが、同じ色のドットがない場合、その信号は偽であり、ドットが表示されたらそれに従う必要があります。 このインジケーターには、異なる時間枠に対して変更できる唯一の変更可能なパラメーター「価格チャネルの長さ」があります。 タイムフレーム M15 以降での使用を推奨します。 あらゆる取引商品に使用できます。 矢印にはいくつかの種類のアラートがあります。 操作中にシグナルアローを1本のキャンドルに変更することが可能です。 赤い上向き矢印が表示されたら、購入の合図です。赤い点は矢印の軌跡の続きです。 黄色の下矢印が表示された場合は販売の合図であり、黄色の点は矢印の軌跡の
    TRANSACTION SPEEDは、大口注文がいつどこで市場に集積され、その恩恵を受けているかを示す最高品質の指標です。トレンドの変化を非常に早い段階で検知します。インジケーターであると同時にトレーディングシステムでもあります。そのコンセプトはユニークで、驚くほど収益性が高い。 FXでは、ティックボリュームはボリュームと呼ばれ、誤解を招きやすい。実際は、単位時間当たりの価格変動であり、事実上、取引速度(TRANSACTION SPEED)です。 このインジケーターは、FXにおける出来高の概念を完全に見直し、正しい方法で論理的に定義し、このロジックを適用することで、ユニークで正確なトップレベルの収益ツールになります。 スピードが上がれば、それはより大きな関心とそれに対応するエントリーとエグジットのサインです。 使い方は? このインジケーターは、市場の取引スピードを測定・比較するため、まず最初に行うべきことは以下の通りです。 比較を行う期間を選択することです。 通常、15日前が比較の出発点となります。 インジケータに日付を入力して実行する。 30分または1時間のタイムフレームで、
    このインディケータは、当社の2つの製品 Advanced Currency IMPULSE with ALERT  +   Currency Strength Exotics . のスーパーコンビネーションです。 このインジケーターは全ての時間枠で作動し、8つの主要通貨と1つのシンボルの強弱のインパルスをグラフで表示します。 このインジケータは、金、エキゾチックペア、商品、インデックス、先物など、あらゆるシンボルの通貨強度の加速度を表示することに特化されています。金、銀、原油、DAX、US30、MXN、TRY、CNHなどの通貨強度の加速度(インパルスまたは速度)を表示するために、任意のシンボルを9行目に追加できる、この種の最初のものです。 新しいアルゴリズムに基づいて構築され、潜在的な取引の特定と確認がさらに容易になりました。これは、通貨の強さや弱さが加速しているかどうかをグラフィカルに表示し、その加速の速度を測定するためです。加速すると物事は明らかに速く進みますが、これはFX市場でも同じです。つまり、反対方向に加速している通貨をペアリングすれば、潜在的に利益を生む取引を特定
    Please follow the "How To Trade" instructions exactly for best results Wycoff theory is vastly used by institutional traders but when it comes to retail traders the concept isn't well understood by most. It is even more difficult to implement in intraday & swing trading. This No REPAINT indicator helps you in analyzing the market cycles and plots buy/sell signals at the start of trending phase. It studies the market strength of bulls and bears and does a effort Vs reward matrix calculation befor
    このインジケーターは、エリオット波動理論と組み合わせて作動し、2つの方法で使用されます: 自動モード: このモードでは、インジケーターがチャート上の全ての5つのモーティブ波を自動的に検出し、予測とポテンシャルな逆転ゾーンを提供します。また、アラートやプッシュメッセージを生成する能力も備えています。この自動機能により、エリオット波動パターンの識別と分析のプロセスが効率化されます。 手動モード: このオプションは、エリオット波動理論を手動で扱いたいトレーダー向けです。9つの段階を使用して波を描画することができます。各段階は、表示された後に描画されたラインを調整して個別に定義できます。この機能により、手動で波を描画するプロセスがより効率的になります。重要な点として、すべての描画データが将来の参照のためにプラットフォームのデータフォルダに保存されることに注意してください。 パラメータ: Name: インジケーターの名前。 Use_System_Visuals: インジケーターのテーマを有効または無効にして、取引プラットフォーム全体の外観に合わせます。 Explain_Comment: 波の番号
    Advanced version of CyberZingFx Volume Plus, the ultimate MT4 indicator for traders seeking highly accurate buy and sell signals. With an additional strategy and price action dot signals that enhances its effectiveness, this indicator offers a superior trading experience for professionals and beginners alike. The CyberZingFx Volume Plus Advanced version combines the power of volume analysis and historical price data with an additional strategy, resulting in even more precise and reliable signals
    Scalper Boss は、多層的なロジックフレームワークを通じて市場状況を評価し、最適なエントリーポイントとエグジットポイントを特定するために設計された先進的な分析ツールです。変化する市場環境に適応し、明確な視覚的なシグナルやトレンドラインを提供します。その主な価値は、市場のノイズをフィルタリングし、意味のある動きを捉える能力にあり、特にスキャルピングや日中取引に有用です。 Scalper Boss は利益を保証するものではありませんが、その強力な構造により、特にボラティリティが高い市場やレンジ相場において、トレーダーが市場をより深く理解する手助けをします。 インジケーターの利点 多層分析: 移動平均線の交差とトレンドラインを組み合わせ、市場を包括的に分析。 高精度: 市場レンジの分析を通じてノイズをフィルタリングし、誤ったシグナルを削減。 柔軟性: カスタマイズ可能なパラメーターにより、あらゆる金融商品や取引スタイルに適応。 使いやすさ: 矢印やトレンドラインなどの明確な視覚要素により、シグナルの解釈が簡単。 汎用性: スキャルピング、日中取引、中期取引戦略にも適応可能。 インジ
    現在20%OFF! 初心者やエキスパートトレーダーのためのベストソリューション! このダッシュボードソフトウェアは、28の通貨ペアで動作しています。それは私達の主要な指標(高度な通貨の強さ28と高度な通貨インパルス)の2に基づいています。それは全体の外国為替市場の大きい概観を与えます。それは、すべての(9)時間枠で28の外国為替ペアのための高度な通貨の強さの値、通貨の動きの速度と信号を示しています。チャート上で1つのインディケータを使用して市場全体を観察し、トレンドやスキャルピングの機会をピンポイントで見つけることができたら、あなたのトレードがどのように改善されるか想像してみてください。 このインディケータには、強い通貨と弱い通貨の識別、潜在的な取引の識別と確認がより簡単になるような機能が搭載されています。このインディケータは、通貨の強さや弱さが増加しているか減少しているか、また、すべての時間枠でどのように機能しているかをグラフィカルに表示します。 新機能として、現在の市場環境の変化に適応するダイナミックなマーケットフィボナッチレベルが追加され、すでに当社のAdvanced
    Bomb Bank Signal
    Igor Pereira Calil
    5 (1)
    Bomb Bank シグナル: MetaTrader 4 の信頼度インジケーター Bomb Bank Signal は、金融市場で最も関連性の高いトレンドを特定するように設計された MetaTrader 4 の強力なインジケーターです。動きを正確に予測するツールをお探しなら、Bomb Bank が最適です。 仕組み: このインジケーターは、出来高分析、ローソク足終値、対称トレンドという 3 つの異なる方法を組み合わせて、売買の機会を検出してシグナルを送ります。 Bomb Bank は、買いの機会を特定するときは「爆弾」のようなものであり、売りシグナルを検出するときは「ドクロ」のようなものです。 ボムバンクはなぜ違うのですか? 完全な信頼性: Bomb Bank Signal は信号を削除しません。一度シグナルが発せられると、シグナルは残り続けるので、チャンスを逃すことはありません。 極めて高い精度: Bomb Bank は誤った信号を送信しません。リアルタイムで最新情報を更新し、市場の進化に合わせて調整しながら、以前のシグナルの透明性を維持します。 ライブアップデート: シ
    Live Signal Bonus: when you buy or rent the indicator, you get Gold Pro Scalper   or System Trend Pro absolutely free.(unlimited) After purchase, contact me to learn more about how to get the bonus indicator that pairs perfectly with Quantum Entry for improved merging! Quantum Entry is a powerful price action trading system built on one of the most popular and widely known strategies among traders: the Breakout Strategy! This indicator produces crystal clear buy and sell signals based on break
    CONTACT US  after purchase to get the Indicator Manual. Try Now—Limited 50% Discount for First 10 Buyers! Download the  Metatrader 5 Version Due to regulatory restrictions, our service is unavailable in certain countries such as India, Pakistan, and Bangladesh. William Delbert Gann (W.D. Gann) was an exceptional market analyst, whose trading technique was based on a complex blend of mathematics, geometry, astrology, and ancient mathematics which proved to be extremely accurate. A Note from t
    このダッシュボードは、選択されたシンボルの最新の利用可能なハーモニックパターンを表示するので、時間を節約し、より効率的に / MT5バージョン 。 無料インジケーター: Basic Harmonic Pattern インジケーター列 Symbol : 選択したシンボルが表示されます。 Trend : 強気または弱気 Pattern : パターンの種類(ガートレー、バタフライ、バット、カニ、サメ、サイファー、ABCD) Entry : エントリー価格 SL: ストップロス価格 TP1: 1回目の利食い価格 TP2: 2回目の利食い価格 TP3: 3回目の利食い価格 Current price : 現在値 Age (in bars):  最後に描画されたパターンの年齢 主な入力項目 Symbols: "28 Major Currency Pairs "または "Selected Symbols "から選択。 Selected Symbols: カンマで区切られた監視したいシンボル("EURUSD,GBPUSD,XAUUSD")。ブローカーがペアに接尾辞または接頭辞を付けている場合
    現在20%OFF! このダッシュボードは、複数のシンボルと最大9つのタイムフレームで動作するソフトウェアの非常に強力な部分です。 このソフトは、弊社のメインインジケーター(ベストレビュー:Advanced Supply Demand)をベースにしています。    Advanced Supply Demand ダッシュボードは、素晴らしい概要を提供します。それは示しています。  ゾーン強度評価を含むフィルタリングされた需給値。 ゾーン内/ゾーンへのPips距離。 ネストされたゾーンがハイライトされます。 選択されたシンボルの4種類のアラートを全ての(9)時間枠で提供します。 それはあなたの個人的なニーズに合わせて高度に設定可能です。 あなたの利益! すべてのトレーダーにとって最も重要な質問です。 市場に参入するのに最適なレベルはどこか? 成功のチャンスとリスク/リターンを得るために、強力な供給/需要ゾーン内またはその近くで取引を開始します。 損切りの最適な位置はどこですか? 最も安全なのは、強力な供給/需要ゾーンの下/上にストップを置くことです。 最適な利益
    Enigmera
    Ivan Stefanov
    5 (4)
    ENIGMERA: 市場の中心 重要:MQL5.comのデモはStrategy Testerで実行されており、Enigmeraの機能を完全には反映していない場合があります。詳細については、説明、スクリーンショット、ビデオをご確認ください。質問があれば、遠慮なくメッセージを送ってください! インジケーターのコードは完全に書き直されました。バージョン3.0は新機能を追加し、インジケーターの開始以来蓄積されたバグを修正しました。 紹介 このインジケーターとトレーディングシステムは、金融市場への注目すべきアプローチです。ENIGMERAはフラクタルサイクルを使用して、サポートとレジスタンスのレベルを正確に計算します。真の蓄積フェーズを示し、方向と目標を提供します。トレンドでも修正でも機能するシステムです。 動作方法 インジケーターのほとんどの機能は、チャートの左側にあるボタンで制御され、市場の状況に迅速に対応できるようになっています。 ボタン ON/OFF – インジケーター全体を表示または非表示にします。 Channel – サポートチャネルを有効にし、許容範囲の偏差を示します。 Dev
    プレシジョン・インデックス・オシレーター(Pi-Osc)は、Precision Trading SystemsのRoger Medcalfによるものです。 バージョン2は、チャートにスーパーファストでロードされるように注意深く再コードされ、その他の技術的な改良も組み込まれて、エクスペリエンスを向上させています。 Pi-Oscは、市場が強制的に行かなければならない、すべての人のストップを取り除くためのポイントである、極限のエクソースト・ポイントを見つけるために設計された正確な取引タイミング信号を提供するために作成されました。 この製品は、極限のポイントがどこにあるかを知るという古代の問題を解決し、トレーダーの生活をはるかにシンプルにします。 これは、業界標準のオシレーターとは異なる強力な要素を持つ高度なコンセンサス・インジケーターです。 使用されている一部の機能には、需要指数、マネーフロー、RSI、スティリング、パターン認識、出来高分析、標準偏差の極値などがあり、異なる長さでこれらのバリエーションが多く含まれています。 初めて見ると、訓練されていない目には、他のオシレーター
    MetaBands M4
    Vahidreza Heidar Gholami
    5 (3)
    MetaBandsは、強力でユニークなアルゴリズムを使用してチャンネルを描画し、トレンドを検出して、トレーダーに取引の入出ポイントを提供することができます。チャンネル指標に加えて、強力なトレンド指標でもあります。入力パラメータを使用して新しいチャンネルを作成するために、異なるタイプのチャンネルを統合することができます。MetaBandsは、市場のイベントについてユーザーに通知するために、すべてのタイプのアラートを使用します。 特徴 ほとんどのチャンネルアルゴリズムをサポート 強力なトレンド検出アルゴリズム 異なるタイプのチャンネルを統合する能力 マルチタイムフレームおよびマルチカレンシー(シグナルマトリックス) すべてのタイプのアラート機能(サウンド、画面フラッシャー、プッシュ通知、メール、ポップアップ、矢印) 再描画しない トレンド検出 MetaBandsは、チャネル内を振動する青いラインを使用してトレンドを検出します。ラインがチャネルの上部バンドに達すると、下降トレンドの開始を示し、下部バンドに達すると上昇トレンドの開始を示します。青いラインが中心ラインに近づくと、市場はコンソリ
    【V1.00】MTF NRPA 5 RSI RTDがリリースされました! 非再描画矢印リアルタイム ダッシュボード。 さまざまな RSI インジケーターを使用するのにうんざりしていて、それらが不正確であると感じた場合は、このツールを試してください。 通常、時間枠内の OBOS レベルを決定するために RSI を 1 つだけインストールします。 悪いニュースは、さまざまな時間枠の OBOS レベルと傾向を一度に確認できないことです。 それが私がこの取引ツールを開発した理由です。 それは次のように説明されています。 この取引ツールでは、5 つの RSI を使用します。 はい、5つです! デフォルトでは、RSI 1 と RSI 2 を大きな時間枠、つまり M30 に設定します。 RSI 1 と RSI 2 の交差は、M30 タイムフレームでトレンドの変化があることを意味します。 次に、現在の(小さい)時間枠に RSI 3 と RSI 4 を設定します。たとえば、M5 でチャートを開いたとします。 RSI 3 と RSI 4 の交差点は、現在のタイムフレーム (M5) でトレンドの変
    作者のその他のプロダクト
    [MT4 Version - Contact Me!] Discover DoIt Gold Guardian , a cutting-edge Expert Advisor engineered for Gold (XAUUSD). Designed to deliver consistent, reliable results in the dynamic gold markets, it combines simplicity with advanced trading algorithms that work for traders at every experience level. Live Signal: [ Click Here ] LAUNCH PROMO: Only a few copies left at the current price! Final Price: $ 999 Bonus Offer: Purchase DoIt GBP Master and get DoIt Gold Guardian or Index Vanguard for free!!
    MT4 Version Advanced Range Breakout Advanced Range Breakout allows you to trade breakouts in an impossible way for any human being. This EA focuses on entering breakouts as soon as the price moves over them, keeping a tight trailing stop loss (TSL) to catch as much as possible of breakouts'  characteristic   explosive price movements while protecting the trade if it turns out to be a fakeout. Feel free to get in touch we me to find out how I successfully managed to passed a prop firm challenge
    [ MT4 Version ] Discover DoIt GBP Master , a cutting-edge Expert Advisor engineered for GBPUSD. Designed to deliver consistent results, it combines simplicity with advanced trading algorithms for traders at any experience level. Live Signal:   Click Here LAUNCH PROMO: Only a few copies left at current price! Final price: 999$ Bonus Offer:   Purchase DoIt GBP Master One and choose 1   Gold Guardian   or   Index Vanguard   for free!! Key Features: Customizable Risk Levels Choose from conservati
    [ MT5 Version ]  [ Kill Zones ]  [ SMT Divergences ] How to trade using Order Blocks:  Click here User Interface Performance:  During testing in the strategy tester, the UI may experience lag. Rest assured, this issue is specific to the testing environment and does not affect the indicator's performance in live trading. Elevate your trading strategy with the  Order Blocks ICT Multi TF  indicator, a cutting-edge tool designed to enhance your trading decisions through advanced order block analys
    MT4 Version TTM Squeeze Momentum TTM Squeeze Momentum is an enhanced indicator ideal for recognizing consolidation periods in the market and the start of the next explosive move. This improved version is a volatility indicator based on John Carter's "TTM Squeeze" in which the histogram is based on a linear regression rather than a simple momentum indicator. Red dots on the middle line indicate that the market has entered a "Squeeze" zone or consolidation period, indicated in this enhanced versio
    [ MT4 Version ] [ Discord Signals ]  MT5 to Telegram Signals Connect your broker account with Telegram and stop missing important notifications.  Would you like to receive Telegram   notifications? Are you looking for a simple way to share trade signals with your followers? Do you need to start documenting your trades with an automated trading diary? Check out this step-by-step   Tutorial . This utility is simple to use and supports a wide variety of settings: Pick your desired Telegram   group
    MT5 Version Gaussian Channel MT4 Gaussian Channel MT4 is the first indicator in the market that uses Ehlers Gaussian Filter methods to define trends. Nowadays, this Gaussian Channel is highly known as a method to support HOLD techniques in crypto. If the price is above the channel the trend is strong, if it comes back to the channel this can react as a resistance and indicate the beginning of a bear market (or Winter) if the price breaks below it. Eventhough the use of this channel focuses on h
    MT5 Version Kill Zones Kill Zones allows you to insert up to 3 time zones in the chart. The visual representation of the Kill Zones in the chart together with an alert and notification system helps you to ignore fake trading setups occurring outside the Kill Zones or specific trading sessions. Using Kill Zones in your trading will help you filter higher probability trading setups. You should select time ranges where the market usually reacts with high volatility. Based on EST time zone, followin
    [ MT4 Version ] [ Telegram Signals ]  MT5 to Discord Signals Connect your broker account with Discord and stop missing important notifications.  Would you like to receive Discord notifications? Are you looking for a simple way to share trade signals with your followers? Do you need to start documenting your trades with an automated trading diary? Check out this step-by-step Tutorial . This utility is simple to use and supports a wide variety of settings: Pick your desired Discord channel and ent
    MT4 Version Fibonacci Bollinger Bands MT5 Fibonacci Bollinger Bands is a highly customizable indicator that shows areas of support and resistance. This indicator combines the logic for the Bollinger Bands with the Fibonacci level. Fibonacci Bollinger Bands is the first   indicator in the market that allows the user to 100% customize up to 12 Fibonacci levels, the Moving Average type and the price data source to use for the calculations. This flexibility makes the Fibonacci Bollinger Bands easily
    FREE
    [ MT5 Version ] How to trade using Order Blocks:  Click here Discover the future of trading with   Order Block Indicator , meticulously crafted for traders who demand unparalleled accuracy and customization. Whether you're scalping or swing trading, this tool is your gateway to mastering Order Blocks and Supply and Demand Zones—critical areas where price reversals often occur. Why Choose Order Block Indicator? Transform Your Trading Strategy: Precision Analysis:   Pinpoint potential accumulation
    MT5 Version Fibonacci Bollinger Bands MT4 Fibonacci Bollinger Bands is a highly customizable indicator that shows areas of support and resistance. This indicator combines the logic for the Bollinger Bands with the Fibonacci level. Fibonacci Bollinger Bands is the   first   indicator in the market that allows the user to 100% customize up to 12 Fibonacci levels, the Moving Average type and the price data source to use for the calculations. This flexibility makes the Fibonacci Bollinger Bands easi
    FREE
    [ MT4 Version ] Bulls and Bears Power Bulls and Bears Power is an indicator that clearly highlights if bulls or bears are currently in control of the market. A price movement started with high Bulls control in the market can indicate the beginning of a new trend movement. The relative indicator power between price peaks also indicates if the movement is losing strength and might foresee a significant correction or a trend reversal. Bulls and Bears Power indicator offers a clear and simplified vi
    [ MT4 Version ] How to trade using the Fear and Greed Indicator:  Click here Uncertain about when to take total or partial profits? The   Fear and Greed   is your reliable companion for making confident trading decisions. This innovative tool offers unparalleled insights into market sentiment, helping you identify key pivot zones and optimize your trading strategy. Why Choose Fear and Greed? Revolutionary Market Insight: Sentiment Analysis:   The first indicator for that reveals the market's Fea
    [ MT4 Version ] Index Vanguard: The Versatile Trading Bot for Every Trader Launch Price Ending Soon! Looking for a reliable trading bot that adapts to your goals and works even with small accounts? Index Vanguard is designed to help you optimize your trading, regardless of your account size or risk preference. Live Signal Currency Pair:   SP500 Minimum Deposit:   $30 Easy Setup, Powerful Performance With Index Vanguard, you get a simple setup that lets you get started quickly. Focus on tradin
    MT4 Version Kill Zones Kill Zones allows you to insert up to 3 time zones in the chart. The visual representation of the Kill Zones in the chart together with an alert and notification system helps you to ignore fake trading setups occurring outside the Kill Zones or specific trading sessions. Using Kill Zones in your trading will help you filter higher probability trading setups. You should select time ranges where   the market   usually reacts with high volatility. Based on   EST time zone, fo
    MT4 Version   MA Ribbon MT5 MA Ribbon is an enhanced indicator with 8 moving averages of increasing periods. MA Ribbon is useful to recognize trend direction,  reversals   and continuation points in the market as well as potential entry, partial take profit and exit points. Entry points for long and shorts position can be found when the price entries or leaves the Ribbon, at retest or a defined number of MA crossovers. It offers a good combination with mostly any volume or momentun indicators to
    MT5 Version Elliot Wave Oscillator MT4 Elliot Wave Oscillator MT4 is an indicator designed to support Elliot Wave counts. The default settings help filtering out the noise in the market allowing a clear perception for the waves counts in differnt timeframes.   Elliot Wave Oscillator high customization level allows the you to optimize this indicator to your personal preferences. Shorter Periods and faster reactive MAs will provide more infomation but will require a higher level of experience for
    MT4 Version Elliot Wave Oscillator MT5 Elliot Wave Oscillator MT5 is an indicator designed to support Elliot Wave counts. The default settings help filtering out the noise in the market allowing a clear perception for the waves counts in differnt timeframes. Elliot Wave Oscillator high customization level allows the you to optimize this indicator to your personal preferences. Shorter Periods and faster reactive MAs will provide more infomation but will require a higher level of experience for a
    [ MT4 Version ] [ EA ] Advanced Bollinger Bands RSI MT5 Advanced Bollinger Bands RSI is an Indicator based on the functionalities of the Advanced Bollinger Bands RSI EA . The scope of this indicator is to provide a more affordable solution for users interested in the alerts coming out of the strategy but not in Autotrading. This strategy uses the Bollinger Bands indicator in combination with the RSI, the signal triggers only when both the BB and the RSI indicate at the same time overbought or ov
    Lumos
    Diego Arribas Lopez
    Lumos Lumos is a multifunctional trading assistant. It gives an overview of the current market situation for a better decision making. The strategy tester only provides a visualization of the application. Lumos is highly customizable and gives you information in multiple timeframes about: MAs, price structure, RSI, RSI MA and an overview of the price distance to possible SLs.
    FREE
    [ How to use the Demo version ]  [ MT5 Version ]  AO unpaid divergences MT4 AO unpaid divergences is the first indicator developed to detailed analyze Regular and Hidden Divergences. It uses this analysis to find out possible entry points and targets. Below some of the characteristics of this indicator:  Time saving Highly customizable Working for all pairs (Crypto, Forex, Stocks, Indices, Commodities...) Suitable for Scalping or Swing trading Possible reversal swings Alerts and Notifications on
    [ MT5 Version ] How to trade using the Fear and Greed Indicator:  Click here Uncertain about when to take total or partial profits? The Fear and Greed is your reliable companion for making confident trading decisions. This innovative tool offers unparalleled insights into market sentiment, helping you identify key pivot zones and optimize your trading strategy. Why Choose Fear and Greed? Revolutionary Market Insight: Sentiment Analysis: The first indicator for that reveals the market's Fear and
    MT5 Version TTM Squeeze Momentum TTM Squeeze Momentum is an enhanced indicator ideal for recognizing consolidation periods in the market and the start of the next explosive move. This improved version is a volatility indicator based on John Carter's "TTM Squeeze" in which the histogram is based on a linear regression rather than a simple momentum indicator. Red dots on the middle line indicate that the market has entered a "Squeeze" zone or consolidation period, indicated in this enhanced versi
    MT5 Version Williams Vix Fix MT4 Need help trying to time the bottoms in the market? Williams Vix Fix MT4 is based on the volatility of the market and grants a huge support for finding out when a correction is comming to its end. TRY IT FOR FREE NOW! Williams Vix Fix MT4 derivates from Larry Williams's VixFix indicator addapted for fitting   every asset class . VIX reprensents the fear and greed in the market based on its volatility. A high VIX value shows fear in the market, this is usually a
    MT5 Version MA Ribbon MT4 MA Ribbon is an enhanced indicator with 8 moving averages of increasing periods. MA Ribbon is useful to recognize trend direction,  reversals   and continuation points in the market as well as potential entry, partial take profit and exit points. Entry points for long and shorts position can be found when the price entries or leaves the Ribbon, at retest or a defined number of MA crossovers. It offers a good combination with mostly any volume or momentun indicators to f
    MT5 Version Multi Timeframe MA MT4 Multi Timeframe MA MT4 is an indicator that offers the representation of up to 3 MAs with different Periods and Timeframes. This allows the user to reprensent in one chart and timeframe information coming from other timeframes and get notified as any of the MAs crosses another one. Multi Timeframe MA is the   first   indicator in the market that offers Multi Timeframe interactions and a high customization   level from up to 7 different MA types (SMA, EMA, WMA,
    [ MT5 Version ] [ EA ] Advanced Bollinger Bands RSI MT4 Advanced Bollinger Bands RSI is an Indicator based on the functionalities of the  Advanced Bollinger Bands RSI EA . The scope of this indicator is to provide a more affordable solution for users interested in the alerts coming out of the strategy but not in Autotrading. This strategy uses the Bollinger Bands indicator in combination with the RSI, the signal triggers only when both the BB and the RSI indicate at the same time overbought or o
    [ MT5 Version ] Supply and Demand Multitimeframe Supply and Demand Multitimeframe is the first indicator in the market that combines multiple aspects like trading volume, price structure and momentum to identify Supply and Demand zones for every asset. The Supply and Demand indicator analyzes simultaneously up to 4 different TFs and represents their information in the current graph. Its interactive UI highlights everytime the price enters a Supply or Demand zone even if the zones are not visibl
    [ MT5 Version ] Bulls and Bears Power Bulls and Bears Power is an indicator that clearly highlights if bulls or bears are currently in control of the market. A price movement started with high Bulls control in the market can indicate the beginning of a new trend movement. The relative indicator power between price peaks also indicates if the movement is losing strength and might foresee a significant correction or a trend reversal. Bulls and Bears Power indicator offers a clear and simplified vi
    フィルタ:
    レビューなし
    レビューに返信