• 概要
  • レビュー (141)
  • コメント (139)
  • 最新情報

Bermaui Deviation Percent

4.94

または(BD%)は、ポイントではなくパーセントでボラティリティを測定するボラティリティ指数です。 BD%の考え方は、0から100パーセントの間で移動するClassic Standard Deviation(CSD)に応じてインデックスを作成することです。

BD%を使用して、異なる期間または異なる時間枠での同じ証券のボラティリティを比較できます。さらに、BD%を使用して、ポイントではなくパーセントで、さまざまな市場のさまざまな証券間のボラティリティを比較できます。

「BD%」の使い方

  • BD%が90%未満で、このレベルを上向きに超えた場合、これは価格がさまざまな領域で変動する可能性があることを示しています。
  • BD%が90%を上回り、その後このレベルを下向きに超え、価格がすでに単純移動平均を上回っている場合、これは新しい上昇トレンドの始まりの兆候です。 BD%がマイナス面に深くなるにつれて、ボラティリティとトレンドの強さが増しています。 BD%が0%の場合、これはボラティリティが最大値にあることを意味します。
  • BD%が90%を上回り、その後このレベルを下向きに超え、価格がすでに単純移動平均を下回っている場合、これは新しい下降トレンドの始まりの兆候です。 BD%がマイナス面に深くなるにつれて、ボラティリティとトレンドの強さが増しています。 BD%が0%の場合、これはボラティリティが最大値にあることを意味します。


BD%の詳細については、 https://www.mql5.com/en/blogs/post/718182からユーザーズマニュアルをお読みください

ご不明な点がございましたら、プライベートメッセージでご連絡いただくか、コメント欄にご記入ください。
ムハンマドアルベルマウイ、CMT

レビュー 20
ovno27
109
ovno27 2024.04.07 09:09 
 

Fantastic filter/Momentum Indicator.

lilinhui
58
lilinhui 2023.03.12 03:33 
 

非常好的指标。我们可以自信地使用这个指标进行交易。

elite luis
3331
elite luis 2023.03.03 16:00 
 

This is Amazing indicator! Author is very responsive and passionate in his work, Best Buy for 2023! I want to get MT5 version also for Bermaui Deviation Percent, Author please code MT5 ok?

おすすめのプロダクト
This is a trend indicator without redrawing Developed instead of the binary options strategy (by the color of the Martingale candlestick) Also works well in forex trading When to open trades (binary options) A signal will appear in the place with a candle signaling the current candle It is recommended to open a deal for one candle of the current timeframe M1 and M5 When a blue dot appears, open a deal up When a red dot appears, open a trade down. How to open trades on Forex. When a signal is rec
The Th3Eng PipFinite indicator is based on a very excellent analysis of the right trend direction with perfect custom algorithms. It show the true direction and the best point to start trading. With StopLoss point and Three Take Profit points. Also it show the right pivot of the price and small points to order to replace the dynamic support and resistance channel, Which surrounds the price. And Finally it draws a very helpful Box on the left side on the chart includes (take profits and Stop loss
VR Cub
Vladimir Pastushak
VR Cub は、質の高いエントリーポイントを獲得するためのインジケーターです。このインジケーターは、数学的計算を容易にし、ポジションへのエントリーポイントの検索を簡素化するために開発されました。このインジケーターが作成されたトレーディング戦略は、長年にわたってその有効性が証明されてきました。取引戦略のシンプルさはその大きな利点であり、初心者のトレーダーでもうまく取引することができます。 VR Cub はポジション開始ポイントとテイクプロフィットとストップロスのターゲットレベルを計算し、効率と使いやすさを大幅に向上させます。取引の簡単なルールを理解するには、以下の戦略を使用した取引のスクリーンショットを見てください。 設定、設定ファイル、デモ版、説明書、問題解決方法は、以下から入手できます。 [ブログ] レビューを読んだり書いたりすることができます。 [リンク] のバージョン [MetaTrader 5] エントリーポイントの計算ルール ポジションをオープンする エントリーポイントを計算するには、VR Cub ツールを最後の高値から最後の安値までストレッチする必要があります。
The Sextet Scalper Pro  is an MT4 indicator that gives signals when new waves are starting in a trend. The trends are calculated using the original " The Sextet " indicator method. You get a free EA to trade with The Sextet Scalper Pro: Free EA . Default settings were optimized on GBPUSD H1 from 2017. EA could be tested on free demo version of The Sextet Scalper Pro, before purchase. Key Features: Uses The Sextet Trend Detection Method which is already a good strategy in itself for detecting l
PipFinite Trend PRO
Karlo Wilson Vendiola
4.9 (2778)
Breakthrough Solution For Trend Trading And Filtering With All Important Features Built Inside One Tool! Trend PRO's smart algorithm detects the trend, filters out market noise and gives entry signals with exit levels. The new features with enhanced rules for statistical calculation improved the overall performance of this indicator. Important Information Revealed Maximize the potential of Trend Pro, please visit www.mql5.com/en/blogs/post/713938 The Powerful Expert Advisor Version Automa
Next level of trend trading here. Possibility 75%, the indicator analyzes the current market to determine short (small dot), middle (circle with a dot inside) and long (cross with a circle and a dot inside) trends.  Wingdings characters of  Aqua color represents the beginning of the UP trend. Wingdings characters of  Orange color represents the beginning of the DOWN trend. Possibility 75% Indicator will improve your trading in the world of forex, commodities, cryptocurrencies and indices.
Looking for an indicator that identifies high-probability price action patterns? Love counter-trend trading? The Kangaroo Tailz indicator might be just for you. This indicator is meant to be used as a reversal detector. I personally would rather enter a position at the beginning of a trend rather than catch the last couple of moves. This indicator does a good job of alerting when price may reverse by identifying price action patterns that occur frequently in markets. Even though this indicator i
フィボナッチリトレースと拡張ラインツール DiNapoliポイント取引方法とゴールデンセクション取引を使用するトレーダーにとって理想的なMT4プラットフォームのフィボナッチリトレースと拡張ラインツール 主な特長: あなたはフィボナッチリトレースメントの複数のセットを直接描くことができ、重要なリターンポイント間の関係は一目瞭然です。 2.フィボナッチ拡張を描画することができます。 3.フィボナッチフォールドバックとラインの延長は、簡単な観察と数値表示のために左右に動かすことができます。 4.チャートは非常に爽やかな 5.数字キーでサイクルを切り替えることができます。 ファンクションキー: 1。 [戻るを押す、要求に応じて描画する、最大8つのグループにする 2。拡張]を描くには[押す] 3。 \を押すと、現在のサイクルの下にあるすべての拡張機能と折り畳みが削除されます 4。フォールドバックを移動して削除して展開する (1)最初のフォールドバックセットのF5行をクリックします。 一度クリックすると(黄色に変わります)、キーボードのDel
[ZhiBiCCI]インディケータは全てのサイクル使用に適しており、そして全ての市場品種にも適しています。 [ZhiBiCCI]緑色の実線は強気の発散の逆転です。緑色の点線は古典的な強気の発散です。 [ZhiBiCCI]赤への実線は逆弱気の発散である。赤い点線は古典的な弱気の発散です。 [ZhiBiCCI]はパラメータ(アラート、メール送信、通知送信)で設定でき、(true)に設定するとインスタント信号をアラームウィンドウに送信し、Eメール、インスタントメッセージを送信できます。 パラメータ設定の説明 [displayAlert]:これはアラームスイッチで、trueに設定され、矢印が表示されればプロンプトに自動的に警告され、falseに設定されれば警告されません。 [sendmail_NO_OFF]:これはメールを送信するためのスイッチで、trueに設定します。矢印が表示されていればMT4で設定したメールボックスにメールを送信し、falseに設定されていればメールを送信しません。 [sendnotification_NO_OFF]:これはインスタントメッセー
これは、キャンドルの終値を予測する指標です。 このインジケータは、主にD1チャートでの使用を目的としていますが. この指標は、従来の外国為替取引とバイナリオプション取引の両方に適しています。 インジケーターは、スタンドアロンのトレーディングシステムとして使用することも、既存のトレーディングシステムへの追加として機能させることもできます。 このインジケーターは、現在のキャンドルを分析し、キャンドル自体の内部の特定の強度係数と、前のキャンドルのパラメーターを計算します。 したがって、この指標は、市場の動きのさらなる方向性と現在のキャンドルの終値を予測します。 この方法のおかげで、この指標は、短期の日中取引だけでなく、中期および長期の取引にも適しています。 インジケーターを使用すると、市場の状況の分析中にインジケーターが生成する潜在的な信号の数を設定できます。 インジケーターの設定には、このための特別なパラメーターがあります。 また、インジケーターは、チャート上のメッセージの形式で、電子メールで、およびPUSH通知の形式で、新しい信号について通知することができます。 購入後は必ず私に書いて
Support and Resistance is a very important reference for trading.  This indicator provides customized support and resistance levels, automatic draw line and play music functions.  In addition to the custom RS, the default RS includes Pivot Point, Fibonacci, integer Price, MA, Bollinger Bands. Pivot Point is a resistance and support system. It has been widely used at froex,stocks, futures, treasury bonds and indexes. It is an effective support resistance analysis system. Fibonacci also known as t
QM (Quasimodo) Pattern is based on Read The Market(RTM) concepts. The purpose of this model is to face the big players of the market (financial institutions and banks), As you know in financial markets, big traders try to fool small traders, but RTM prevent traders from getting trapped. This style is formed in terms of price candles and presented according to market supply and demand areas and no price oscillator is used in it. RTM concepts are very suitable for all kinds of investments, includi
Fourteen plus nine What is it for? Applying Tom DeMark’s TD Sequential serves the purpose of identifying a price point where an uptrend or a downtrend exhausts itself and reverses. . What are the main components of TD Sequential? TD Sequential has two parts – TD Setup and TD Countdown. The first phase of TD Sequential starts with a TD Setup and is completed with a 9 count. When the 9 count is completed, it is at that point, a price pause, price pullback, or reversal is likely. It is also at tha
Gann Square of 144
Taras Slobodyanik
4.33 (6)
The Gann Box (or Gann Square) is a market analysis method based on the "Mathematical formula for market predictions" article by W.D. Gann. This indicator can plot three models of Squares: 90, 52(104), 144. There are six variants of grids and two variants of arcs. You can plot multiple squares on one chart simultaneously. Parameters Square — selection of a square model: 90 — square of 90 (or square of nine); 52 (104) — square of 52 (or 104); 144 — universal square of 144; 144 (full) — "full"
The trend is your friend! This is what this indicator is all about. Follow this famous saying and be safe. Characteristics: Buy/Sell signals fixed on the close of a bar. Works on all symbols and all timeframes. Clear visual market trend laser line, Buy/Sell signal arrows, market strength meter, TP1 & TP2 boxes. Visual signals when to enter, when to exit the market. No repainting. Compatible with Flexible EA for trading automation. (Ask for a free set file optimized to perform 2010-2018) Para
Advanced Trend Regime
Shellard Securities (Pty) Ltd
The indicator has been designed to function on any time-frame and any pair.   This regime filter will help the trader better evaluate whether the current market is trending, and in which direction. It quickly reacts to changes in market dynamics using a series of advanced calculations. The user is able to select whether the calculation remains standard, or if a further filter constraint is added to the calculation.   A Yellow moving average of the signal has been included for the trader to smoot
About the Lyne indicator Lyne is a Metatrader 4 (MT4) indicator, the essence of which is to transform the accumulated historical data. The Lyne indicator makes it possible to detect various features and patterns in price dynamics that are invisible to the naked eye. Based on this information, traders can anticipate further price movement and adjust their strategy accordingly. This indicator has proven itself in the scalping strategy. The indicator works without repainting.
MetaTrader 4(MT4)用「Two Moving Average Crossover」インディケータは、2本の移動平均線を表示し、移動平均線が交差した際に通知するテクニカル分析ツールです。 このインディケータは、2本の移動平均を計算し、一方が速く、もう一方が遅い移動平均をプロットします。速い方の移動平均が遅い方の移動平均を上回った場合、強気シグナルと見なされ、トレンドの反転や新しい上昇トレンドの開始を示唆します。逆に、速い方の移動平均が遅い方の移動平均を下回ると、弱気 のシグナルとなり、トレンドの反転や新たな下降トレンドの開始を示唆し ます。 このインディケータは、単純移動平均(SMA)、指数移動平均(EMA)、平滑化 移動平均(SMMA)、線形加重移動平均(LWMA)など、異なるタイプの移動 平均を使用するようにカスタマイズすることが可能です。また、トレーダーの取引スタイルや好みに合わせて、各移動平均の期間を調整することができます。 移動平均のプロットだけでなく、クロスオーバーが発生した際にアラートを発 生させます。トレーダーは、クロスオーバーが発生したときに、音声または
Chart Patterns Detect 15 patterns (Ascending Triangle, Descending Triangle, Rising Wedge, Falling Wedge, Bullish Flag, Bearish Flag, Bullish Rectangle, Bearish Rectangle Symmetrical triangle, Head and Shoulders, Inverted Head and Shoulders, Triple top, Triple Bottom, Double Top, Double Bottom) Use historical data to calculate the probability of each pattern to succeed (possibility to filter notification according to the chance of success) gives graphic indication about the invalidation level and
This is the FXTraderariel-TakeProfit - Stop Loss Indicator . It provides you 3 potential Take Profits and 1 Stop Loss. These potential targets are computed based on several methods . The indicator can be used on every time frame, but we advise to use it on H1, H4 and D1. Especially if you are a novice trader. Pro Traders can also you use it for scalping in smaller time frames (M1, M5 and M15). This indicator is not a complete trading system. It doesn't provide you a Signal nor can predict the m
This indicator triggers an alert for one of the most popular methods used in Stochastic Oscillator. This is as follow: a buying alert when the Oscillator (either MAIN [%K] or SIGNAL [%D]) falls below a specific level (e.g., 20) and then rises above that level. a selling alert when the Oscillator rises above a specific level (e.g., 80) and then falls below that level. Note: this tool was developed based on the code of Stochastic Oscillator indicator included by default in MetaTrader 4 terminal
"The trend is your friend" is one of the best known sayings in investing, because capturing large trendy price movements can be extremely profitable. However, trading with the trend is often easier said than done, because many indicators are based on price reversals not trends. These aren't very effective at identifying trendy periods, or predicting whether trends will continue. We developed the Trendiness Index to help address this problem by indicating the strength and direction of price trend
Heiken Ashi candle chart is an improved version of The Japanese candle chart, which can effectively filter the market "noise" of the Japanese candle chart. It is favored by many traders for its simplicity and intuition. For trend traders, the HA candle chart is a magic tool. Unlike the traditional Japanese candle chart, Heikenashi does not reflect the opening price, high price, low price and closing price of the market. Instead, Heikenashi calculates the value of a single K line in the dominant
Binary Options Support Resistance Indicator This indicator is designed for binary options trading and effectively shows retracements from support and resistance levels. Signals appear on the current candle. A red arrow pointing downwards indicates a potential selling opportunity, while a blue arrow pointing upwards suggests buying opportunities. All that needs adjustment is the color of the signal arrows. It is recommended to use it on the M1-M5 timeframes as signals are frequent on these timef
Trade with Gann on your side!! MASTER CIRCLE 360 CIRCLE CHART, originally created by Gann admitted that this is “The Mother of all charts”. It is one of the last studies that this great trader left for us. The numeric tab le is apparently quite simple like all the tables and is based on square numbers, the SQUARE OF 12 and is by evolution, one of the most important square numbers. Here we can find CYCLE, PRICE AND TIME thanks to angles and grades, to show past and future support and resistance.
What are Heiken Ashi Candles? Heiken Ashi, derived from the Japanese term 'Heikin Ashi,' translates to average price bars. It's an indicator depicting price bars on a chart. Formula for Heiken Ashi candles: - Heiken Ashi opening price: (previous candle's opening + closing price) / 2 - Closing price Heiken Ashi: (opening + high + low + closing) / 4 - Heiken Ashi peak: Max of high, opening, or closing price - Heiken Ashi bottom price: Min of low, opening, or closing price How to Read Heik
The RTrends indicator does two things: first, it automatically draws the layout of the price chart by plotting trend lines and, secondly, it produces bearish and bullish signals. The layout reflects the fractal nature of the market. Trends from different time horizons are applied simultaneously on the chart. Thus, from a single chart a trader can see trend lines of higher timeframes. The lines, depending on the horizon, differ in color and width: the older the horizon, the thicker the line is. T
Owl smart levels
Sergey Ermolov
4.63 (54)
MT5版  |   FAQ Owl Smart Levels Indicator   は、 Bill Williams   の高度なフラクタル、市場の正しい波構造を構築する Valable ZigZag、エントリの正確なレベルをマークする Fibonacci レベルなどの一般的な市場分析ツールを含む 1 つのインジケーター内の完全な取引システムです。 利益を得るために市場と場所に。 戦略の詳細な説明 インジケータを操作するための指示 顧問-取引助手 プライベートユーザーチャット ->購入後に私に書いて、私はプライベートチャットにあなたを追加し、あなたはそこにすべてのボーナスをダウンロードすることができます 力はシンプルさにあります! Owl Smart Levels   取引システムは非常に使いやすいので、専門家にも、市場を勉強し始めて自分で取引戦略を選択し始めたばかりの人にも適しています。 戦略と指標に秘密の数式や計算方法が隠されているわけではなく、すべての戦略指標は公開されています。 Owl Smart Levels を使用すると、取引を開始するためのシグナルをすばやく確認し、
Insider Scalper Binary This tool is designed to trade binary options. for short temporary spends. to make a deal is worth the moment of receiving the signal and only 1 candle if it is m1 then only for a minute and so in accordance with the timeframe. for better results, you need to select well-volatile charts.... recommended currency pairs eur | usd, usd | jpy .... the indicator is already configured, you just have to add it to the chart and trade .... The indicator signals the next can
このプロダクトを購入した人は以下も購入しています
Gann Made Easy は、ミスター・ギャンの理論を使用した取引の最良の原則に基づいた、プロフェッショナルで使いやすい外国為替取引システムです。 W・D・ガン。このインジケーターは、ストップロスとテイクプロフィットレベルを含む正確な買いと売りのシグナルを提供します。 PUSH通知を利用して外出先でも取引可能です。 購入後はご連絡ください!私の取引のヒントと素晴らしいボーナスインジケーターを無料で共有します! おそらく、ギャンの取引手法についてはすでに何度も聞いたことがあるでしょう。通常、ギャンの理論は初心者のトレーダーだけでなく、すでにある程度の取引経験がある人にとっても非常に複雑なものです。なぜなら、ギャンの取引手法は理論的にはそれほど簡単に適用できるものではないからです。私はその知識を磨き、最良の原則を私の外国為替インジケーターに組み込むために数年を費やしました。 このインジケーターは非常に簡単に適用できます。必要なのは、それをチャートに添付し、簡単な取引推奨事項に従うだけです。このインジケーターは常に市場分析の仕事を行い、取引の機会を探します。適切なエントリーポイントを検出
まず第一に、この取引インジケーターは再描画されず、再描画されず、遅延しないことを強調する価値があります。これにより、手動取引とロボット取引の両方に理想的なものになります。 ユーザーマニュアル:設定、入力、戦略。 アトミックアナリストは、価格の強さとモメンタムを利用して市場でより良いエッジを見つけるためのPA価格アクションインジケーターです。ノイズや誤ったシグナルを除去し、取引ポテンシャルを高めるための高度なフィルターを備えています。複雑なインジケーターの複数のレイヤーを使用して、アトミックアナリストはチャートをスキャンし、複雑な数学的計算をシンプルなシグナルと色に変換します。これにより、どのような初心者トレーダーでも理解して使用し、一貫した取引の決定を行うことができます。 「アトミックアナリスト」は、新規および経験豊富なトレーダー向けにカスタマイズされた包括的な取引ソリューションです。プレミアムインジケーターとトップノッチの機能を1つの取引戦略に組み合わせ、すべてのタイプのトレーダーにとって汎用性のある選択肢にします。 デイリートレーディングとスキャルピング戦略:高
Reversal First Impulse levels (RFI)    INSTRUCTIONS        RUS       -       ENG              R ecommended to use with an indicator   -   TREND PRO -  Version MT5 A key element in trading is zones or levels from which decisions to buy or sell a trading instrument are made. Despite attempts by major players to conceal their presence in the market, they inevitably leave traces. Our task was to learn how to identify these traces and interpret them correctly. Main functions: Displaying active zones
現在26%オフ 初心者やエキスパートトレーダーに最適なソリューション! このインジケーターは、独自の機能と新しい計算式を取り入れた、ユニークで高品質、かつ手頃な価格のトレーディングツールです。たった1枚のチャートで28の為替ペアの通貨強度を読み取ることができます。新しいトレンドやスキャルピングチャンスの引き金となるポイントを正確に特定することができるので、あなたのトレードがどのように改善されるか想像してみてください。 ユーザーマニュアルはこちら  https://www.mql5.com/en/blogs/post/697384 これが最初の1本、オリジナルだ! 価値のないクローンを買わないでください。 特別な サブウィンドウの矢印で強い通貨の勢いを表示 GAPがあなたのトレードを導く! 基準通貨や気配値が売られすぎ・買われすぎのゾーン(外相フィボナッチレベル)にあるとき、個別チャートのメインウィンドウに警告表示。 通貨がレンジの外側から反落した場合、プルバック/リバーサルのアラート。 クロスパターンの特別なアラート 複数の時間枠を選択可能で、トレンドを素早く
An exclusive indicator that utilizes an innovative algorithm to swiftly and accurately determine the market trend. The indicator automatically calculates opening, closing, and profit levels, providing detailed trading statistics. With these features, you can choose the most appropriate trading instrument for the current market conditions. Additionally, you can easily integrate your own arrow indicators into Scalper Inside Pro to quickly evaluate their statistics and profitability. Scalper Inside
Trend Punch
Mohamed Hassan
4.8 (15)
Manual guide:   Click here WEEK SALE PROMO:   $65 ONLY!  -- Next price is  $120 .  This indicator is unstoppable when combined with our other indicator called  Support & Resistance . After purchase, send us a message and you will get it   for  FREE as a BONUS! I like to use Trend Punch on XAUUSD on the M1 timeframe & higher ones!  Introducing Trend Punch , the revolutionary forex trend indicator that will transform the way you trade! Trend Punch is uniquely designed to provide pre
現在20%OFF! 初心者やエキスパートトレーダーのためのベストソリューション! このダッシュボードソフトウェアは、28の通貨ペアで動作しています。それは私達の主要な指標(高度な通貨の強さ28と高度な通貨インパルス)の2に基づいています。それは全体の外国為替市場の大きい概観を与えます。それは、すべての(9)時間枠で28の外国為替ペアのための高度な通貨の強さの値、通貨の動きの速度と信号を示しています。チャート上で1つのインディケータを使用して市場全体を観察し、トレンドやスキャルピングの機会をピンポイントで見つけることができたら、あなたのトレードがどのように改善されるか想像してみてください。 このインディケータには、強い通貨と弱い通貨の識別、潜在的な取引の識別と確認がより簡単になるような機能が搭載されています。このインディケータは、通貨の強さや弱さが増加しているか減少しているか、また、すべての時間枠でどのように機能しているかをグラフィカルに表示します。 新機能として、現在の市場環境の変化に適応するダイナミックなマーケットフィボナッチレベルが追加され、すでに当社のAdvan
Legacy of Gann
Pavel Zamoshnikov
4.83 (12)
The indicator very accurately determines the levels of the possible end of the trend and profit fixing. The method of determining levels is based on the ideas of W.D.Gann, using an algorithm developed by his follower Kirill Borovsky. Extremely high reliability of reaching levels (according to K. Borovsky  - 80-90%) Indispensable for any trading strategy – every trader needs to determine the exit point from the market! Precisely determines targets on any timeframes and any instruments (forex, met
通貨強さウィザードは、取引を成功させるためのオールインワン ソリューションを提供する非常に強力な指標です。このインジケーターは、複数の時間枠のすべての通貨のデータを使用して、このまたはその外国為替ペアのパワーを計算します。このデータは、使いやすい通貨インデックスと通貨パワーラインの形式で表され、特定の通貨のパワーを確認するために使用できます。 必要なのは、取引したいチャートにインジケーターを接続することだけです。インジケーターは、取引する通貨の実際の強さを示します。このインジケーターは、トレンドに合わせて取引するときに有利に利用できる売買高の圧力の極値も示します。このインジケーターには、フィボナッチに基づく可能なターゲットも表示されます。 このインジケーターは、PUSH 通知を含むあらゆるタイプのアラートを提供します。 購入後ご連絡下さい。私の取引のヒントをあなたと共有し、素晴らしいボーナスインジケーターを無料で提供します! 幸せで有益な取引をお祈りします。
まず第一に、この取引ツールはノンリペイント、ノンリドロー、ノンラグの指標であり、プロの取引に理想的ですことを強調する価値があります。 オンラインコース、ユーザーマニュアル、デモ。 スマートプライスアクションコンセプトインジケーターは、新米から経験豊富なトレーダーまで、非常 に強力なツールです。Inner Circle Trader AnalysisやSmart Money Concepts Trading Strategiesなど、20以上の有用な指標を1つに組み合わせています。このインジケーターはスマートマネーコンセプトに焦点を当て、大手機関の取引方法を提供し、彼らの動きを予測するのに役立ちます。 特に、流動性分析に優れており、機関がどのように取引しているかを理解しやすくしています。市場のトレンドを予測し、価格の動きを慎重に分析するのに優れています。機関の戦略とトレードを合わせることで、市場の動向についてより正確な予測ができます。このインジケーターは多目的であり、市場構造を分析し、重要な注文ブロックを特定し、さまざまなパターンを認識するのに優れています。 このインジケー
TPSpro TRENDPRO  - is a trend indicator that automatically analyzes the market and provides information about the trend and each of its changes, as well as giving signals for entering trades without redrawing! The indicator uses each candle, analyzing them separately. referring to different impulses - up or down impulse. Exact entry points into transactions for currencies, crypto, metals, stocks, indices!  -  Version MT5               DETAILED DESCRIPTION                R ecommended to use with
Enigmera
Ivan Stefanov
5 (3)
エニグメラ:市場の中核 https://www.enigmera.com はじめに このインディケータと取引システムは、金融市場に対する驚くべきアプローチです。ENIGMERAは、フラクタルサイクルを使用して、サポートとレジスタンスレベルを正確に計算します。本格的な蓄積局面を示し、方向性と目標を示します。 トレンド中でも調整中でも機能するシステムです。 どのように作動するのか? ENIGMERAは、支持線・抵抗線、目標線、乖離線の3つのラインで構成されています。このシステムは、過去のデータを現在と未来に外挿する典型的な市場指標とは異なり、現在の完全な画像を提供します。支持線上にある場合、それは本当の支持を意味し、抵抗線上にある場合、それは本当の抵抗を意味する。ある水準が破られた場合、それはトレンドの変化を意味する。再描画はしない。 市場は常に進化しているため、ENIGMERAはその評価ツールを適応させ、定期的に戦略を修正しています。  これにより、すべてのシナリオが徹底的に評価されることが保証されます。この市場指標の独自性は、その能力を見れば明らかです。  ENIGM
mql5と Telegramの モーニング・ブリーフィングで、詳細とスクリーンショットを含む毎日のマーケット・アップデートをご覧 ください! FX Power MT4 NGは 、長年の人気を誇る通貨強度計FX Powerの次世代モデルです。 この次世代ストレングスメーターは何を提供するのでしょうか?初代FXパワーの魅力すべて プラス GOLD/XAUの強さ分析 より正確な計算結果 個別に設定可能な分析期間 カスタマイズ可能な計算上限値により、さらに優れたパフォーマンスを実現 もっと見たい人のための特別なマルチインスタンス設定 すべてのチャートでお好みの色を無限に設定可能 数え切れないほどの通知オプションにより、重要なことを見逃すことはありません。 Windows 11とmacOSのスタイルで角を丸くした新しいデザイン 魔法のように動くインジケーターパネル FXパワーの主な機能 すべての主要通貨の強さの完全な履歴 すべての時間枠における通貨の強さの履歴 すべてのブローカーとチャートで同一の計算結果 100%信頼できるリアルタイム計算 -> リペイントなし ドロップダウン・リストから
PRO Renko Systemは、特別にRENKOチャートを取引するために設計された高精度の取引システムです。 これは、様々な取引商品に適用することができる普遍的なシステムです。 システムは効果的に正確な逆転信号へのアクセスを与えるいわゆる市場の騒音を中和する。 表示器は非常に使いやすく、信号の生成に責任がある1つの変数だけがあります。 あなたは簡単にお好みの任意の取引ツールとレンコバーのサイズにツールを適応させることができます。 私はいつもあなたが私のソフトウェアで収益性の高い取引を支援するために余分なサポートを提供する準備ができています! 私はあなたに幸せで収益性の高い取引をしたいです! ご購入後にご連絡ください! 私はあなたに私のレンコチャートジェネレータを送信します。 私はまた、私の個人的な推奨事項やシステムの他のモジュールを無料で共有します!
Advanced Supply Demand
Bernhard Schweigert
4.92 (313)
現在33%オフ 初心者にもエキスパートトレーダーにも最適なソリューション このインジケーターは独自の機能と新しい公式を多数内蔵しており、ユニークで高品質かつ手頃な取引ツールです。このアップデートでは、2つの時間枠ゾーンを表示できるようになります。より長いTFだけでなく、チャートTFとより長いTF(ネストゾーンを表示)の両方を表示できます。すべてのSupply Demandトレーダーの皆さんのお気に召すはずです。:) 重要情報の公開 Advanced Supply Demandの可能性を最大化するには、 https://www.mql5.com/ja/blogs/post/720245 にアクセスしてください。   エントリーまたはターゲットの正確なトリガーポイントを正確に特定できれば取引がどのように改善されるか想像してみてください。新しい基盤となるアルゴリズムに基づいて構築されているため、買い手と売り手の間の潜在的な不均衡をさらに簡単に特定できます。これは、最も強い需要と供給のゾーンと、過去のパフォーマンス(古いゾーンを表示)がグラフィカルに表現されるためです。これらの機能は、最適
市場の2つの基本原則に基づく日中戦略。 このアルゴリズムは、追加のフィルターを使用したボリュームと価格の波の分析に基づいています。インディケータのインテリジェントアルゴリズムは、2つの市場要因が1つに結合した場合にのみシグナルを出します。インディケータは、より高い時間枠のデータを使用して、M1チャート上の特定の範囲の波を計算します。そして波を確認するために、インジケーターはボリュームによる分析を使用します。 このインディケータはレディトレーディングシステムです。トレーダーが必要とするのは、信号に従うことだけです。また、インジケーターはあなた自身の取引システムの基礎になることができます。取引はミニッツチャートでのみ行われます。 インジケーターがMTFの原則を使用しているという事実にもかかわらず、インジケーターのアルゴリズムは可能な限り安定しています。 購入後、必ず私に書いてください!私の取引設定と推奨事項をあなたと共有します!
ご紹介   クォンタム トレンド スナイパー インジケーターは 、トレンド反転を特定して取引する方法を変革する画期的な MQL5 インジケーターです。 13年以上の取引経験を持つ経験豊富なトレーダーのチームによって開発されました。     クォンタムトレンドスナイパーインジケーター   は、非常に高い精度でトレンドの反転を識別する革新的な方法で、あなたのトレーディングの旅を新たな高みに押し上げるように設計されています。 ***Quantum Trend Sniper Indicatorを購入すると、Quantum Breakout Indicatorを無料で入手できます!*** クォンタム ブレイクアウト インジケーターは、トレンドの反転を特定するとアラートを発し、矢印を示し、3 つのテイクプロフィットレベルを提案します。 初心者トレーダーにもプロのトレーダーにも適しています。 量子EAチャネル:       ここをクリック MT5のバージョン:       ここをクリック 推奨事項: 期間: すべての時間枠。最良の結果を得るには、
FX Volume
Daniel Stein
4.6 (35)
mql5と Telegramの モーニング・ブリーフィングで、詳細とスクリーンショットを含む毎日のマーケット・アップデートをご覧 ください! FX Volumeは、ブローカーの視点から市場のセンチメントをリアルに洞察する、最初で唯一の出来高インジケーターです。 ブローカーのような機関投資家が外国為替市場でどのようなポジションをとっているか、COTレポートよりもはるかに速く、素晴らしい洞察を提供します。 この情報をチャート上で直接見ることは、あなたの取引にとって真のゲームチェンジャーであり、画期的なソリューションです。 以下のようなユニークなマーケットデータ洞察から利益を得てください。 比率は 、通貨のロングポジションとショートポジションの比率をパーセントで表示します。 比率の変化は 、選択した期間内のロング比率とその変化率を表示します。 Volumes Totalは 、通貨の取引量(ロングとショート)の合計をロット単位で表示します。 Volumes Long :全通貨のロングポジションの取引量を表示します。 Volumes(ショート )は、全通貨のショートポジションの取引量を表示
TakePropips Donchian Trend Pro
Eric John Pajarillaga Aldana
4.82 (17)
TakePropips Donchian Trend Pro   (MT4) は、ドンチャン チャネルを使用してトレンドの方向を自動的に検出し、エントリーとエグジットの取引シグナルを提供する強力で効果的なツールです! この多機能インジケーターには、トレンド スキャナー、取引シグナル、統計パネル、スクリーナー、取引セッション、およびアラート履歴ダッシュボードが含まれます。取引シグナルを提供し、チャートを分析する時間を節約するように設計されています! ユーザー マニュアルとインストール ガイドは、ブログ投稿 (   https://www.mql5.com/en/blogs/post/751368   ) からダウンロードできます。 今日は 50% オフ! 98ドルから49ドルに値下げ! このインジケーターは、ストラテジー テスターでテストできます (ビジュアル モードを有効にします)。 詳細については、説明の下にあるビデオ チュートリアルも利用できます。 ご不明な点やサポートが必要な場合は、私に連絡してください。 TakePropips Donchian Trend Pro イン
ご紹介     Quantum Breakout PRO は 、ブレイクアウト ゾーンの取引方法を変革する画期的な MQL5 インジケーターです。 13年以上の取引経験を持つ経験豊富なトレーダーのチームによって開発された Quantum Breakout PROは 、革新的でダイナミックなブレイクアウトゾーン戦略により、あなたの取引の旅を新たな高みに押し上げるように設計されています。 クォンタム ブレイクアウト インジケーターは、5 つの利益ターゲット ゾーンを備えたブレイクアウト ゾーン上のシグナル矢印と、ブレイクアウト ボックスに基づいたストップロスの提案を提供します。 初心者トレーダーにもプロのトレーダーにも適しています。 量子EAチャネル:       ここをクリック MT5バージョン:   ここをクリック 重要!購入後、インストールマニュアルを受け取るためにプライベートメッセージを送ってください。 推奨事項: 時間枠: M15 通貨ペア: GBPJPY、EURJPY、USDJPY、NZDUSD、XAUUSD アカウントの種類: ECN、Raw、また
現在31%オフ! 初心者やエキスパートトレーダーに最適なソリューション! このインジケータは、独自の機能と秘密の数式を組み込んだ、ユニークで高品質かつ手頃な価格のトレーディングツールです。たった1枚のチャートで28の通貨ペアのアラートを表示します。新しいトレンドやスキャルピングチャンスの引き金となるポイントを正確に把握することができるので、あなたのトレードがどのように改善されるか想像してみてください! 新しい基本的なアルゴリズムに基づいて構築されているため、潜在的な取引の特定と確認がより簡単になります。これは、通貨の強さや弱さが加速しているかどうかをグラフィカルに表示し、その加速のスピードを測定するためです。加速すると物事は明らかに速く進みますが、これはFX市場でも同じです。つまり、反対方向に加速している通貨をペアにすれば、利益を生む可能性のある取引を特定することができるのです。 通貨の勢いを示す縦の線と矢印は、あなたの取引の指針となるでしょう。 ダイナミックマーケットフィボナッチ23レベルはアラートトリガーとして使用され、市場の動きに適応します。もしインパルスが黄色
Indicator : RealValueIndicator Description : RealValueIndicator is a powerful tool designed specifically for trading on the EURUSD pair. This indicator analyzes all EUR and USD pairs, calculates their real currency strength values, and displays them as a single realistic value to give you a head start on price. This indicator will tell you moves before they happen if you use it right. RealValueIndicator allows you to get a quick and accurate overview of the EURUSD currency pair tops and bottoms,
TrendDecoder Premium
Christophe Pa Trouillas
5 (6)
レンジと次の動きを特定    |  トレンドの最も早いシグナルと強さを得る   |  反転の前に明確な出口を得る   |  価格がテストするフィボ・レベルを見つける。 非リペイント、非遅延インディケータ - マニュアルおよび自動売買に最適 - すべての資産、すべての時間単位に対応 期間限定キャンペーン   >> 50%OFF 購入後、 推奨セッティングについては、このチャンネルで私に連絡してください。 MT5 バージョン: ここをクリック BladeSCALPER   と   PowerZONES   を使った完全な方法を入手する どのようなものですか? TrendDECODERは、トレンド監視をシンプルかつ簡単にするための複数のイノベーションを集約したものです。 Projective TrendLine (投影トレンドライン) - 今後のトレンドのスピードリファレンス。 RealTime TrendLine vs. Projective TrendLine (リアルタイムトレンドライン vs. Projective TrendLine) - 市場が同じ方
ICT, SMC, SMART MONEY CONCEPTS, SMART MONEY, Smart Money Concept, Support and Resistance, Trend Analysis, Price Action, Market Structure, Order Blocks, BOS/CHoCH,   Breaker Blocks ,  Momentum Shift,   Supply&Demand Zone/Order Blocks , Strong Imbalance, HH/LL/HL/LH,    Fair Value Gap, FVG,  Premium  &   Discount   Zones, Fibonacci Retracement, OTE, Buy Side Liquidity, Sell Side Liquidity, BSL/SSL Taken, Equal Highs & Lows, MTF Dashboard, Multiple Time Frame, BigBar, HTF OB, HTF Market Structure, 
Thise indicator is up down v6  comes with tradingwiev pinescript. purchased people, after installed on terminal ,contact me on mql5  to get BONUS  TradingView pinescript. up-down indicator is no repaint and works all pairs and lower than weekly time frames charts. it is suitable also 1 m charts for all pairs. and hold long way to signal. dont gives too many signals. when red histogram cross trigger line that is up signal.and price probably will down when blue histogram cross trigger line that
ECM Elite Channel is a volatility-based indicator, developed with a specific time algorithm, which consists of finding possible corrections in the market. This indicator shows two outer lines, an inner line (retracement line) and an arrow sign, where the channel theory is to help identify overbought and oversold conditions in the market. The market price will generally fall between the boundaries of the channel. If prices touch or move outside the channel, it's a trading opportunity. The
Gold Channel is a volatility-based indicator, developed with a specific timing algorithm for the XAUUSD pair, which consists of finding possible corrections in the market. This indicator shows two outer lines, an inner line (retracement line) and an arrow sign, where the theory of the channel is to help identify overbought and oversold conditions in the market. The market price will generally fall between the boundaries of the channel. If prices touch or move outside the channel it is a tra
Gann Signal is a very simple indicator at first glance, but hidden inside is many years of experience in studying W.D.Ganna methods. The indicator gives accurate BUY/SELL signals, without redrawing. The indicator is very easy to use. All you need to do is attach it to your chart and follow its recommendations. The indicator constantly analyzes the market for entry opportunities. When such an opportunity appears, the indicator gives a signal in the form of an arrow. I repeat, all signals are NOT
Please send me Direct message on MQL5 CHAT after purchasing the Indicator for Training and Installation Support There are some additional files that is important to use with the Indicator . So be sure to contact me after purchasing the Indicator So that I can add you for training and support . If you find any difficulty with installation then send me Direct message here So that I can connect with you via Anydesk or Teamview for the product installation. " Smart Order Block Indicator " to find
Introduction to X3 Chart Pattern Scanner X3 Cherart Pattern Scanner is the non-repainting and non-lagging indicator detecting X3 chart patterns including Harmonic pattern, Elliott Wave pattern, X3 patterns, and Japanese Candlestick patterns. Historical patterns match with signal patterns. Hence, you can readily develop the solid trading strategy in your chart. More importantly, this superb pattern scanner can detect the optimal pattern of its kind. In addition, you can switch on and off individu
作者のその他のプロダクト
または(TDO)は、「純粋な勢い 」の原則を使用して価格変動率を測定する指標です。 証券価格が10から15に上がると、価格の変化率は150%になりますが、15から10に戻ると、価格の変化率は33.3%になります。そのため、「価格変化率」(ROC)や「モメンタム」などのテクニカル分析指標は、下降するものよりも上昇する価格の動きの方が高い値を示します。 TDOはこの問題を修正して、トレーダーが勢いを正しく読み取るのを支援します。 重要な情報 TDOユーザーズマニュアル: https://www.mql5.com/en/blogs/post/717970 TDO FAQ: https://www.mql5.com/en/blogs/post/722015 TDOビデオライブラリ: https://www.mql5.com/en/blogs/post/722018 TDOエキスパートアドバイザーの例: https://www.mql5.com/en/blogs/post/731141 TDOの機能 TDOは純粋な勢いをパーセントとして計算するため、さまざまな市場のさまざまな
Bermaui Bands
Muhammad Elbermawi
4.94 (90)
Bermaui Bands(BB)は、レンジとトレンドの価格変動をフィルタリングするのに役立つテクニカル分析ツールです。この指標の背後にある考え方は、次のステップで説明できます。 標準偏差を0〜100の間で移動するオシレーターとして計算します。これをBermaui偏差パーセント(BD%)と名付けます。 「BD%」がゼロに近い場合、ボラティリティは極端になります。さらに、「BD%」が100に近い場合、ボラティリティは非常に低くなります。 ボラティリティが高いということは、トレンド市場の可能性が高いことを意味し、ボラティリティが低いということは、横向きまたはレンジング市場を意味します。 標準偏差はSMAに基づいて計算されるため、中央の線は単純移動平均(SMA)です。 計算で同じバー数の単純移動平均に「BD%」を追加して、アッパーベルマウイバンドを取得します。 計算で同じ数のバーを使用した単純な移動平均から「BD%」を減算して、Lower BermauiBandsを取得します。 重要な情報 Bermaui Bandsユーザーズマニュアル: https://www.mql5.com/en/b
Bermaui Manual EA
Muhammad Elbermawi
5 (10)
これは、グリッドシステムを取引する半自動のエキスパートアドバイザーです。アイデアは、市場で徐々にさまざまなポジションを取り、次にそれらの損益分岐点を計算することです。価格がこの損益分岐点を所定の距離だけ通過すると、すべての未決済注文がクローズされます。 重要な情報 ユーザーガイドは次のとおりです。   https://www.mql5.com/en/blogs/post/730567 このEAは、他のどの製品でも試すことができ ます。https://www.mql5.com/en/users/bermaui314/seller 重要な機能 EAには、予期しない結果から取引資本を保護するためのストップロスメカニズムがあります。 EURUSD-XAUUSD-Oil-BitcoinのようなMT4シンボルを取引することができます。 MT4の時間枠をトレードすることができます。 VPSからEAを実行することをお勧めします。 パラメータとデフォルト設定 1)お金の管理設定 ロットを開始します。 レバレッジが1:400以上の場合、デフォルト設定で500ドルごとに0.0
MASR Bands
Muhammad Elbermawi
4.64 (11)
または M oving A verage S upportコマンド R esistance バンド 。 MASRバンドインジケーターは、サポートレベルとレジスタンスレベルとして連携する2つのバンドに囲まれた移動平均です。統計的に、MASRバンドには93%の確率で価格キャンドルが含まれています。ステップ単位での計算方法は次のとおりです。 1.最初のステップは、X期間の最高値(HHV)と最低値(LLV)を計算することです。 2. 2番目のステップは、HHVをLLVで割って、それらの間の距離をパーセンテージで取得することです。このステップの結果をMASRフィルターと呼びます。 3. MASRフィルター=合計((HHV / LLV)-1)/バーの数 4.移動平均抵抗のショートカットであるアッパーバンドをMARと呼びます。移動平均サポートのショートカットである低帯域MASと呼びます。バンド間の移動平均は、センターラインと呼ばれます。 5. MAR = MASRセンター+(75%xMASRフィルターxMASRセンター) 6.MASRセンターは移動平均です。
Bermaui Pin Bars
Muhammad Elbermawi
5 (22)
ベルマウイピンバー または(BPB)は、チャート上でピンバーの価格アクションパターンを見つけるインジケーターです。ピンバーは「ピノキオバー」のショートカットです。これは、高い上部または下部の影と、ハンマー、逆ハンマー、ハンギングマン、シューティングスター、ドラゴンフライ同事、墓石同事などの非常に小さなボディを持つ日本のローソク足に代わる古典的なバーパターンです。 。 Bermaui Pin Barsインジケーターは、次のステップで説明できる式に応じてこのパターンを見つけます。 最初に、BPBはろうそくの本体の中心を計算します(= [開く+閉じる] / 2)。 次に、BPBは、体の中心とろうそくの間の距離が低いことを検出します。 最後のステップは、ステップ2の結果をろうそくの範囲で割ることです。 ろうそくの本体の中心がろうそくの高さまたは低さに近すぎる場合、BPBはピンバーパターンを検出し、ユーザーに警告します。 ベルマウイピンバーフォーミュラ : https://www.mql5.com/en/blogs/post/729139 以下を追加して、Bermauiピンバーの機能を強
BACD Cloud
Muhammad Elbermawi
4.57 (7)
または、 B ermaui A verage C onvergence D ivergence Cloud は、トレンドの方向を示し、その強さをパーセントで測定するオシレーターです。 BACDクラウドの計算は次のとおりです。 1-2つの指数移動平均を計算します。それらの1つは他よりも高速です。最初の(速い)と2番目の(遅い)と呼びます 2-それらの間の中心を見つけます。ここで、Center MA =(Fast + Slow)/ 2 3-次のようにBACDラインを計算します。BACD= 100 *(高速/中央MA) 4-BACDの指数移動平均であるBACD信号線を計算します。式は次のようになります。BACDSignal= EMA(BACD) 5-チャートからBACDシグナルラインを非表示にします。 6- BACDヒストグラムラインを計算します。これは、BACDラインとその信号ラインの差です。 (注:BACDヒストグラムは、ヒストグラムではなく線としてチャートに描画されます。) 7-(BACD Line> BACD Histogram Line)の場合、
Moving Average Cloud
Muhammad Elbermawi
4.93 (14)
または「MAC」。 これは、トレンドをキャプチャしてトレードするのに役立つように設計されたインジケーターです。この指標の背後にある考え方は、次のステップで説明できます。 移動の速い平均エンベロープを描画します。 移動の遅い平均エンベロープを描画します。 MACアッパーバンドは、両方のエンベロープの高値の間の最大値です。 MAC下限帯域は、両方のエンベロープの下限間の最小値です。 MACヒストグラムクラウドは、2つのバンド間の距離を埋めて、方向の変化を示します。 青い雲は上昇傾向を示し、赤い雲は下降傾向を示します。 次のブログを読んで、MACバッファーを使用して独自のEAまたはスキャナーを構築する方法を確認してください。 https://www.mql5.com/en/blogs/post/734293 MACの使い方 トレンドの方向性を特定するのに役立つフィルターとしてMACクラウドを使用します。 通常の取引ツールを使用してMACクラウドの方向に取引し、誤ったシグナルを可能な限り排除します。 提案されたエントリ矢印を使用して、開始する強力なトレンドポイントを見つ
Bermaui Channel
Muhammad Elbermawi
5 (27)
This is a price channel that shows five important price levels on the chart. Those levels are: 1. The Highest High (HH) of the previous x bars. 2. The Highest Low (HL) of the previous x bars. 3. The Center Line. 4. The Lowest High (LH) of the previous x bars. 5. The Lowest Low (LL) of the previous x bars. How does Bermaui Channels Captures Overbought  area Think of the distance between HH and HL levels as an overbought area. When the price candles or bars crosses the HL to the upside this
または CKC。 この指標は、Chester W. Keltner(1909–1998)によって記述された古典的な10日間の移動平均ルールに応じて機能します。すべてのパラメーターはデフォルトでクラシックバージョンのケルトナーシステムに設定されていますが、ユーザーは必要に応じてパラメーターを変更できます。 重要な情報 CKCマニュアルを読む: https://www.mql5.com/en/blogs/post/736577 CKCエキスパートアドバイザーの例: https://www.mql5.com/en/blogs/post/734150 Keltner ChannelFormulaについて 1.標準価格(=(高+低+終値)/ 3)から単純移動平均として中心線を計算します。 2.同じ期間と中心線の計算方法を使用して、高値と安値の平均差である平均日次範囲(ADR)を計算します。 3.ケルトナー購入ライン=センターライン+ ADR。 4.ケルトナーセルライン=センターライン–ADR。 Keltner10日移動平均ルール ケルトナーの公式は、チャート上に2つの
Or DBD%. The indicator consists of colored tape that shows trading signals depending on two Bermaui Deviation Oscillator (BD%) and two moving averages. Bermaui Deviation Percent is a volatility index that measures volatility in percent rather than points. The idea of BD% is to make an index depending on Classic Standard Deviation (CSD) that moves between 0 and 100 percent. Important Information DBD% expert advisor example:  https://www.mql5.com/en/blogs/post/731145 If you want to know mor
この指標のアイデアは、RSIをろうそくの形で描画し、それを価格チャートと比較して売買シグナルを生成することです。指標は私の発明ではありません。私は数年前にインターネット上でそれを設立しました。コードを更新し、アラート機能を追加し、BermauiUtilitiesグループのツールを追加しました。 インディケータはローソク足を引くために使用されるすべての価格のRSIを計算します(始値、高値、安値、終値のRSI)。それらの最も高いものを使用してRSIキャンドルの高い芯を描画し、最も低いものを使用してRSIキャンドルの低い芯を描画します。 RSIキャンドルのボディは高値と安値の間にあります。オープンのRSIがクローズのRSIよりも低い場合、RSIキャンドルは強気と見なされます。オープンのRSIがクローズのRSIよりも高い場合、RSIキャンドルは弱気と見なされます。 どうやって使うのですか RSIキャンドルインジケーターでトレンドラインブレイクアウトをトレードすることができます。これは、勢いが価格をリードするため、価格チャートのトレンドをリードします。 RSIキャンドルインジケーターに任意
Horus EA
Muhammad Elbermawi
3.67 (3)
MT4用のHorusEA 数千年前、古代エジプト人は、自分たちの土地を測定し、商品を計量するために使用するカウントシステムを発明しました。 このシステムは「ホルスの目 」として知られていました。 ホルスの目はオシリス神の神話と関連付けられており、ファラオの神聖なシンボルの1つになりました。 私は、フィボナッチ数列を使用したEye of Horusの数式を使用して、有名な「マルチンゲールシステム」よりも89%安全なネガティブプログレッションマネー管理システムを構築しました。 EAの技術的な部分は、 移動平均クラウド(MAC) と ストキャスティクスに 依存しています。 MACストキャスティクステクニカル分析システムはどのように機能しますか? 1-移動平均クラウド(MAC)が強気の場合、ストキャスティクスが売られ過ぎのレベルを下から横切ると、EAは買い注文を受け取ります。 2-移動平均クラウド(MAC)が弱気の場合、ストキャスティクスが買われ過ぎのレベルを上から横切ると、EAは売り注文を受け取ります。 EAの重要な機能 1-セットごとに1つの取引。 2-明確なス
フィルタ:
ovno27
109
ovno27 2024.04.07 09:09 
 

Fantastic filter/Momentum Indicator.

lilinhui
58
lilinhui 2023.03.12 03:33 
 

非常好的指标。我们可以自信地使用这个指标进行交易。

elite luis
3331
elite luis 2023.03.03 16:00 
 

This is Amazing indicator! Author is very responsive and passionate in his work, Best Buy for 2023! I want to get MT5 version also for Bermaui Deviation Percent, Author please code MT5 ok?

Muhammad Elbermawi
52314
開発者からの返信 Muhammad Elbermawi 2023.03.03 18:43
Thanks a lot for the great review & stars
Ruslan Ostafiichuk
254
Ruslan Ostafiichuk 2023.02.20 08:30 
 

Очень полезный и удобный индикатор. Покупкой доволен.

Cd Vijaya Narayana
645
Cd Vijaya Narayana 2022.12.22 20:20 
 

Very good indicator. we can confidently trade using this indicator.

Muhammad Elbermawi
52314
開発者からの返信 Muhammad Elbermawi 2022.12.22 20:24
Thanks a lot for the great review & stars :)
Najseattle
77
Najseattle 2022.11.27 07:47 
 

The Bermaui Deviation % is definitely one of the top ten indicators I have ever used. Along with a few others also created by Mr. Bermaui. I do recommend you at least test all of his indicators. It may help you to visualize the Markets in a different way that proves beneficial to your trading career! 5 stars

Muhammad Elbermawi
52314
開発者からの返信 Muhammad Elbermawi 2022.11.29 07:49
I really want to thank you for your great words, Nicolas.
powertrader24
80
powertrader24 2022.10.07 08:54 
 

The first indicator I bought from Muhammad was TDO (True Direction Oscillator) about a week ago. I've had great luck using the TDO indicator so, now I purchased his BD% to get even better results from my trading. Keep up the good work Muhammad!

Muhammad Elbermawi
52314
開発者からの返信 Muhammad Elbermawi 2022.10.07 09:18
Thanks a lot for that great review
KEWELL99 Hields
82
KEWELL99 Hields 2022.09.14 21:59 
 

Downloaded the demo and was impressed so just purchased the full version and im in 2 profitable trades already....best thing I can say is though that the developer is happy to share knowledge and has responded to some queries already, this makes a good seller in my opinion. Really like the look of TDO from this developer aswell which I am demoing, his products are visually very helpful - 5 stars, thank you Muhammed

Muhammad Elbermawi
52314
開発者からの返信 Muhammad Elbermawi 2022.09.14 22:10
You are welcome my friend
Jedidiah Benedict
90
Jedidiah Benedict 2022.08.05 18:31 
 

I really like this indicator.

James Sabai-Jai
906
James Sabai-Jai 2022.07.29 11:00 
 

ユーザーは評価に対して何もコメントを残しませんでした

hisunsun
497
hisunsun 2022.07.22 09:02 
 

This indicator spots out the volatility ; it could increase with winning rate on combine with using other indicators.

Vinicius Favarin
322
Vinicius Favarin 2022.07.21 23:04 
 

It's no use throwing money away.

Nikodem Dobrzynski
214
Nikodem Dobrzynski 2022.07.13 20:14 
 

Very good volatility indicator for trading strategy, is useful as filter to protect you to enter week trades. Bermaui Deviation Percent you have to use as combination with other indicators . It’s no secret that all technical analysis indicators are lagging . Also you have to understand that sometimes doesn’t get you into a good trade, it is normal thing using indicators. Overall my rating is five stars.

rodbizness
84
rodbizness 2022.06.11 01:23 
 

Just Very Very GOOD Indicator . Thank again Muhammad for your nice job.

SurfsideTrader
249
SurfsideTrader 2022.05.26 14:30 
 

So far so good. Not only does this indicator generate high probability signals but, equally importantly, it keeps you out of lower probability trades that you may ordinarily have entered.

ck15220
714
ck15220 2022.04.20 05:38 
 

Good indictor accurate signals

Munch Makuchi
1334
Munch Makuchi 2022.04.17 18:00 
 

Seriously nothing like this indicator. With the Bermaui Bands + Deviation% the likelihood of entering a bad trade is almost nothing for as long as you trade with the trend and not entering into resistance or support. Thank you!

deimy
563
deimy 2022.03.28 08:28 
 

Hi Muhammad, good day, i already bought Bermaui Bands and Deviation Percent, and they works good, can you send me BD candles please? thank you for your great indicator, thank you for your sharing

warrior137
1227
warrior137 2022.02.23 20:55 
 

very good indicator

vinoj06
83
vinoj06 2022.02.17 13:36 
 

Good indictor accurate signals.

レビューに返信
バージョン 6.1 2020.03.28
1. Fixed a small bug in the de-initialization function, that used to cause the "Symbols Switch" tool not to work properly.
2. Organized BD% parameters in a better style.
3. Enhanced alert messages.
.
Note:
I didn't make any changes on TDO basic formula. It is still the same.
I didn't make serious changes in indicator parameters or buffers.
バージョン 6.0 2019.12.05
Bermaui Deviation Percent version 5.0:
--------------------------------------------------
1. I worked to enhance the built-in function of the indicator and made the code much more organized than before.

2. This version have much less parameters.

3. Enhanced the panel at the right side of the indicator.

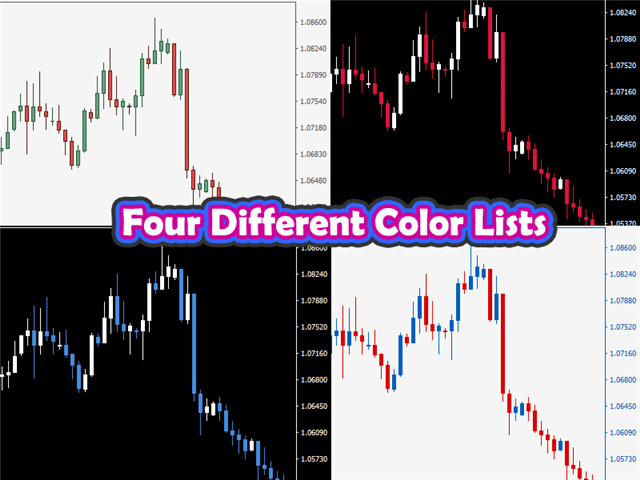
4. Added four Color Lists.

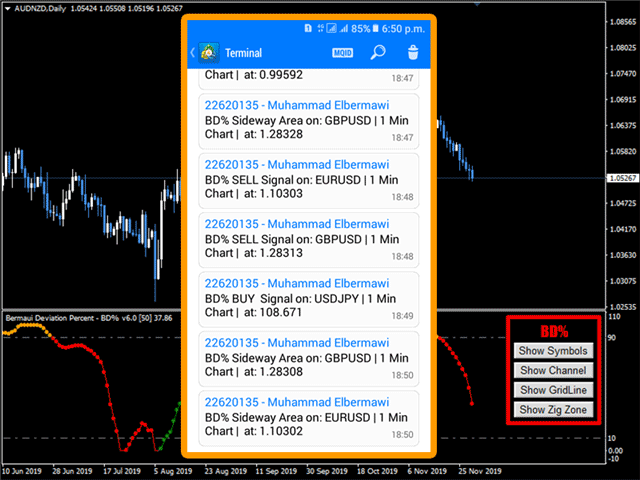
5. Enhanced all alerts and messages code.
バージョン 5.0 2019.07.18
Welcome to Bermaui Deviation Percent version 5.0. In this version:

1. I worked to enhance the built-in function of the indicator and made the code much more organized than before.
2. Made the code more easier to be read with iCustom().
3. Added the option to change font size for buttons.

I hope you like it.
Kind regards
バージョン 4.0 2019.01.11
1. Enhanced BD% calculation method.
2. Organized BD% parameters in a better style.
3. Enhanced the Round Number Grid calculation method.
4. Added sub levels to the Round Number Grid.
5. Added what I call Zig Zone Levels to easily capture support & resistance.
バージョン 3.0 2018.08.03
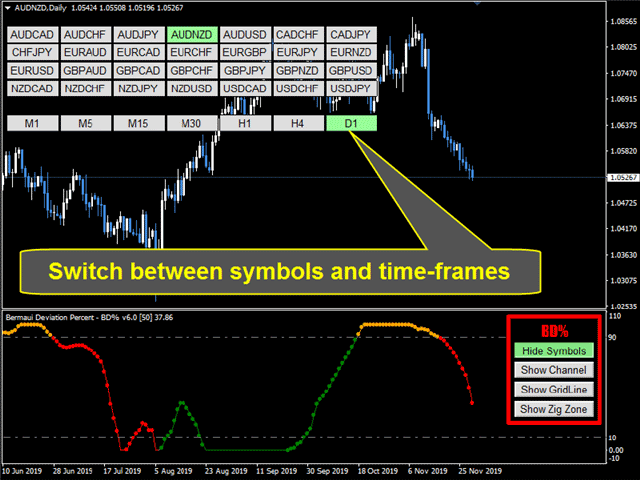
1.1. Added a "Symbol Switch Panel" to make it easy for user to switch between different charts.
1.2. "Symbol Switch Panel" can be from User inputs or from Market Watch window.
1.3. "Symbol Switch Panel" can change chart for current window or open it in a new one.
1.4. User can use "Symbol Switch Panel" to change current chart time frame.
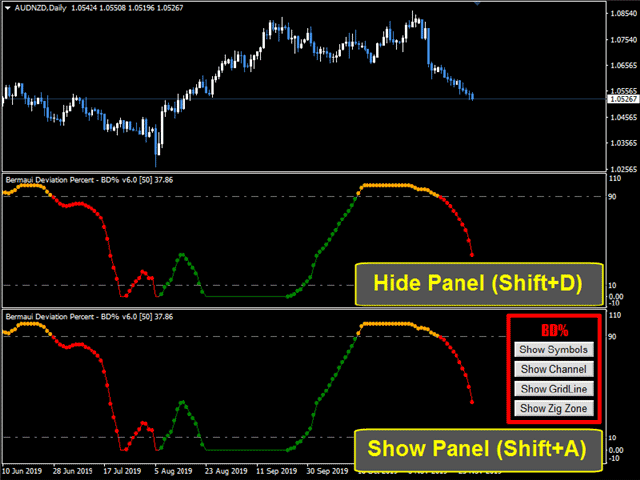
1.5. User control the number of buttons on "Symbol Switch Panel". He can make them appear on main chart or TDO window.
---------------------------------------------------------
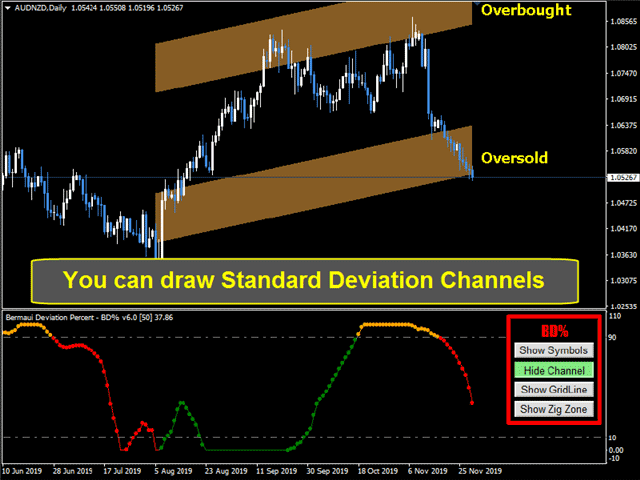
2.1 Added a "Price Channel".
2.2 User can choose between "Standard Deviation" or "Linear Regression" channels.
2.3 User can draw channels as a ray or make them as background.
---------------------------------------------------------
3.1 Added a "Price Grid".
3.2 User can choose between "Automatic Grid" and "Customer Grid".
3.3 User can multiply distance between grid levels.